You Might Like
-
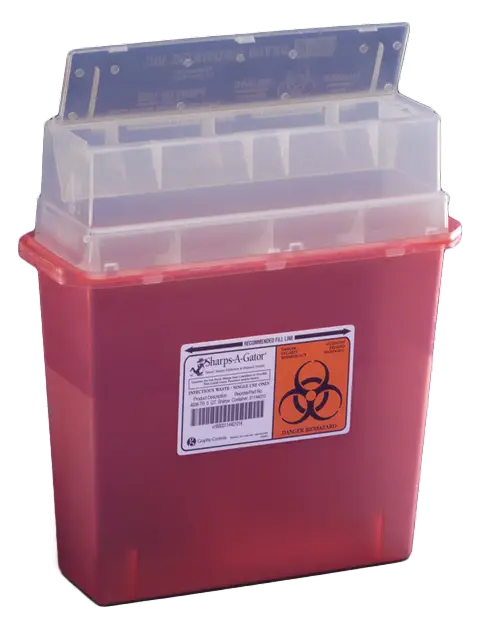
Red Sharps Biohazard Container -

Colored Regional Map of Africa -
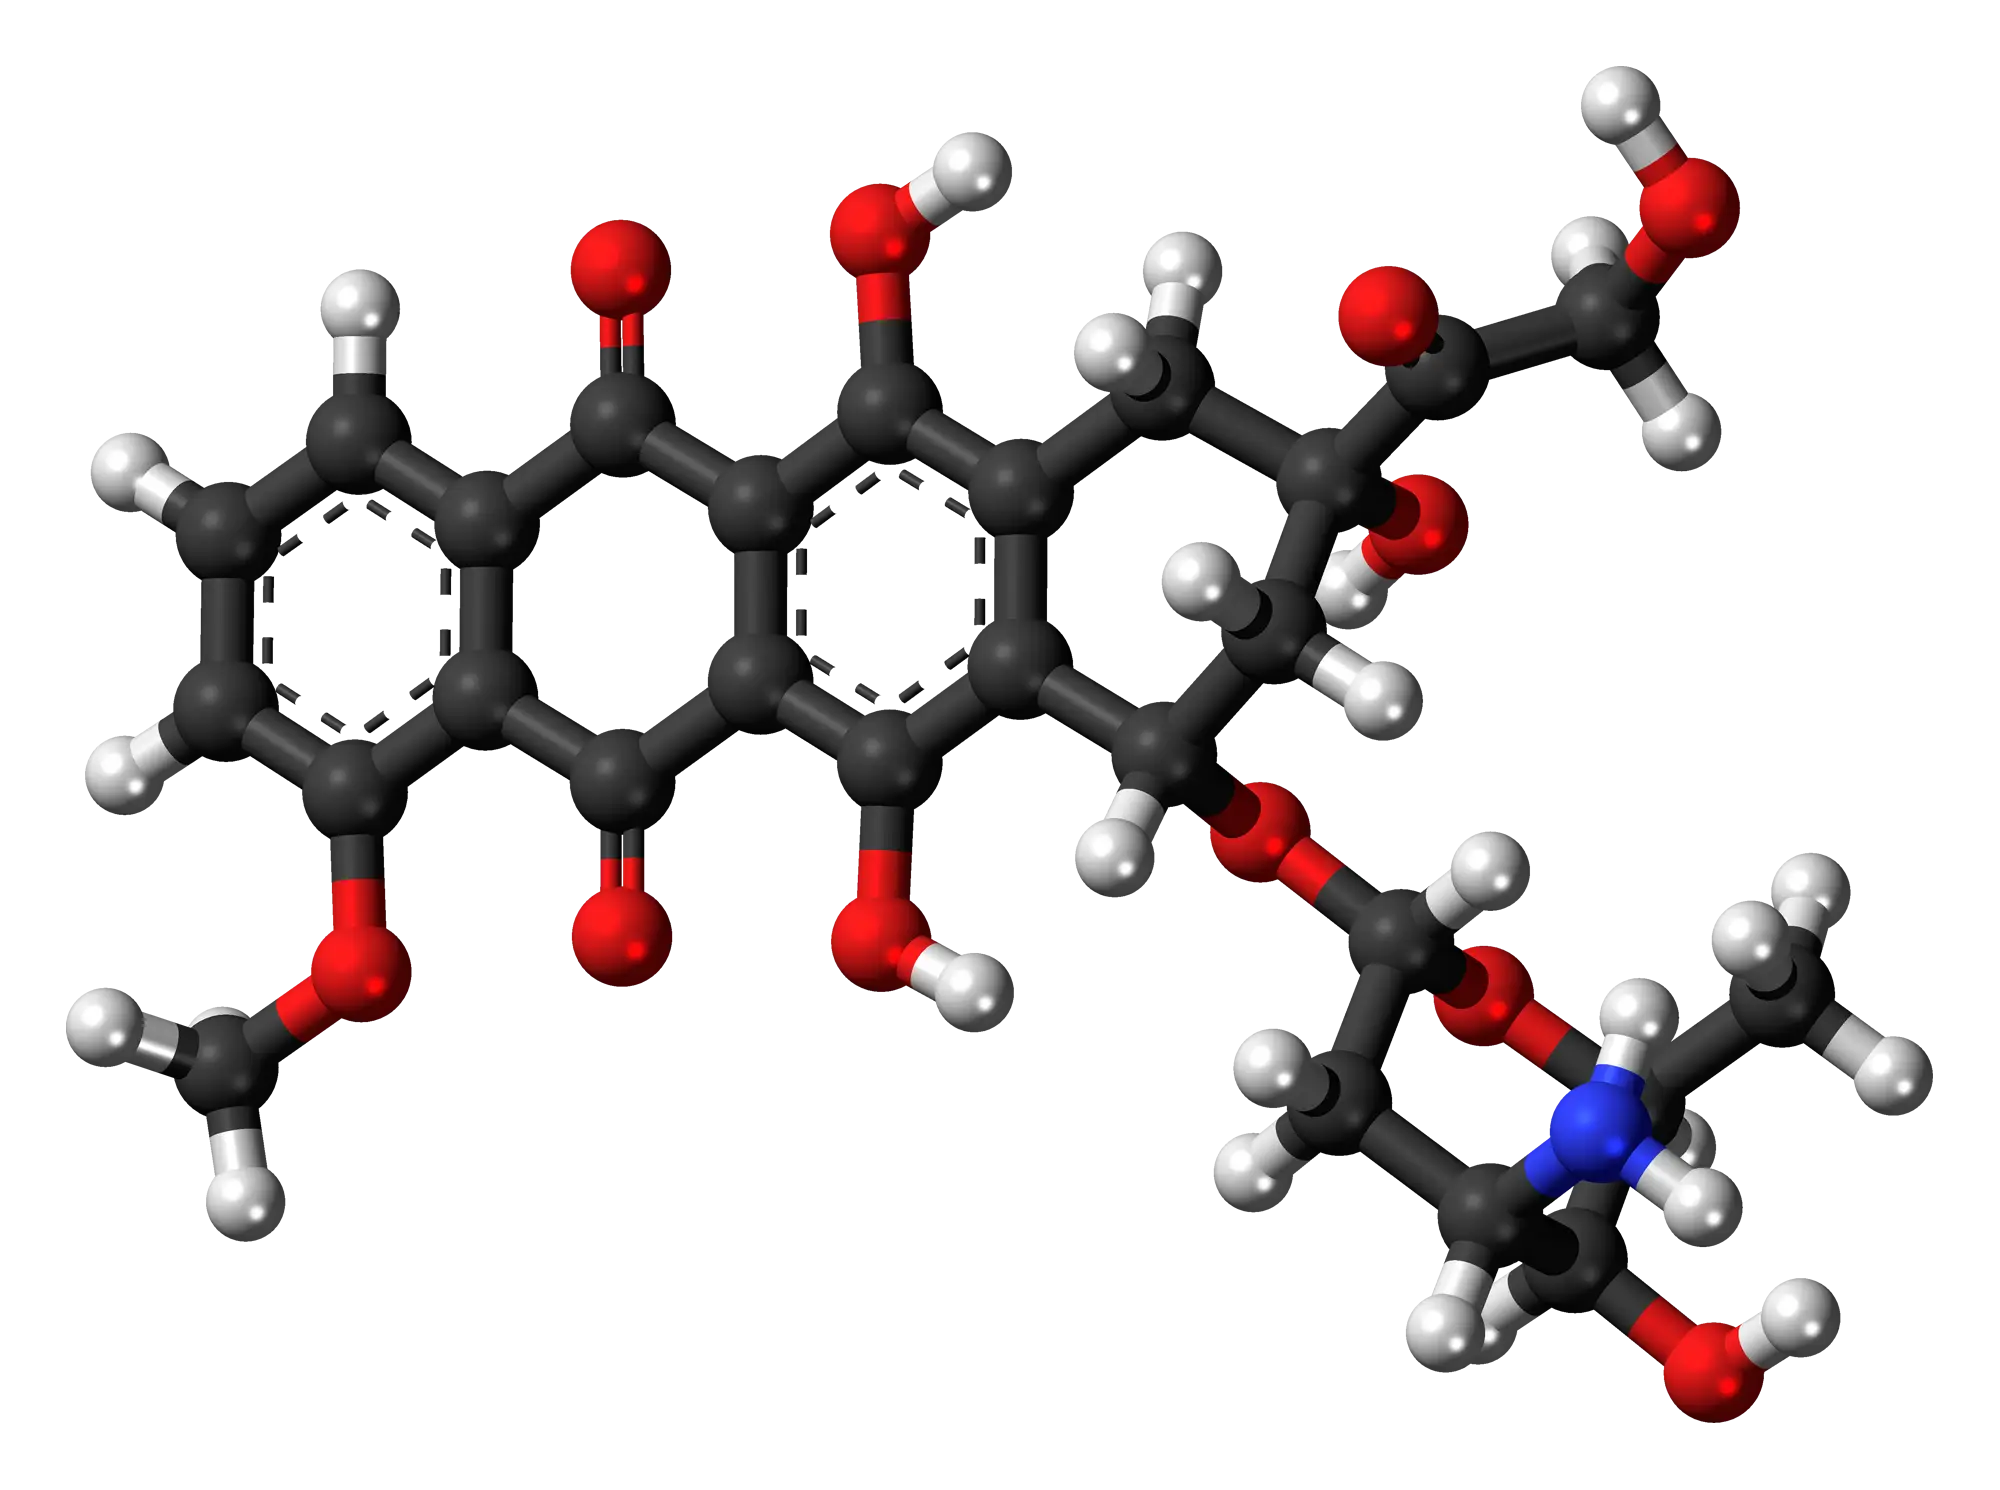
Chemical Molecule Structure Illustration -
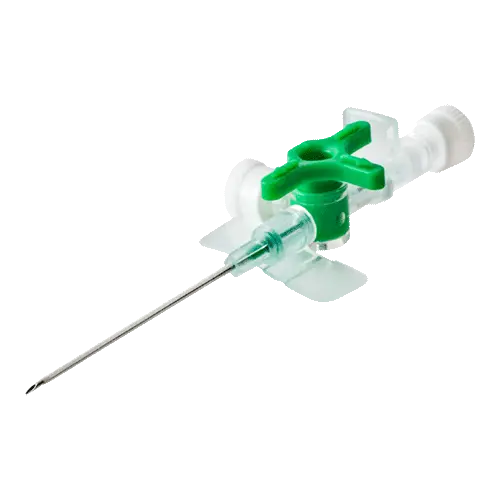
Medical IV Catheter for Injection -

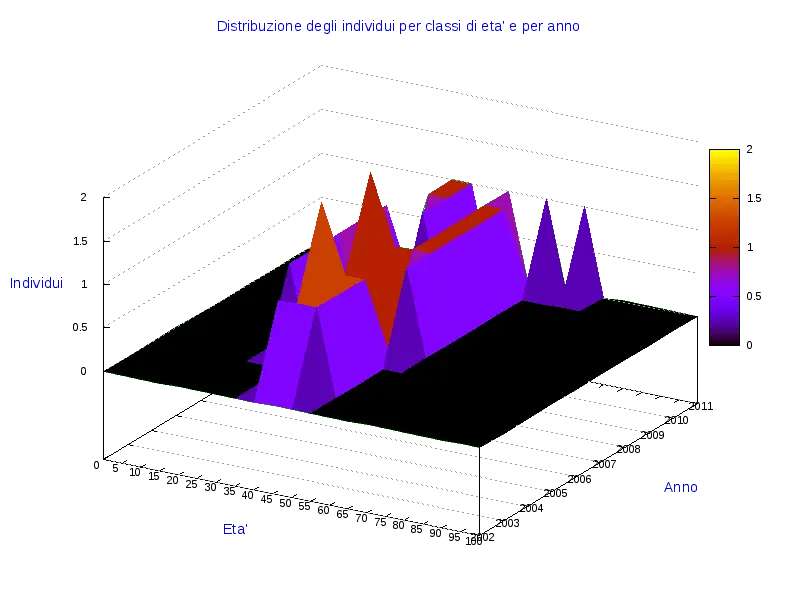
Team with Growth Graph Illustration -
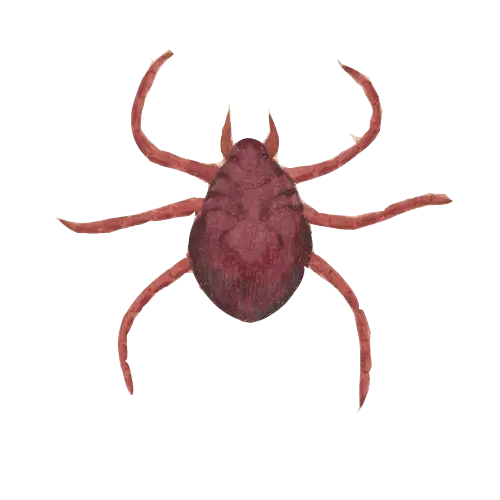
Brown Tick Illustration -

Cartoon Doctor with Stethoscope Illustration -

Various Devices Displaying Software -
Syringe and Medicine Vial Icon -

Complete Blue World Map -

Icon of KPI Dashboard with Graph and Person -
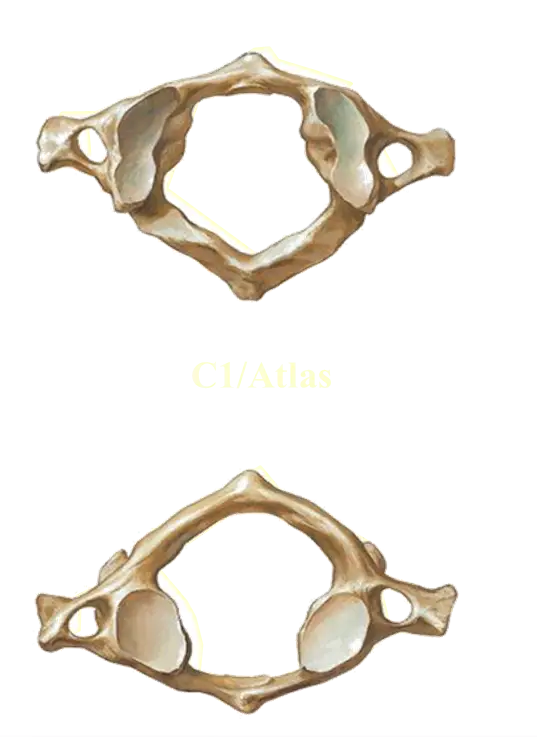
Atlas Vertebra Anatomy -

Dental Logo Design -

Yellow Ethernet Cable for Network Connections -

Bar Chart with Upward Arrow -

Colorful Bookshelf -
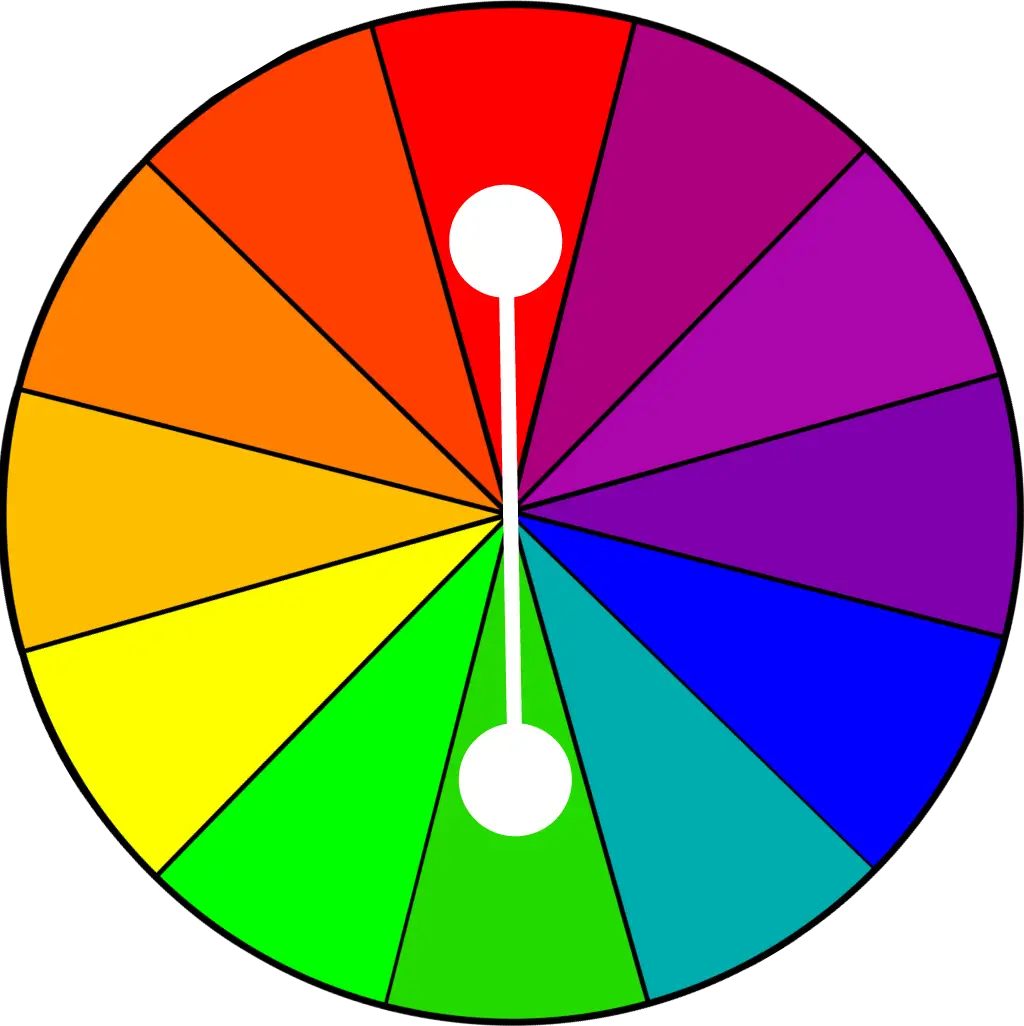
Color Wheel for Artistic Inspiration -

Search Growth Icon -
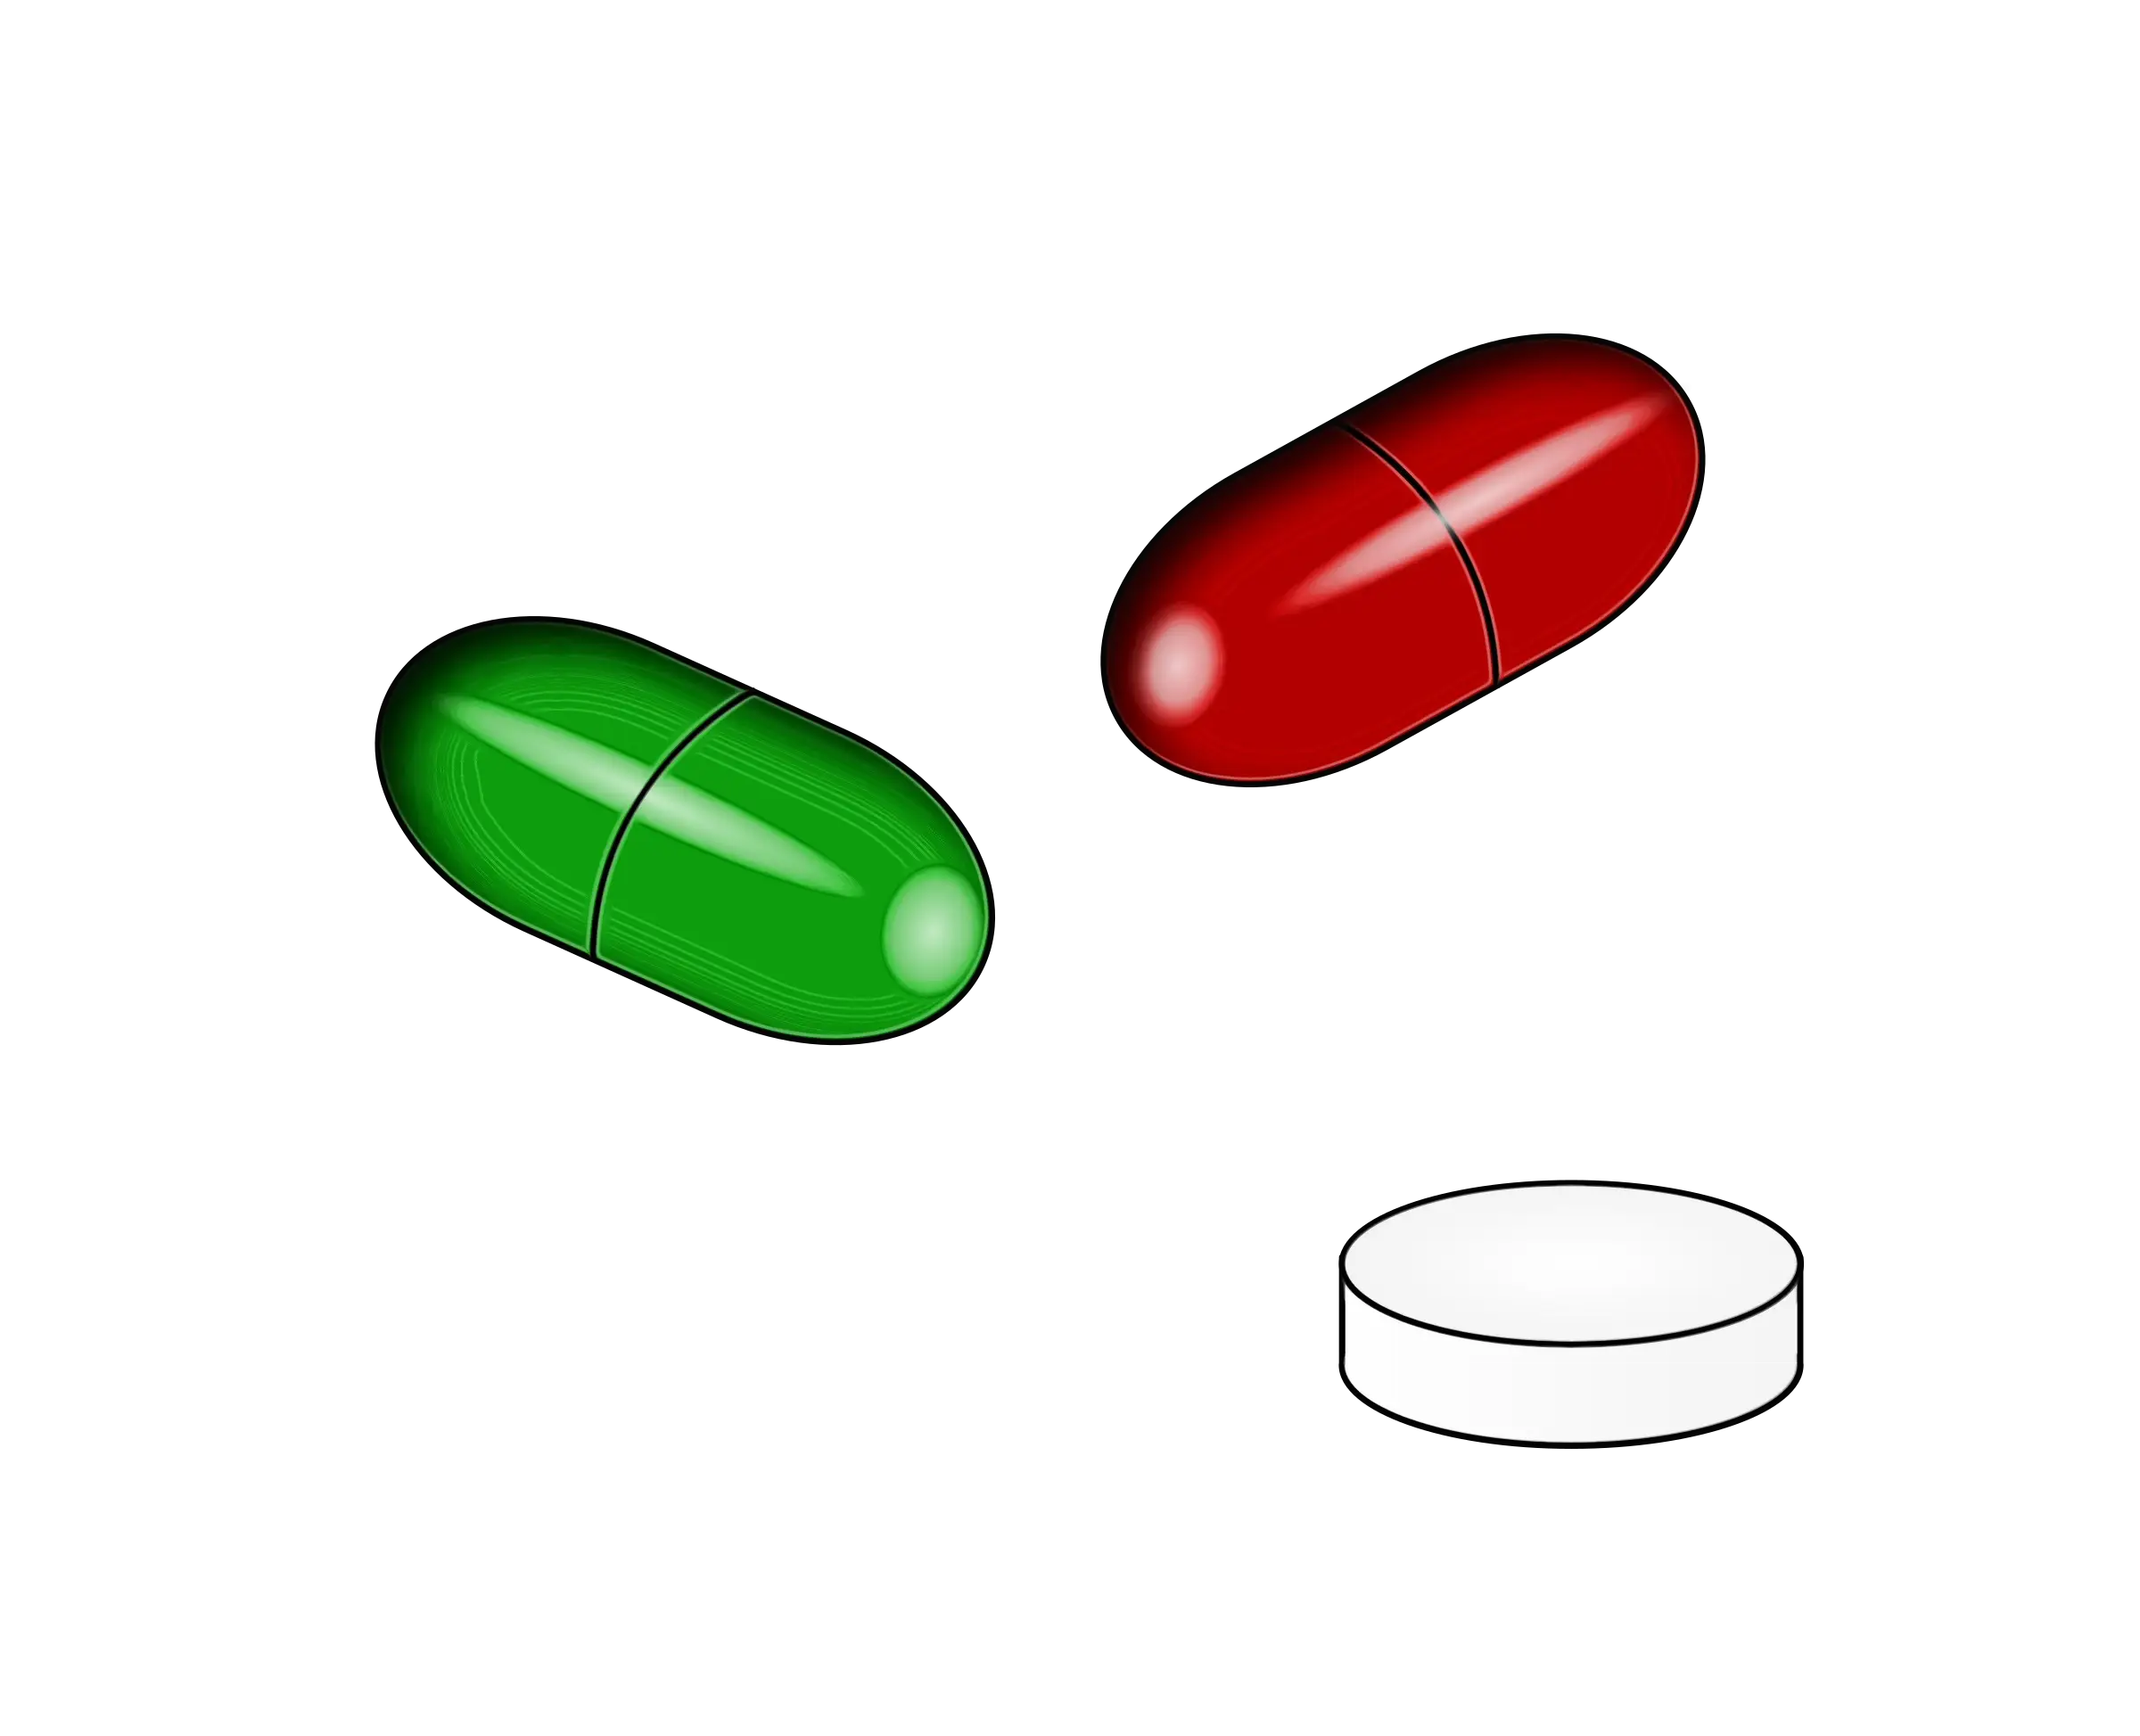
Colorful Capsules and a Tablet Illustration -

Illustration of Growth Chart with Upward Arrow -

Thermometer Symbol Icon -
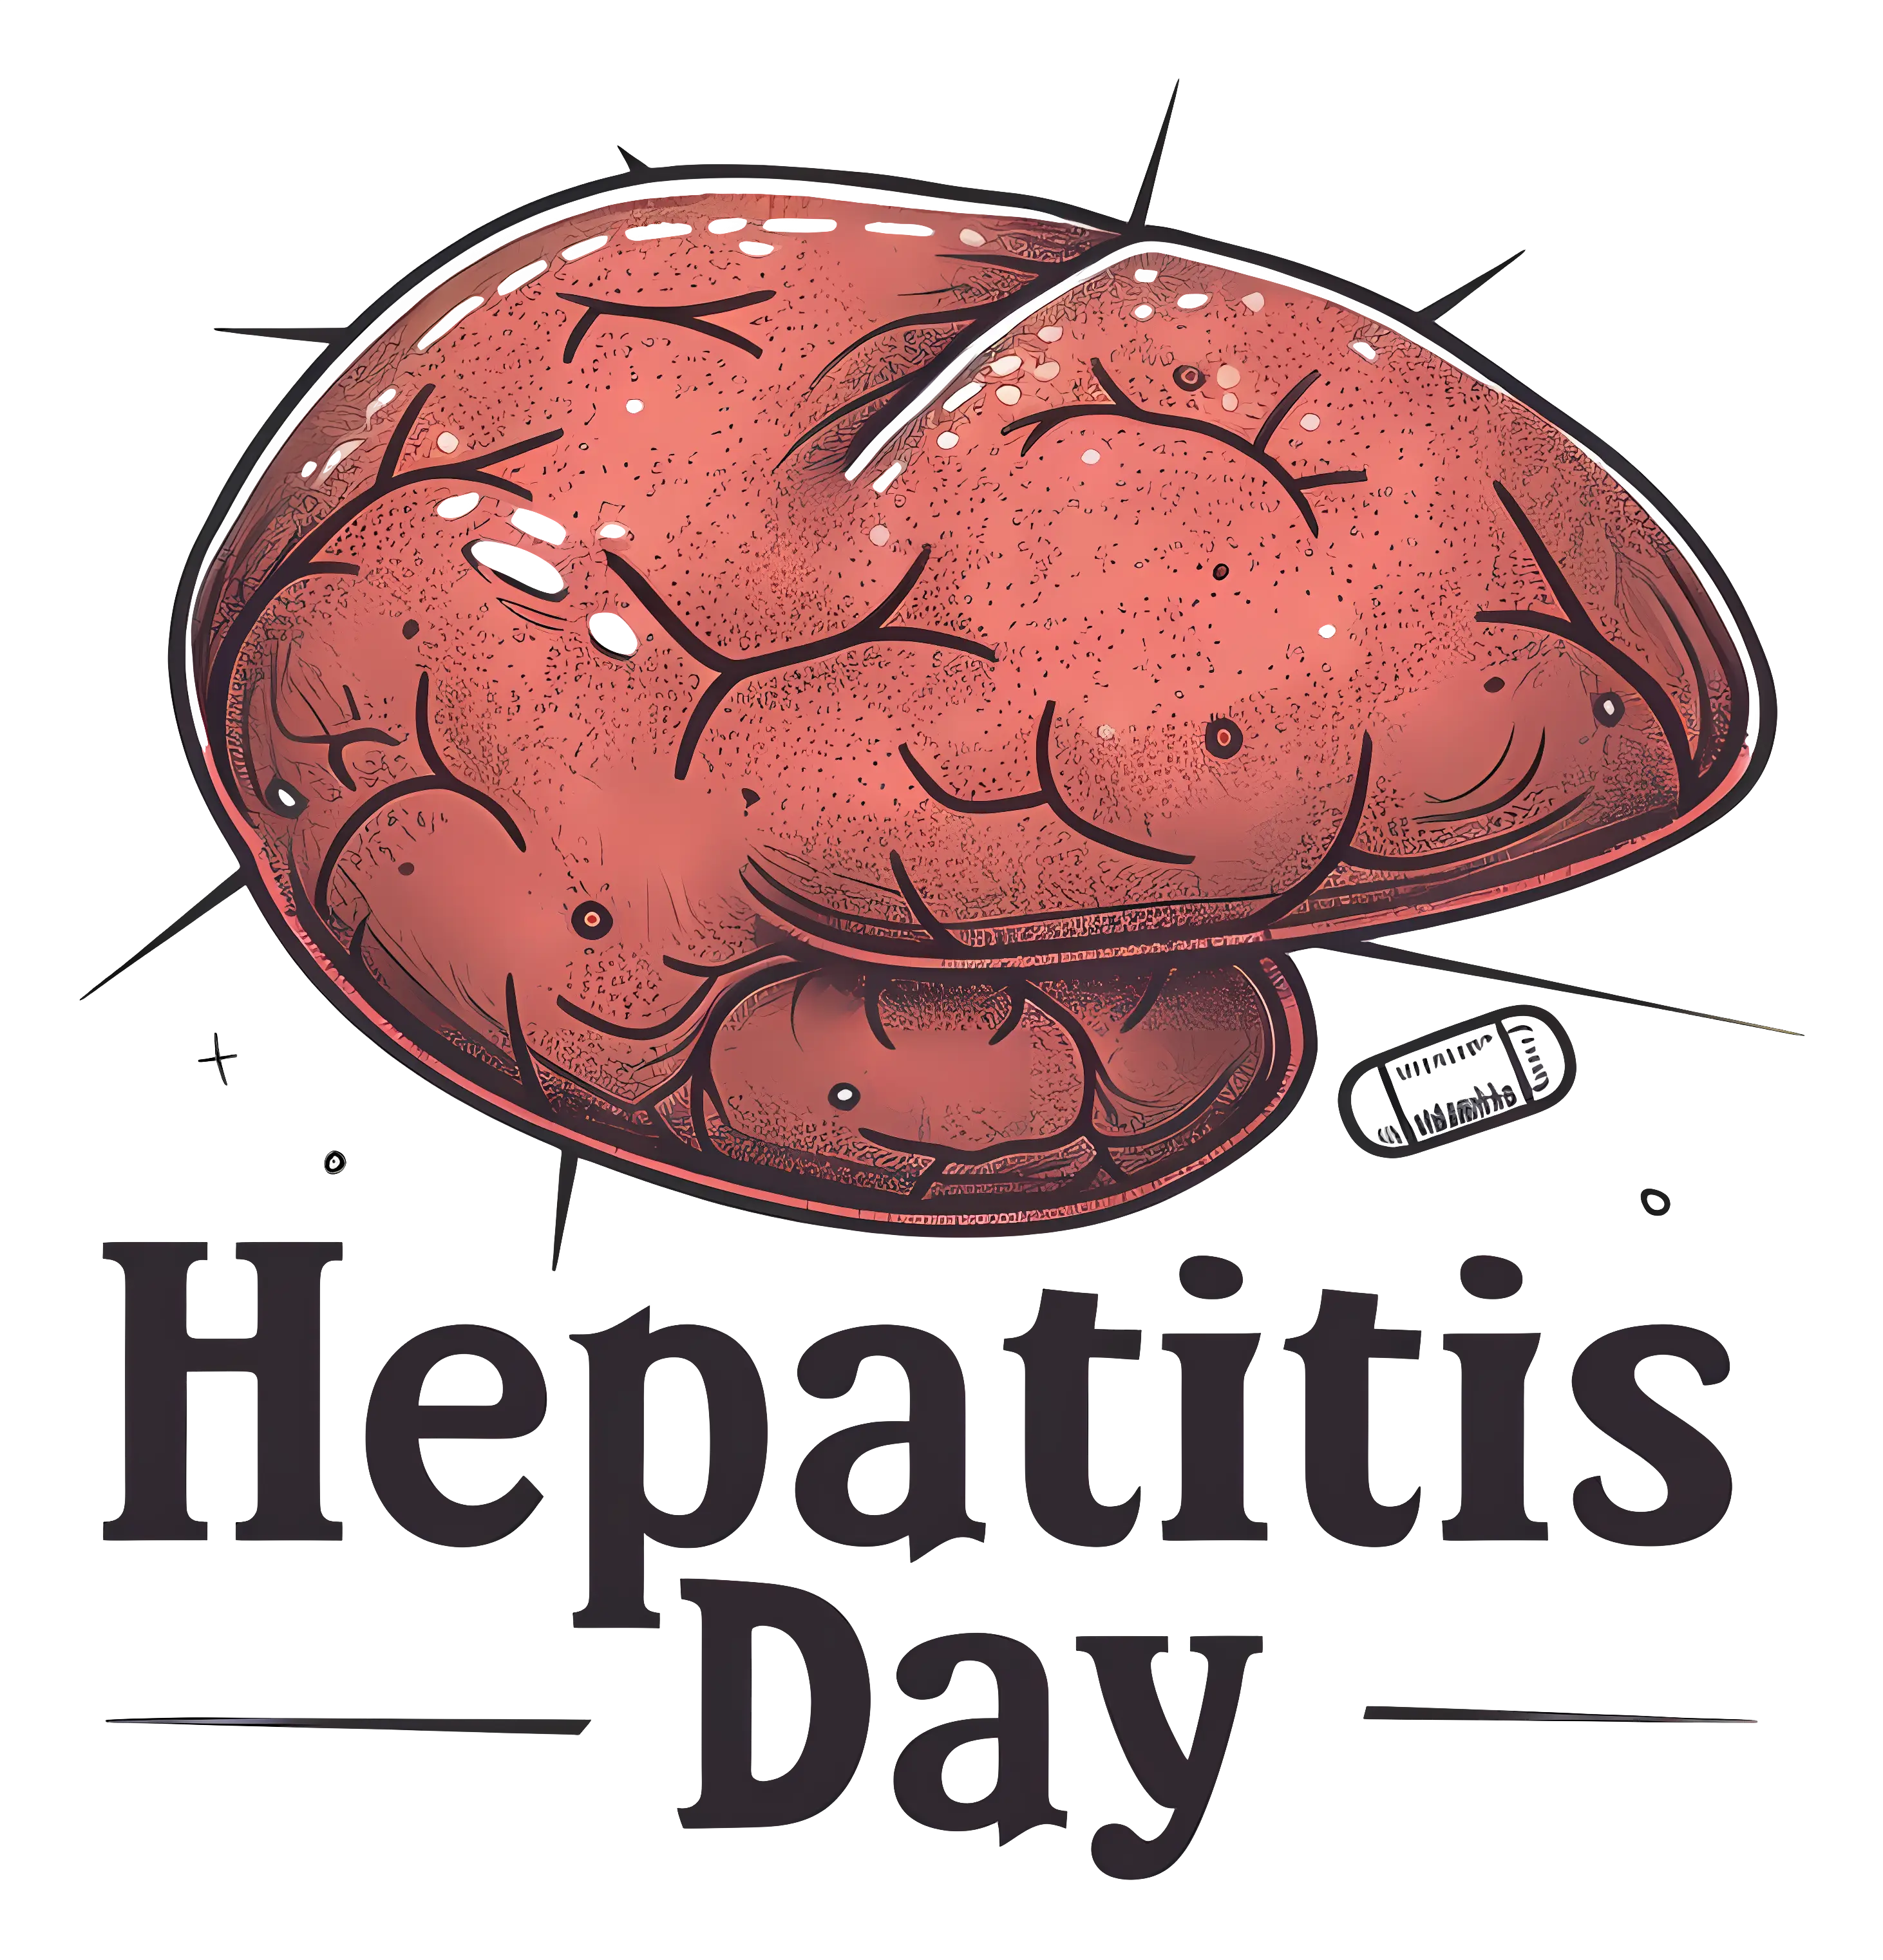
Hepatitis Day Awareness -

Medical Consultation Symbol -

Business Icons Set for Digital Workflows -

Circle Pie Chart Icon -
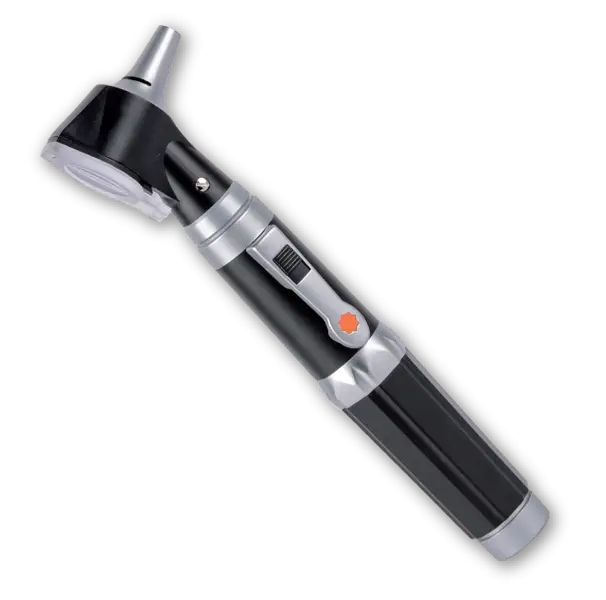
Medical Otoscope Instrument -

Medical Cross Icon in Red Background -
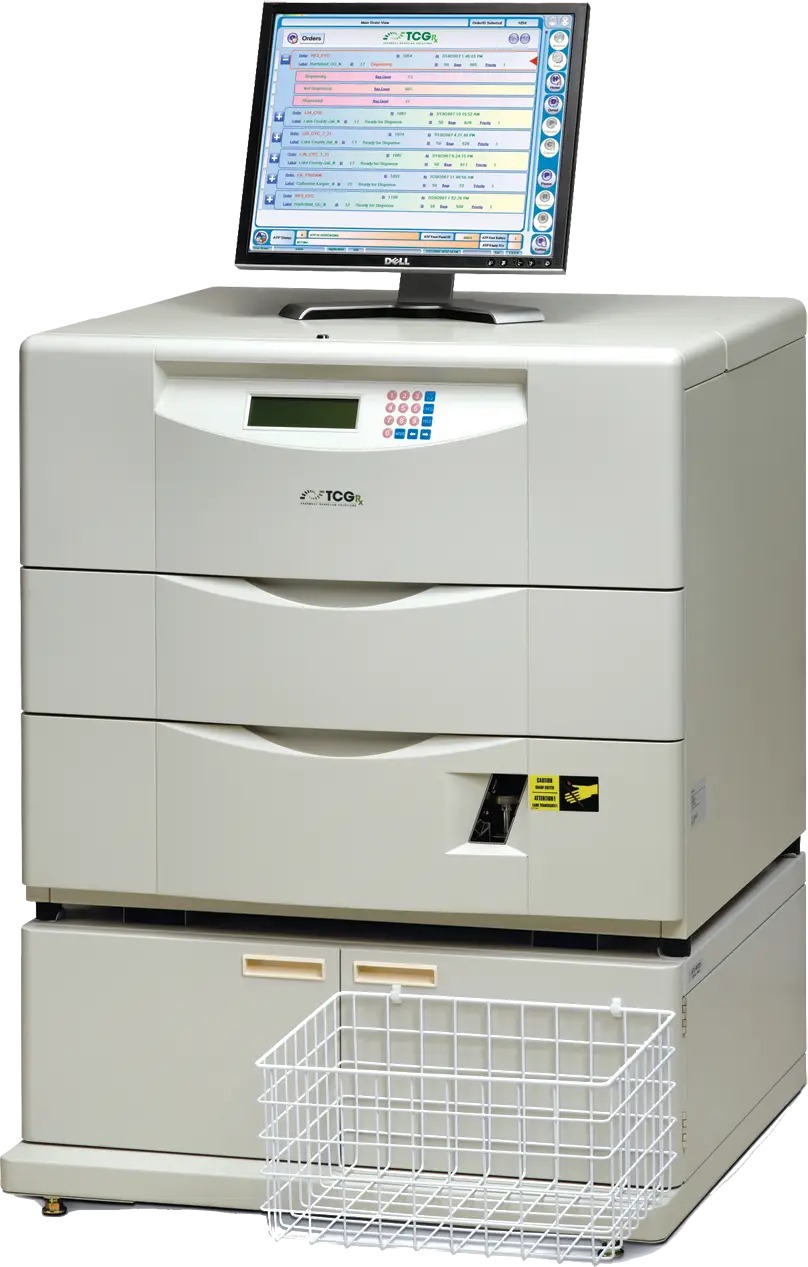
Advanced Medical Equipment -

Cartoon Doctors and Nurses Illustration -
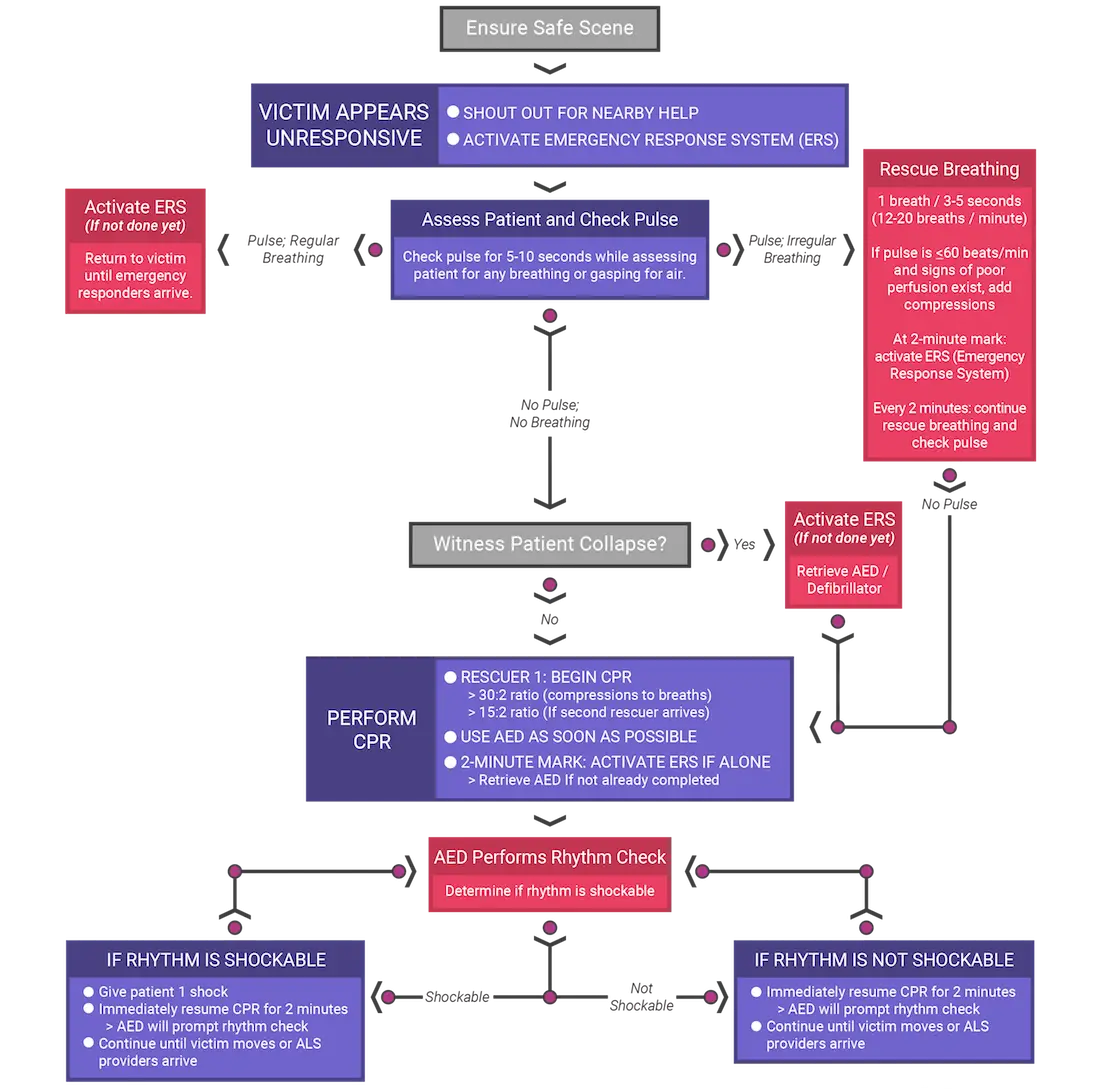
Medical CPR Flowchart Diagram