You Might Like
-

Colored Regional Map of Africa -

Illustration of a Snowball -

Team with Growth Graph Illustration -

Brown Tick Illustration -

Bright Red 10% Off Tag -

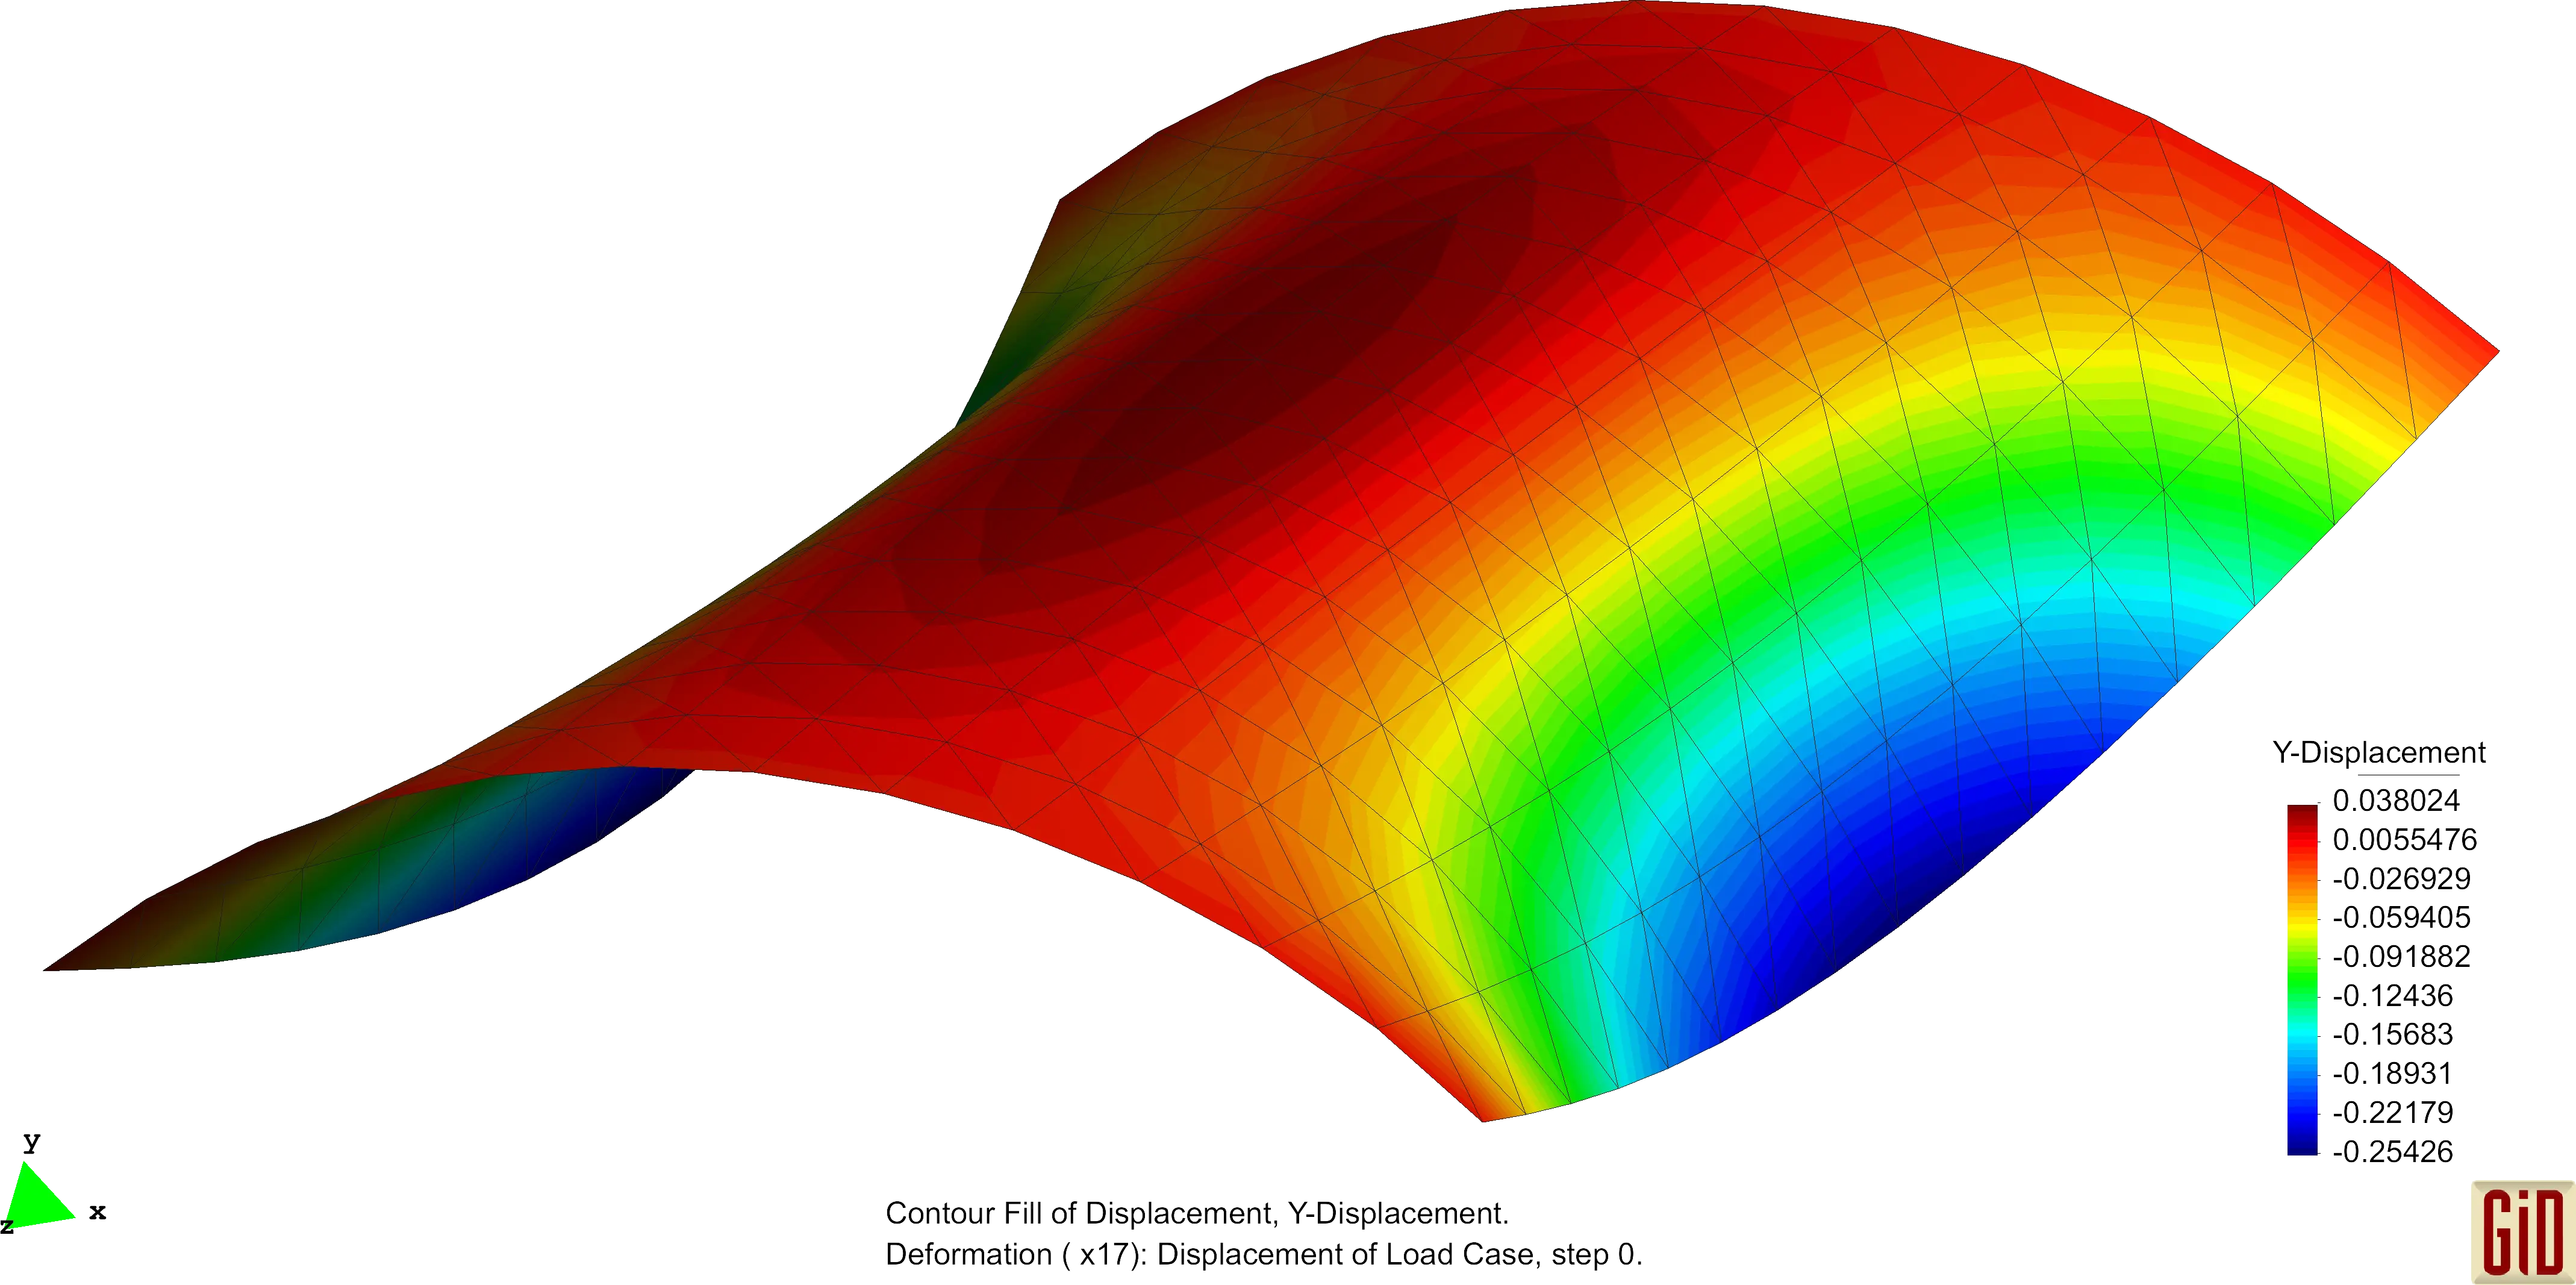
Mathematical Geometry and Graph Concepts -

Various Devices Displaying Software -

Sad Yellow Emoticon with a Ball Shape -

Yellow Smiley with Shoes -

Silver 3D Number Zero Symbol -

Complete Blue World Map -

Icon of KPI Dashboard with Graph and Person -

3D Apartment Layout Design -
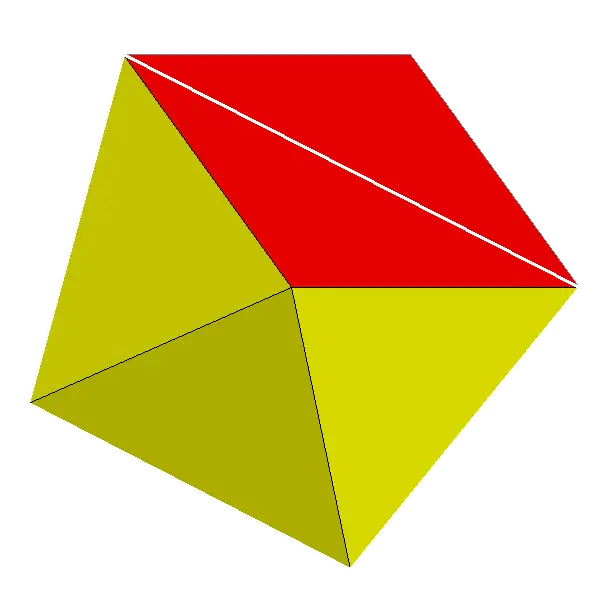
Red and Yellow Geometric Polygon Illustration -

Zigzag Down Arrow Icon for Decline Representation -

Magnifying Glass with Blue Lens -

Smiling Orange Star Cartoon Artwork -

Golden Letter A -

Yellow Ethernet Cable for Network Connections -

Bar Chart with Upward Arrow -

Graph Plot with Blue Curve Illustration -

3D Globe Illustration of Earth Model -
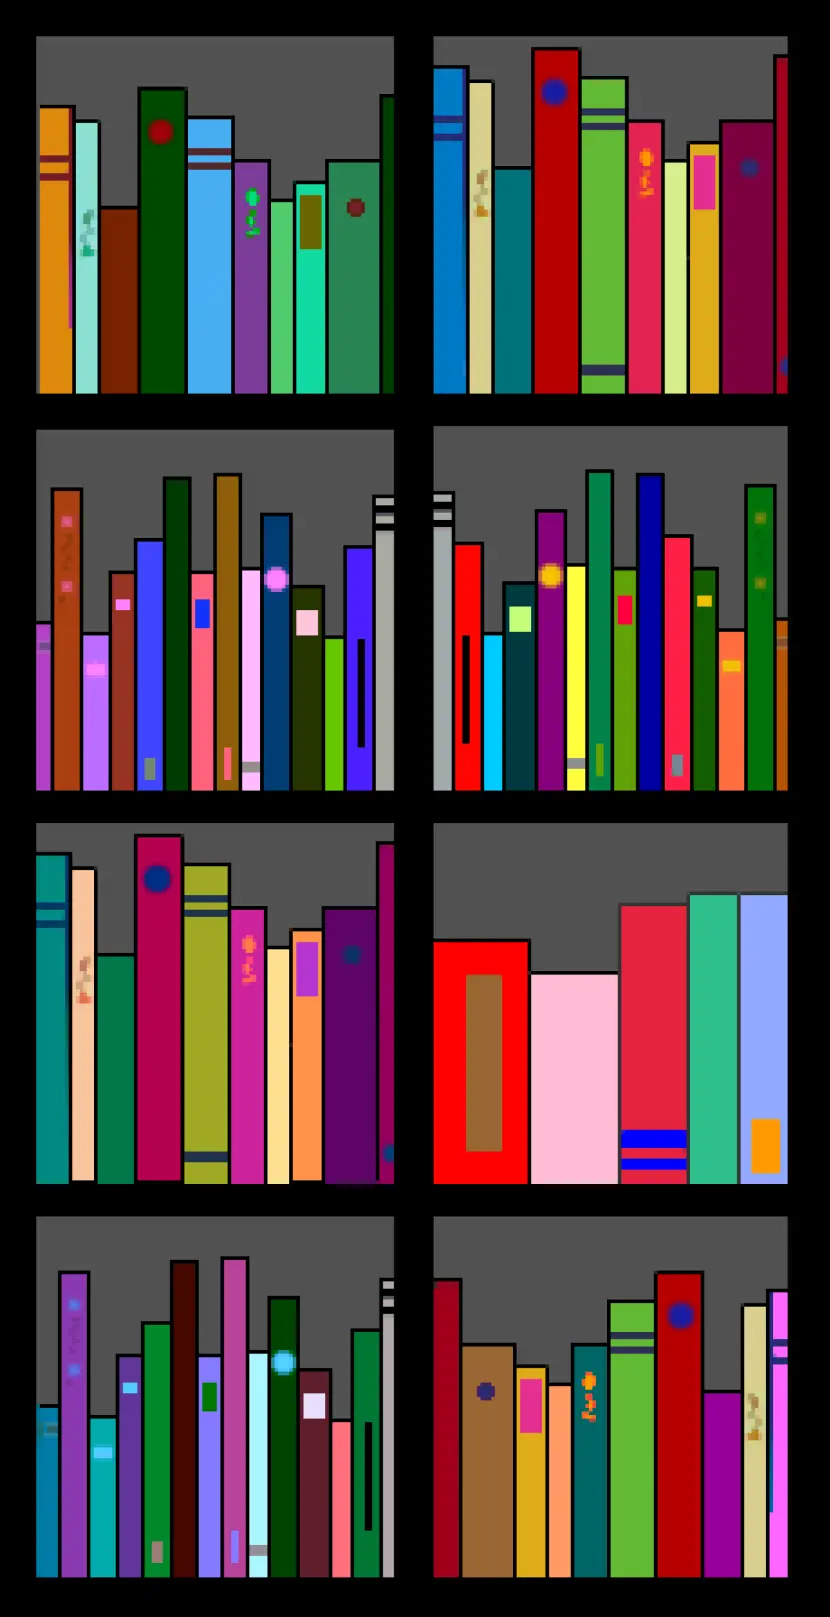
Colorful Bookshelf -
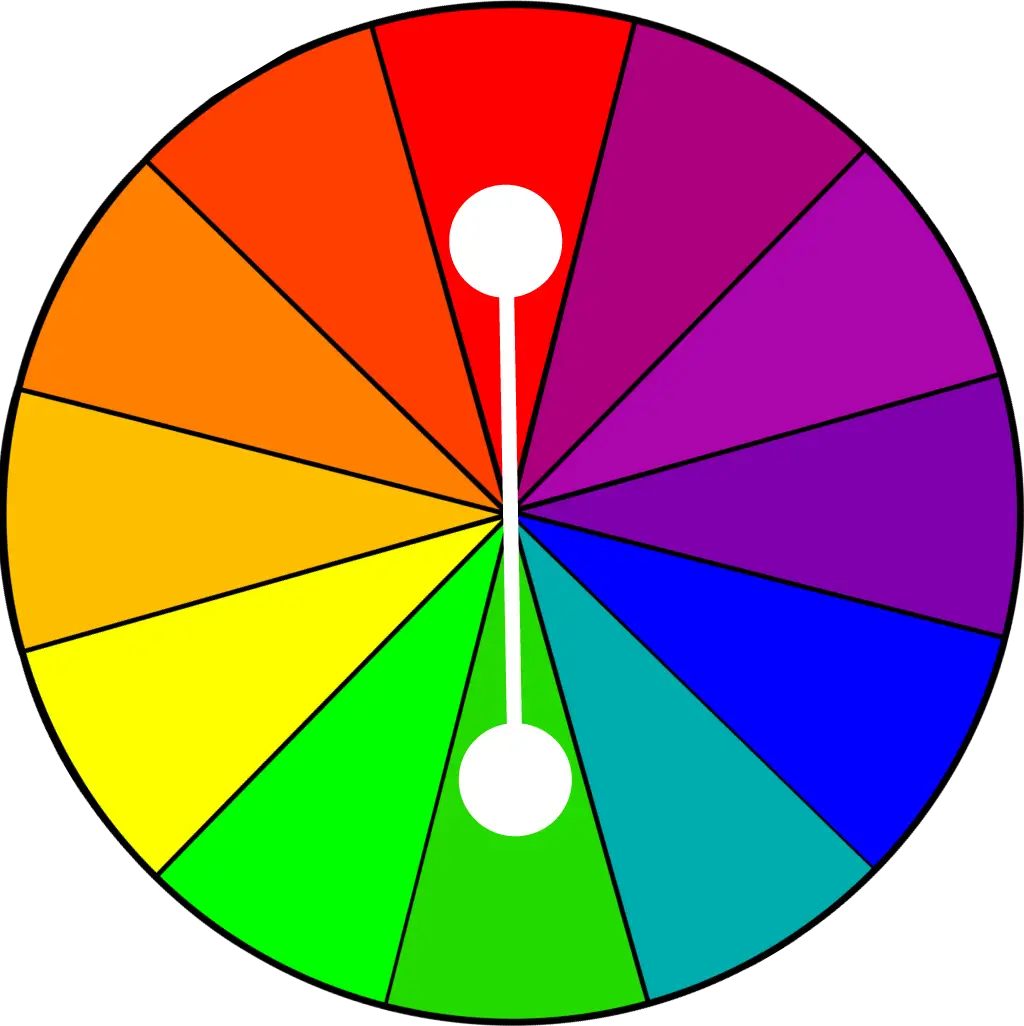
Color Wheel for Artistic Inspiration -

Search Growth Icon -

Illustration of Growth Chart with Upward Arrow -

Precision Hardness Tester for Materials -
Illustration of a Fish -

3D Coordinate System Illustration -

Orange Centipede Illustration