You Might Like
-
White Cloud Blur Graphic Element -

Purple Crescent Moon on Clear Background -

Team with Growth Graph Illustration -

Business Strategy Icons -

Organizational Structure Chart -

Colorful Geometric Sphere -

Various Devices Displaying Software -

Instagram round gradient logo -

Icon of KPI Dashboard with Graph and Person -

Zigzag Down Arrow Icon for Decline Representation -

Presentation Board with Graph for Business Concepts -

Black Feather with Smooth Texture -
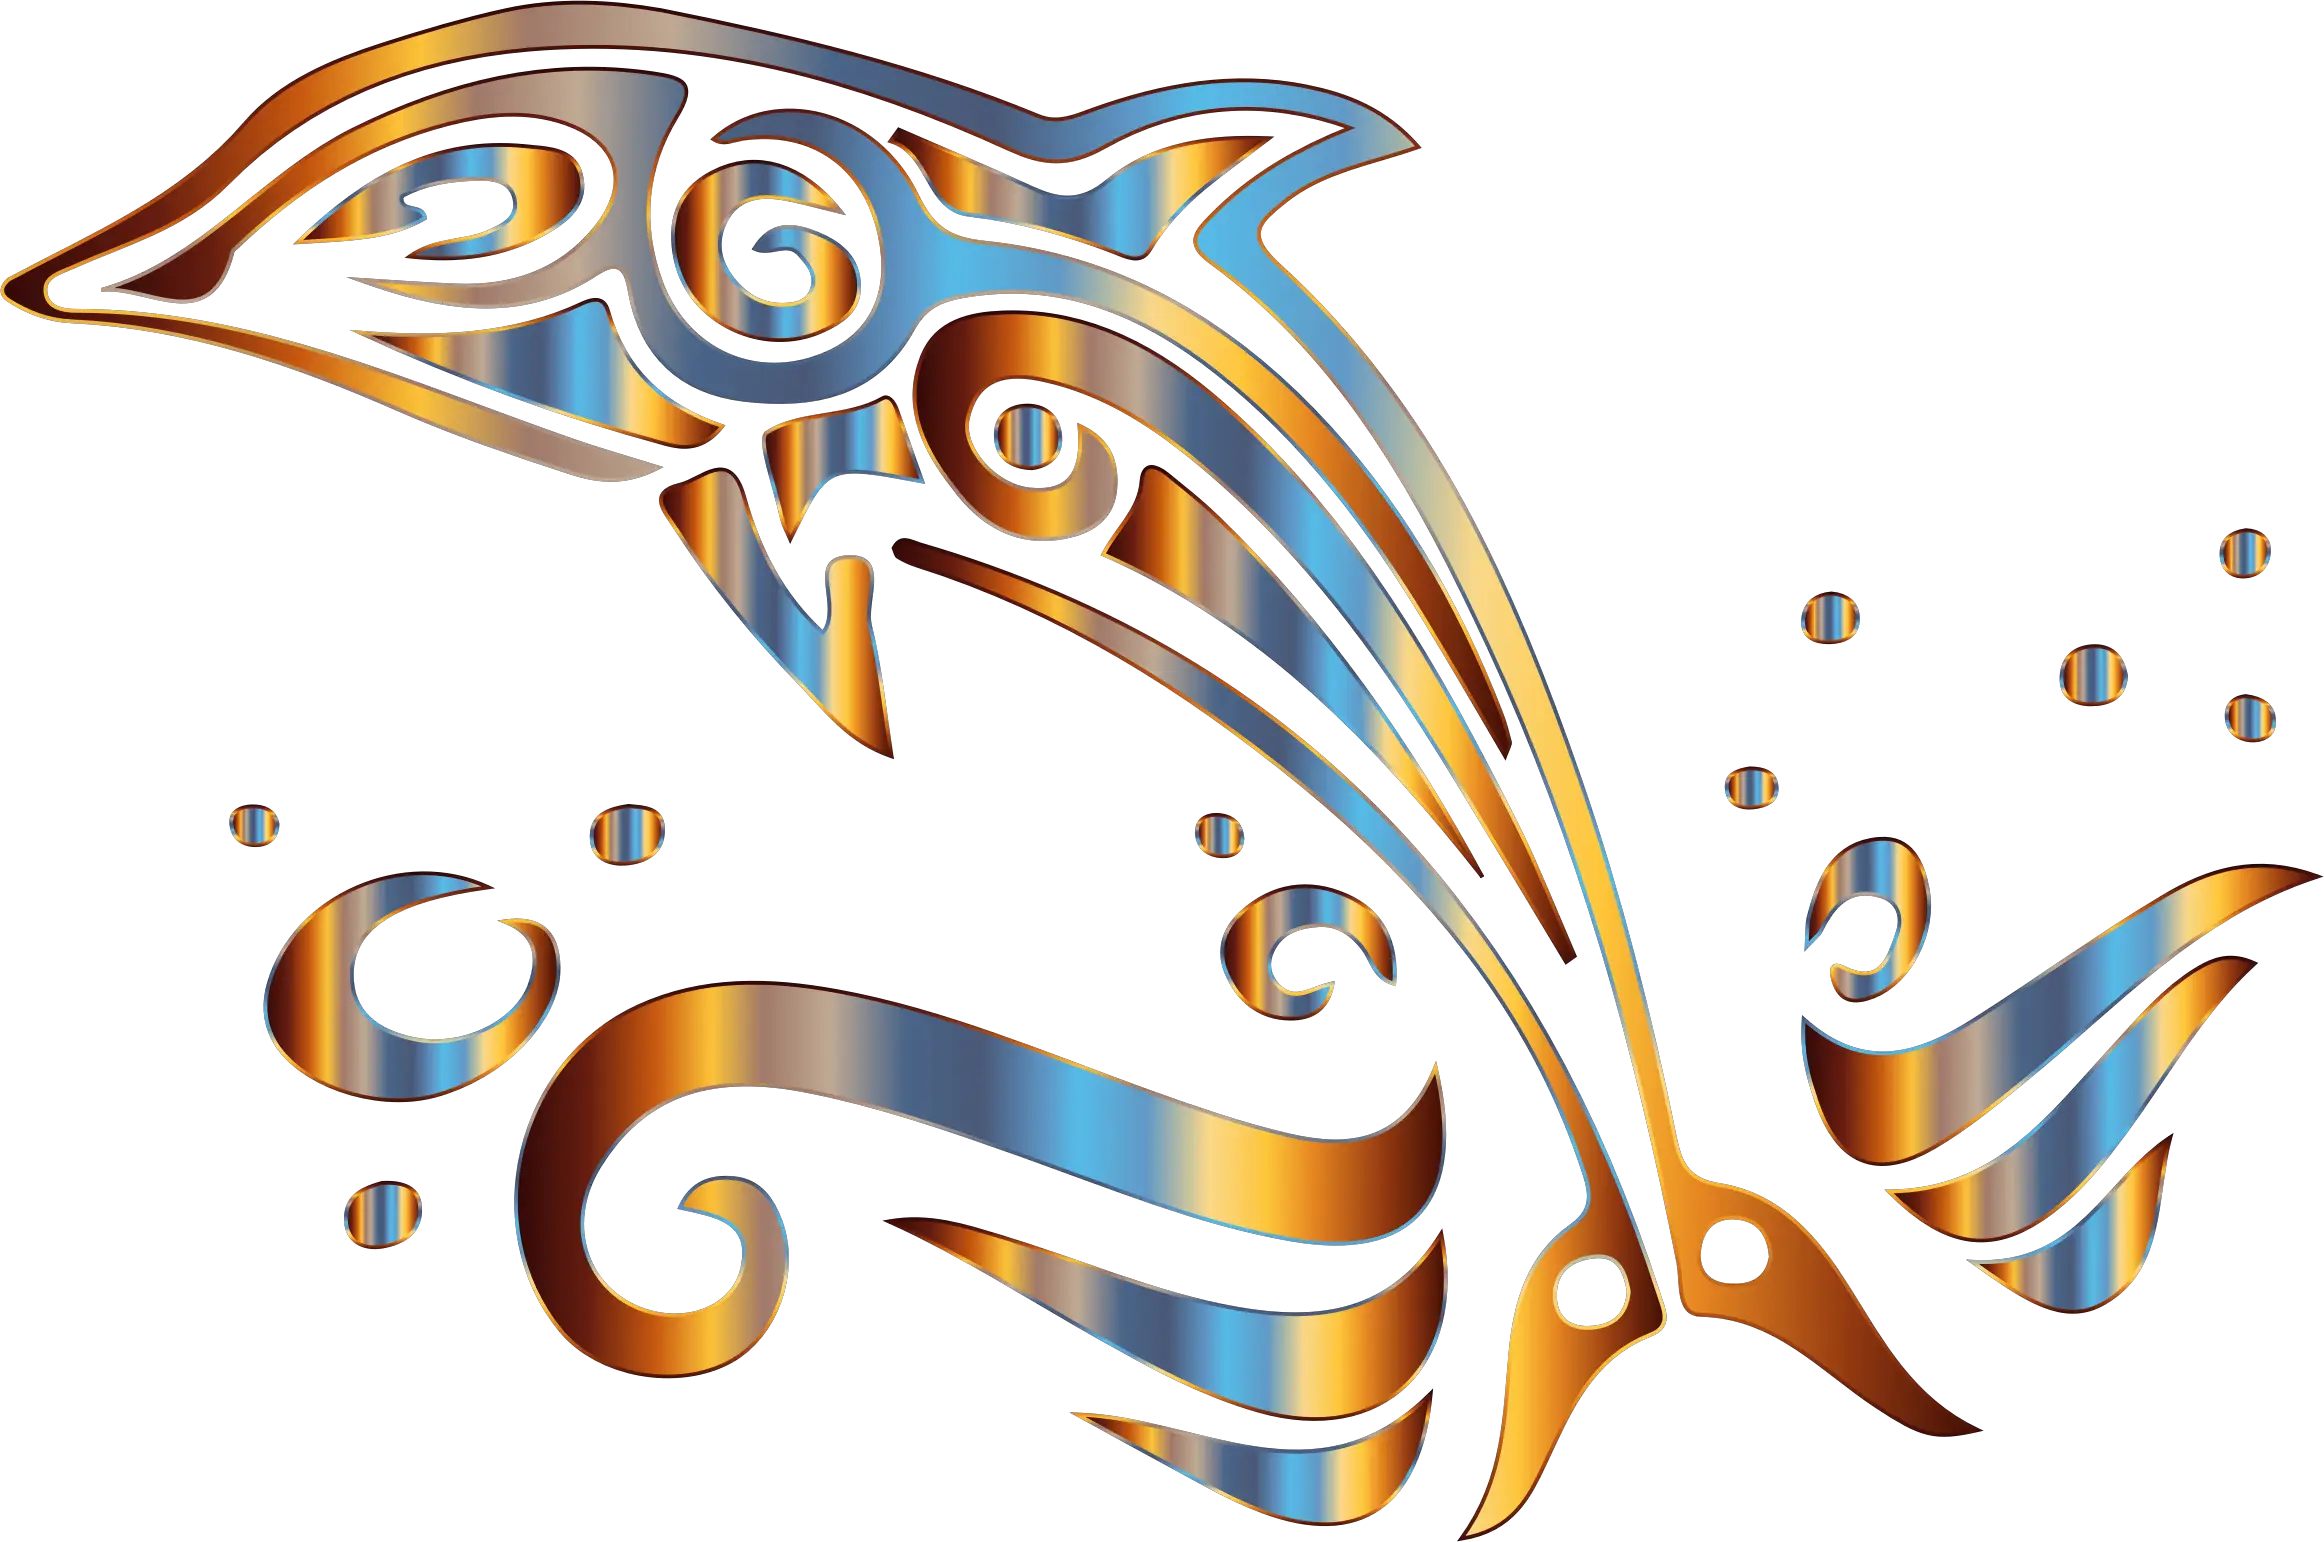
Stylized Decorative Dolphin Illustration -

Bar Chart with Upward Arrow -

Infographic Pencil with Data Elements -

Search Growth Icon -

Illustration of Growth Chart with Upward Arrow -
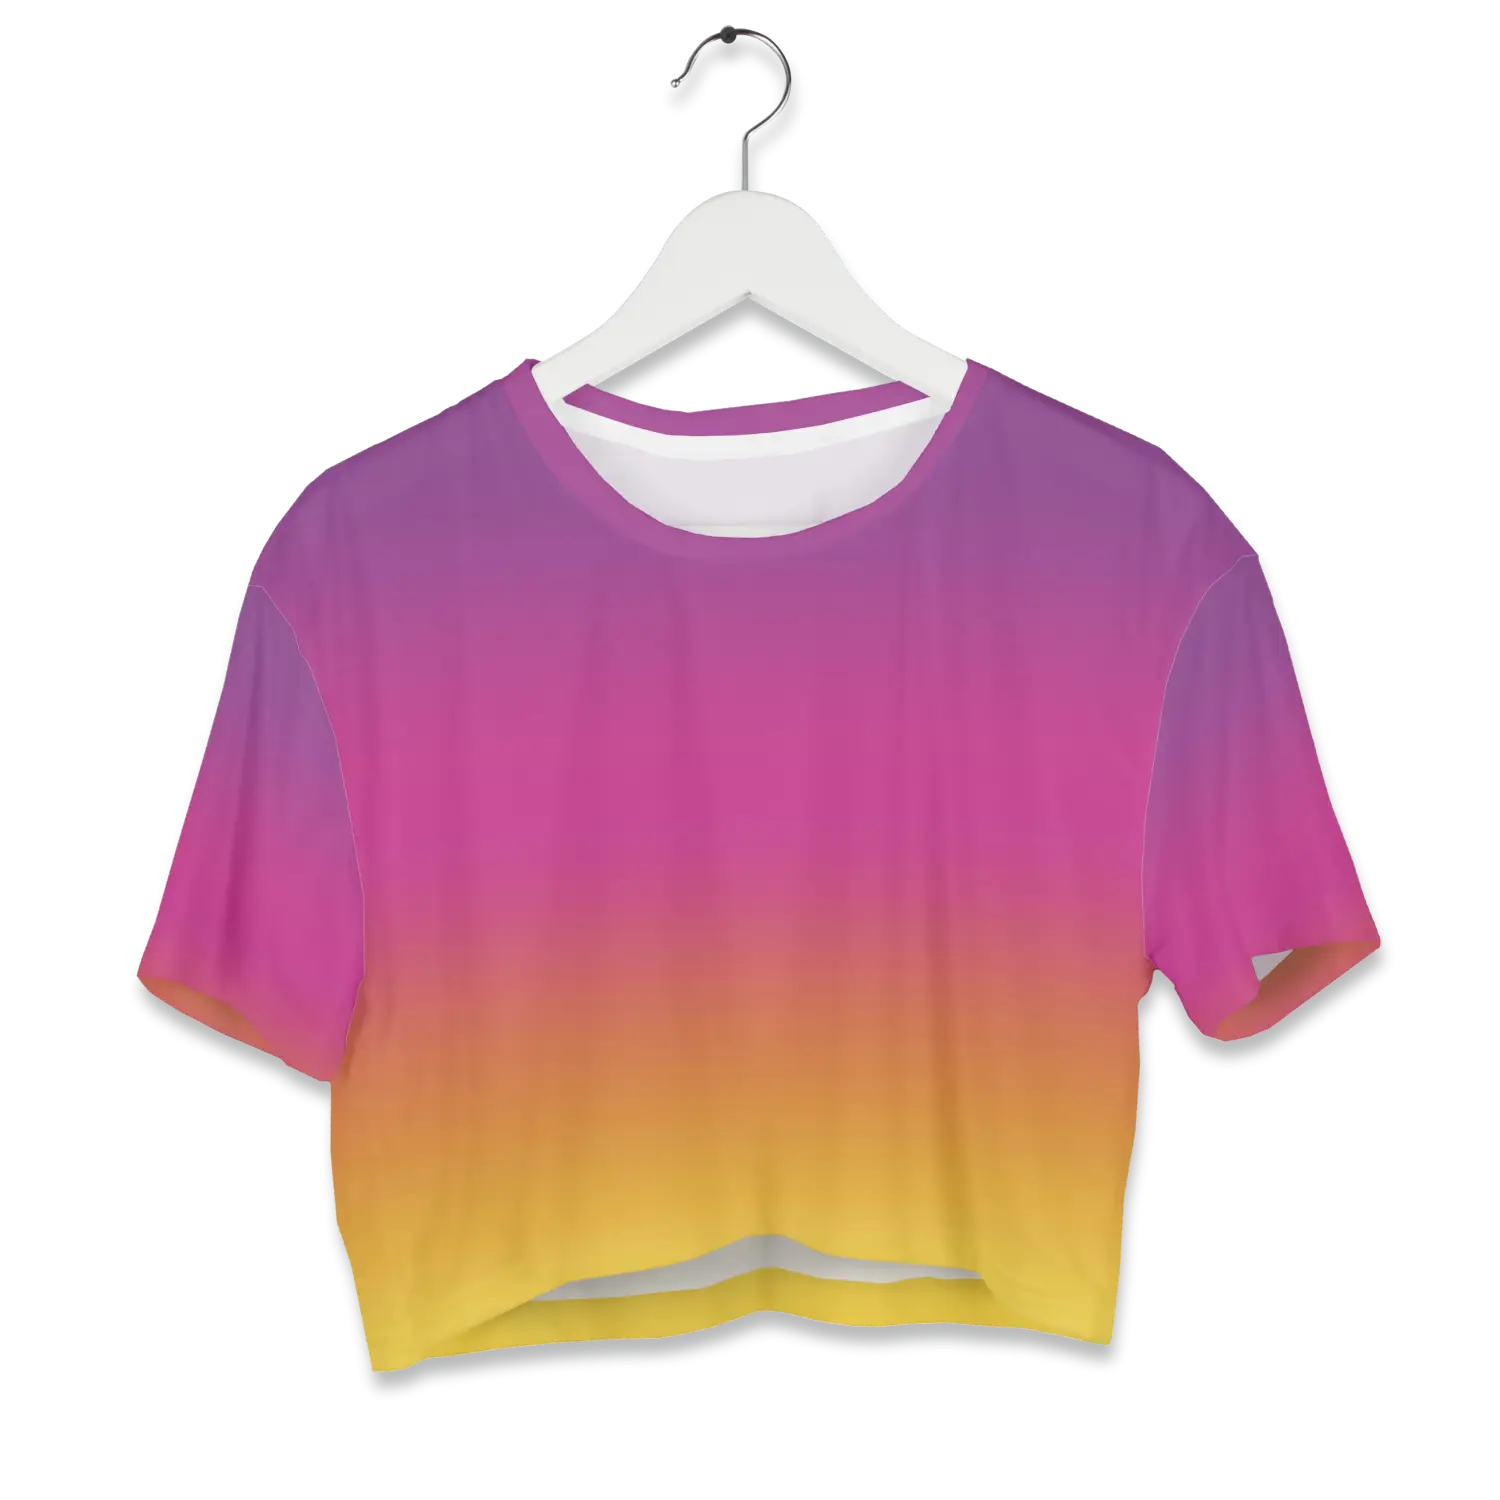
Gradient T-Shirt in Pink and Yellow -
Abstract Colorful Planet Art -

SEO Concept with Magnifying Glass and Computer -

Orange Curved Abstract Design -
Colorful Sparkling Circle Design -

Gradient Transparent Background -

Rainbow Gradient Heart Illustration -

Blue Declining Bar Graph with Arrow -

Business Icons Set for Digital Workflows -

Circle Pie Chart Icon -
Colorful decorative bows -

Abstract Blurred White Text Design -

Yellow Flame Fire Illustration