You Might Like
-
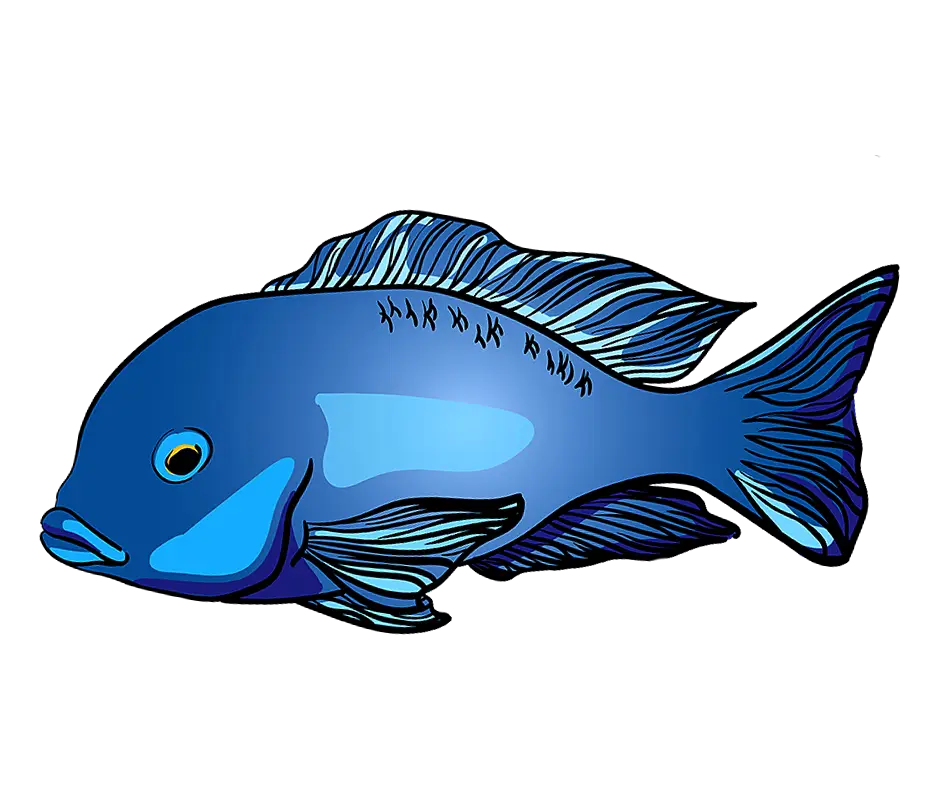
Blue Fish Graphic Illustration -

Colored Regional Map of Africa -
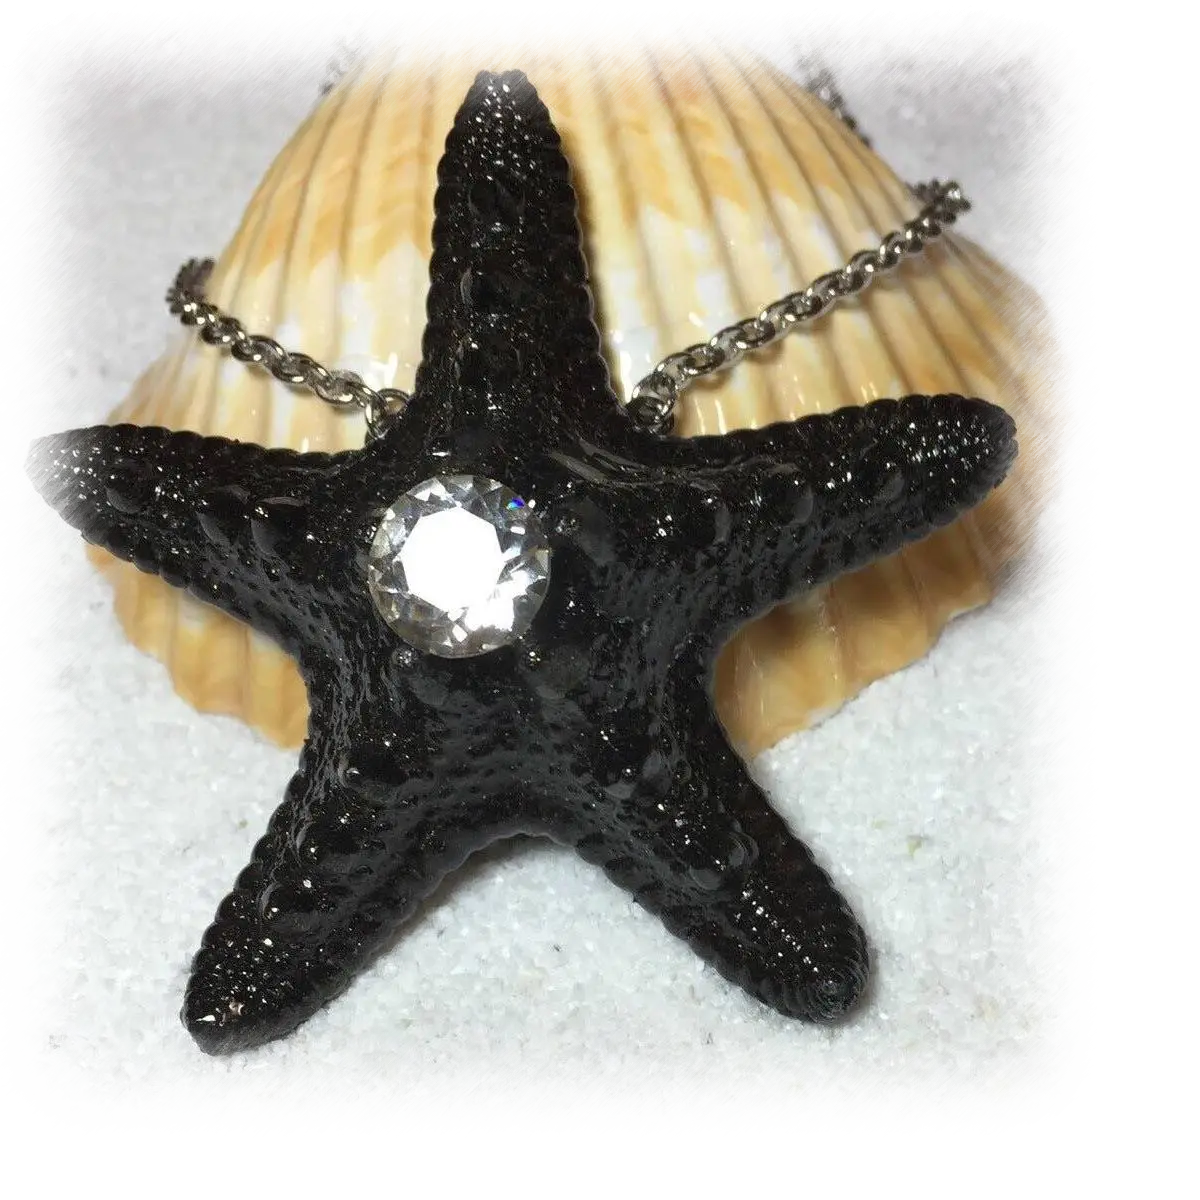
Black Starfish Necklace with Gem -

Black Wave Symbol -
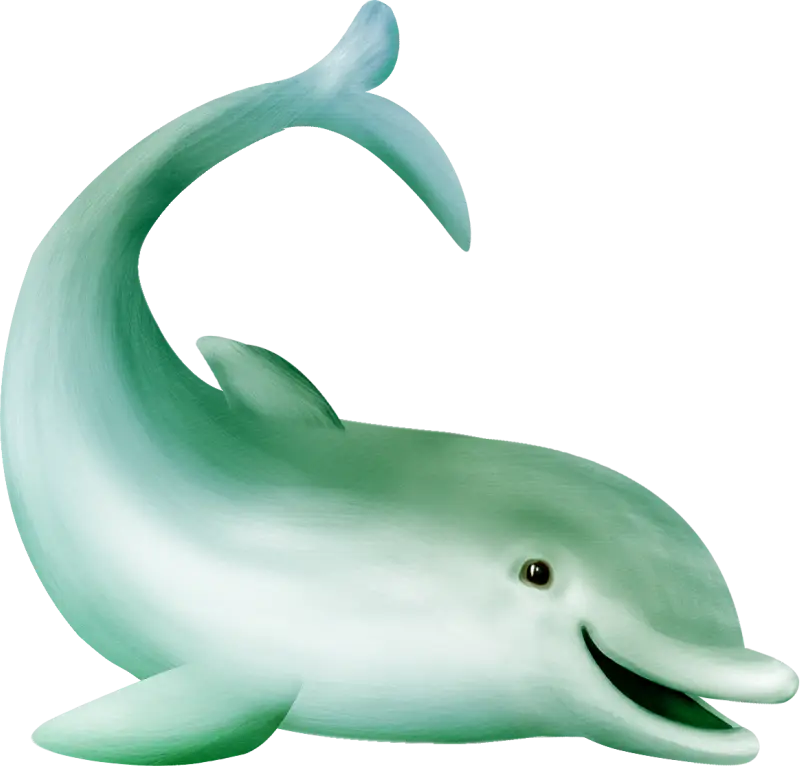
Cute Cartoon Dolphin Illustration -

Minimalistic Sea and Sky Logo -

Surfer Silhouette -
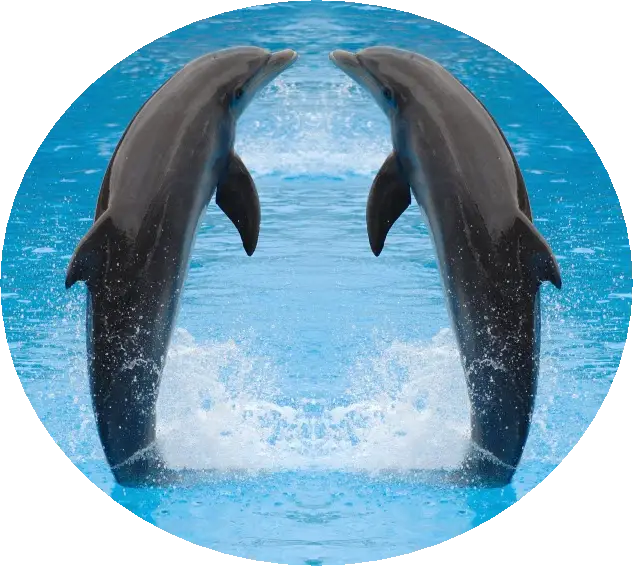
Playful Dolphins Jumping in Water -
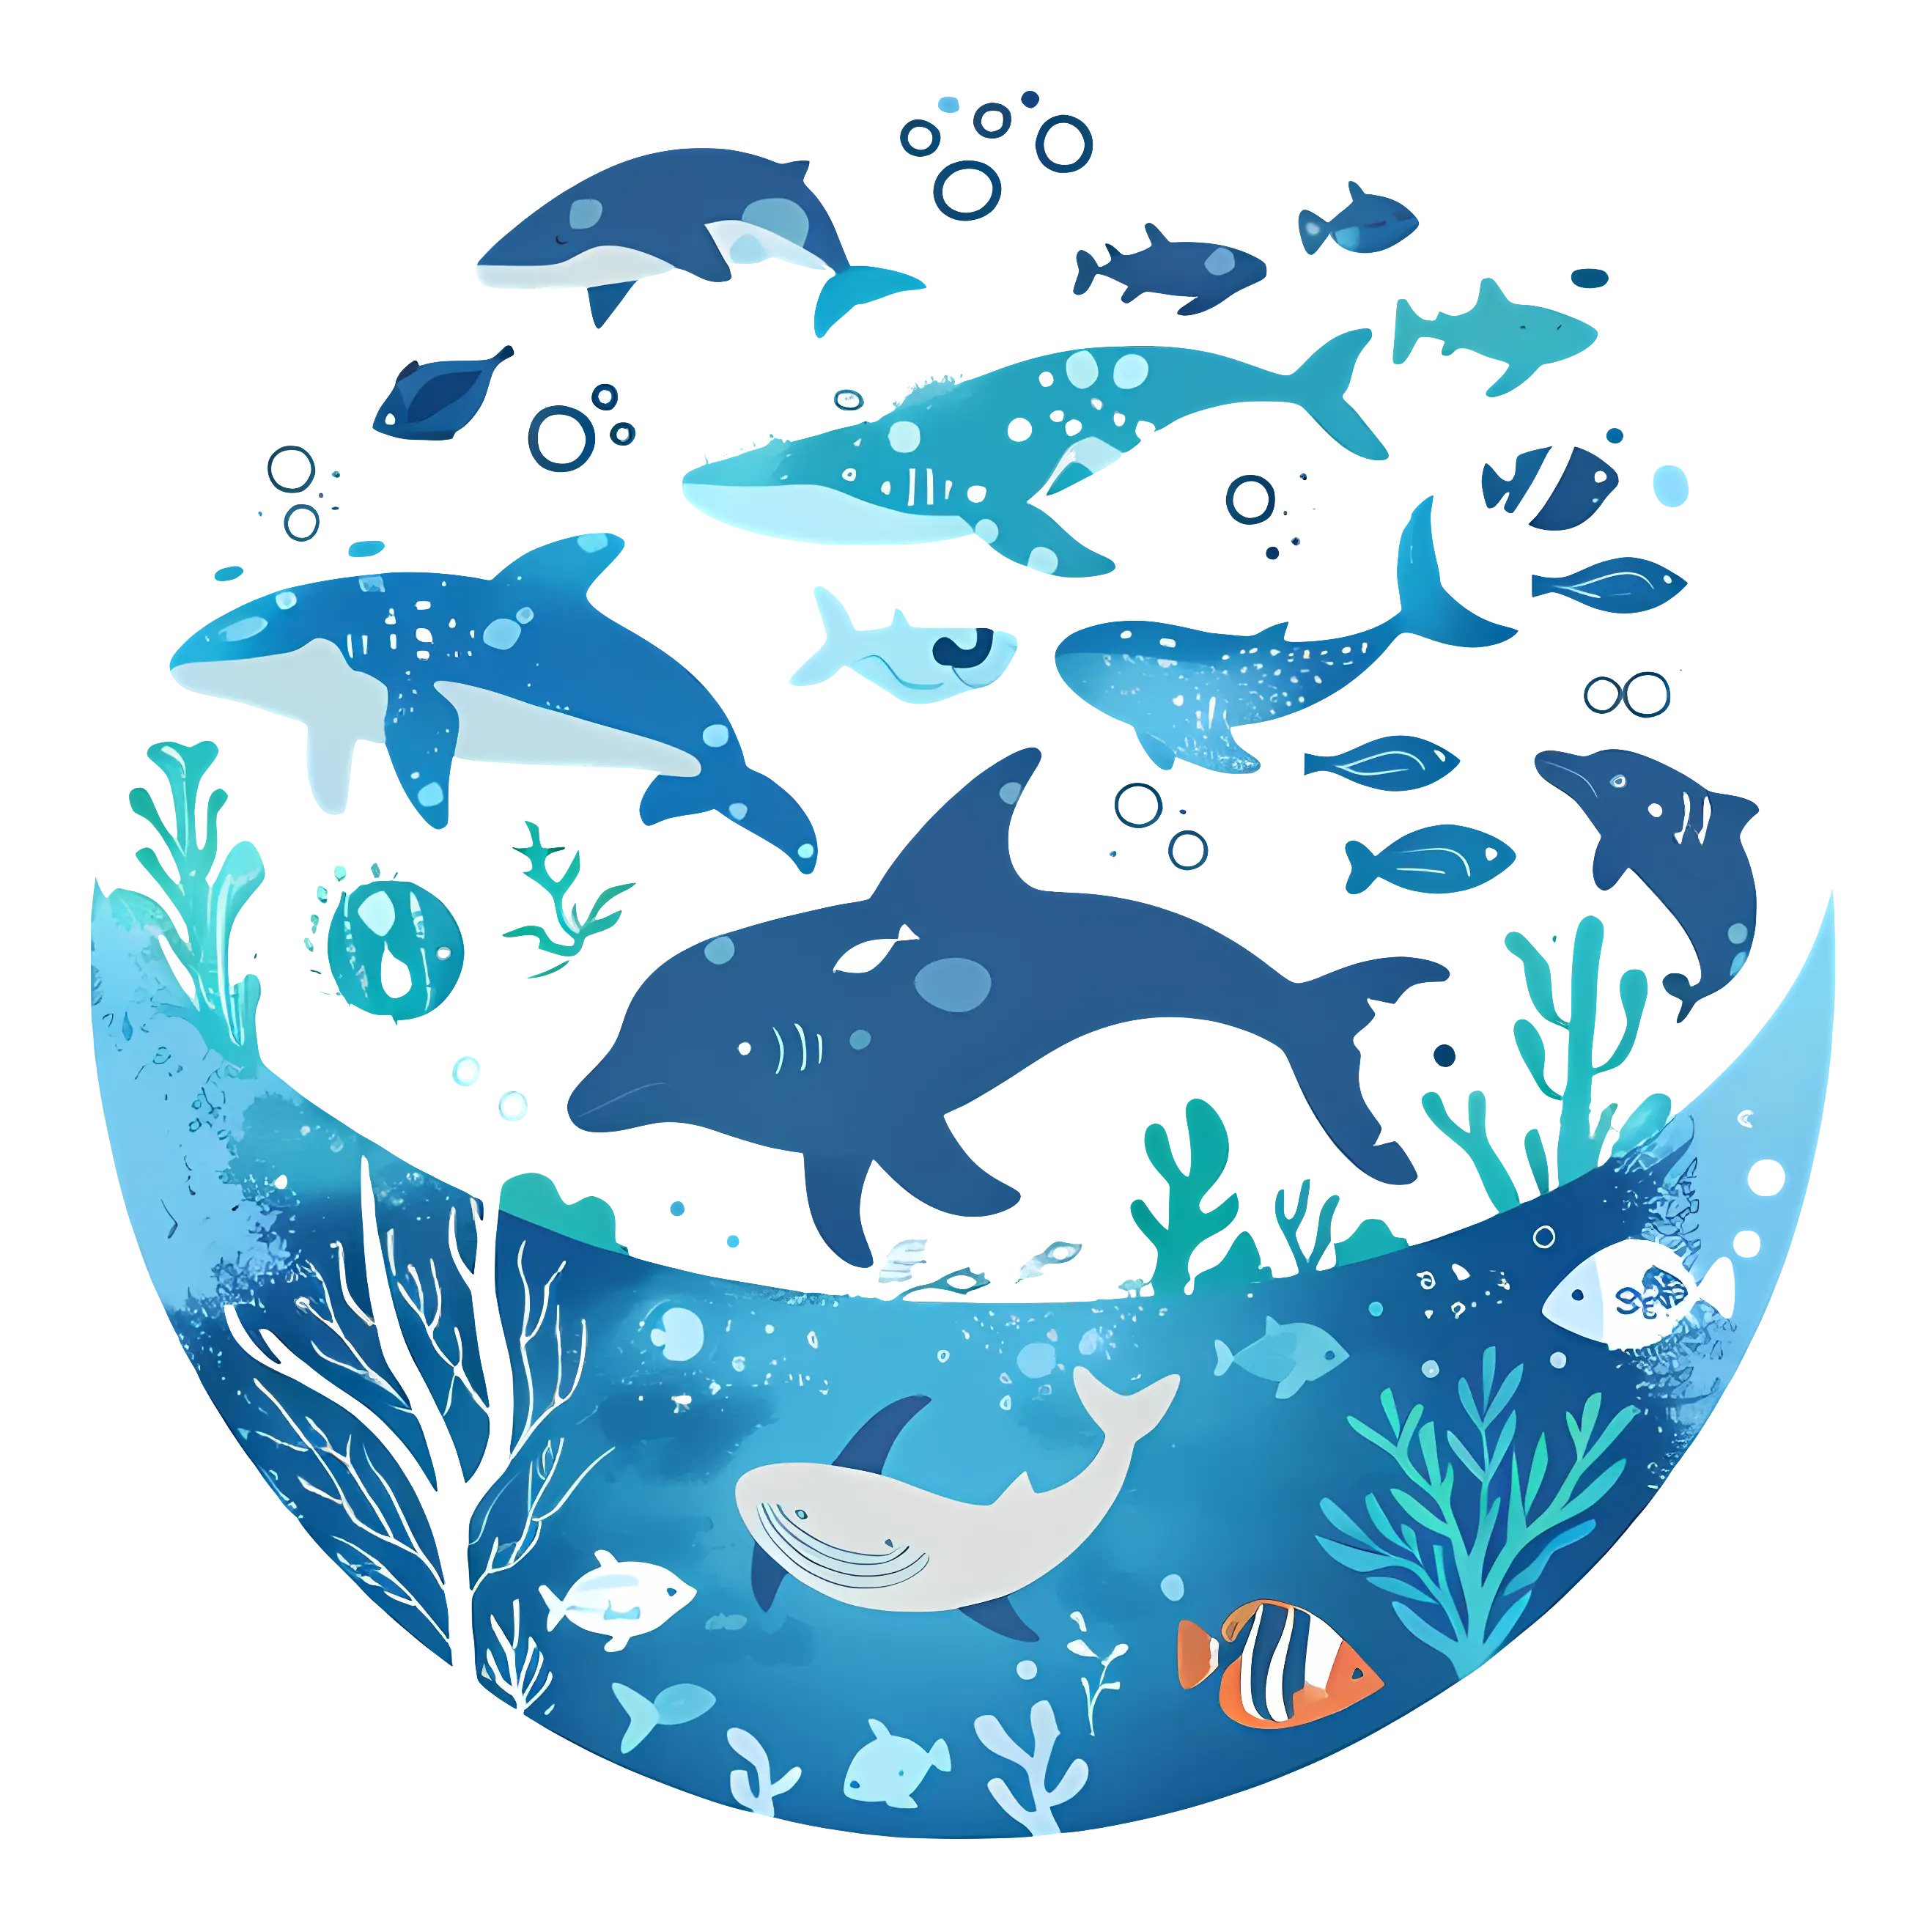
Vivid Marine Life in Underwater Illustration -

Man Paddleboarding Cartoon Illustration -

Black Compass Rose for Navigation and Mapping -

Various Devices Displaying Software -

Green Globe Icon Representing Sustainability -

Smart Home Control System with Temperature Display -

Complete Blue World Map -

Icon of KPI Dashboard with Graph and Person -
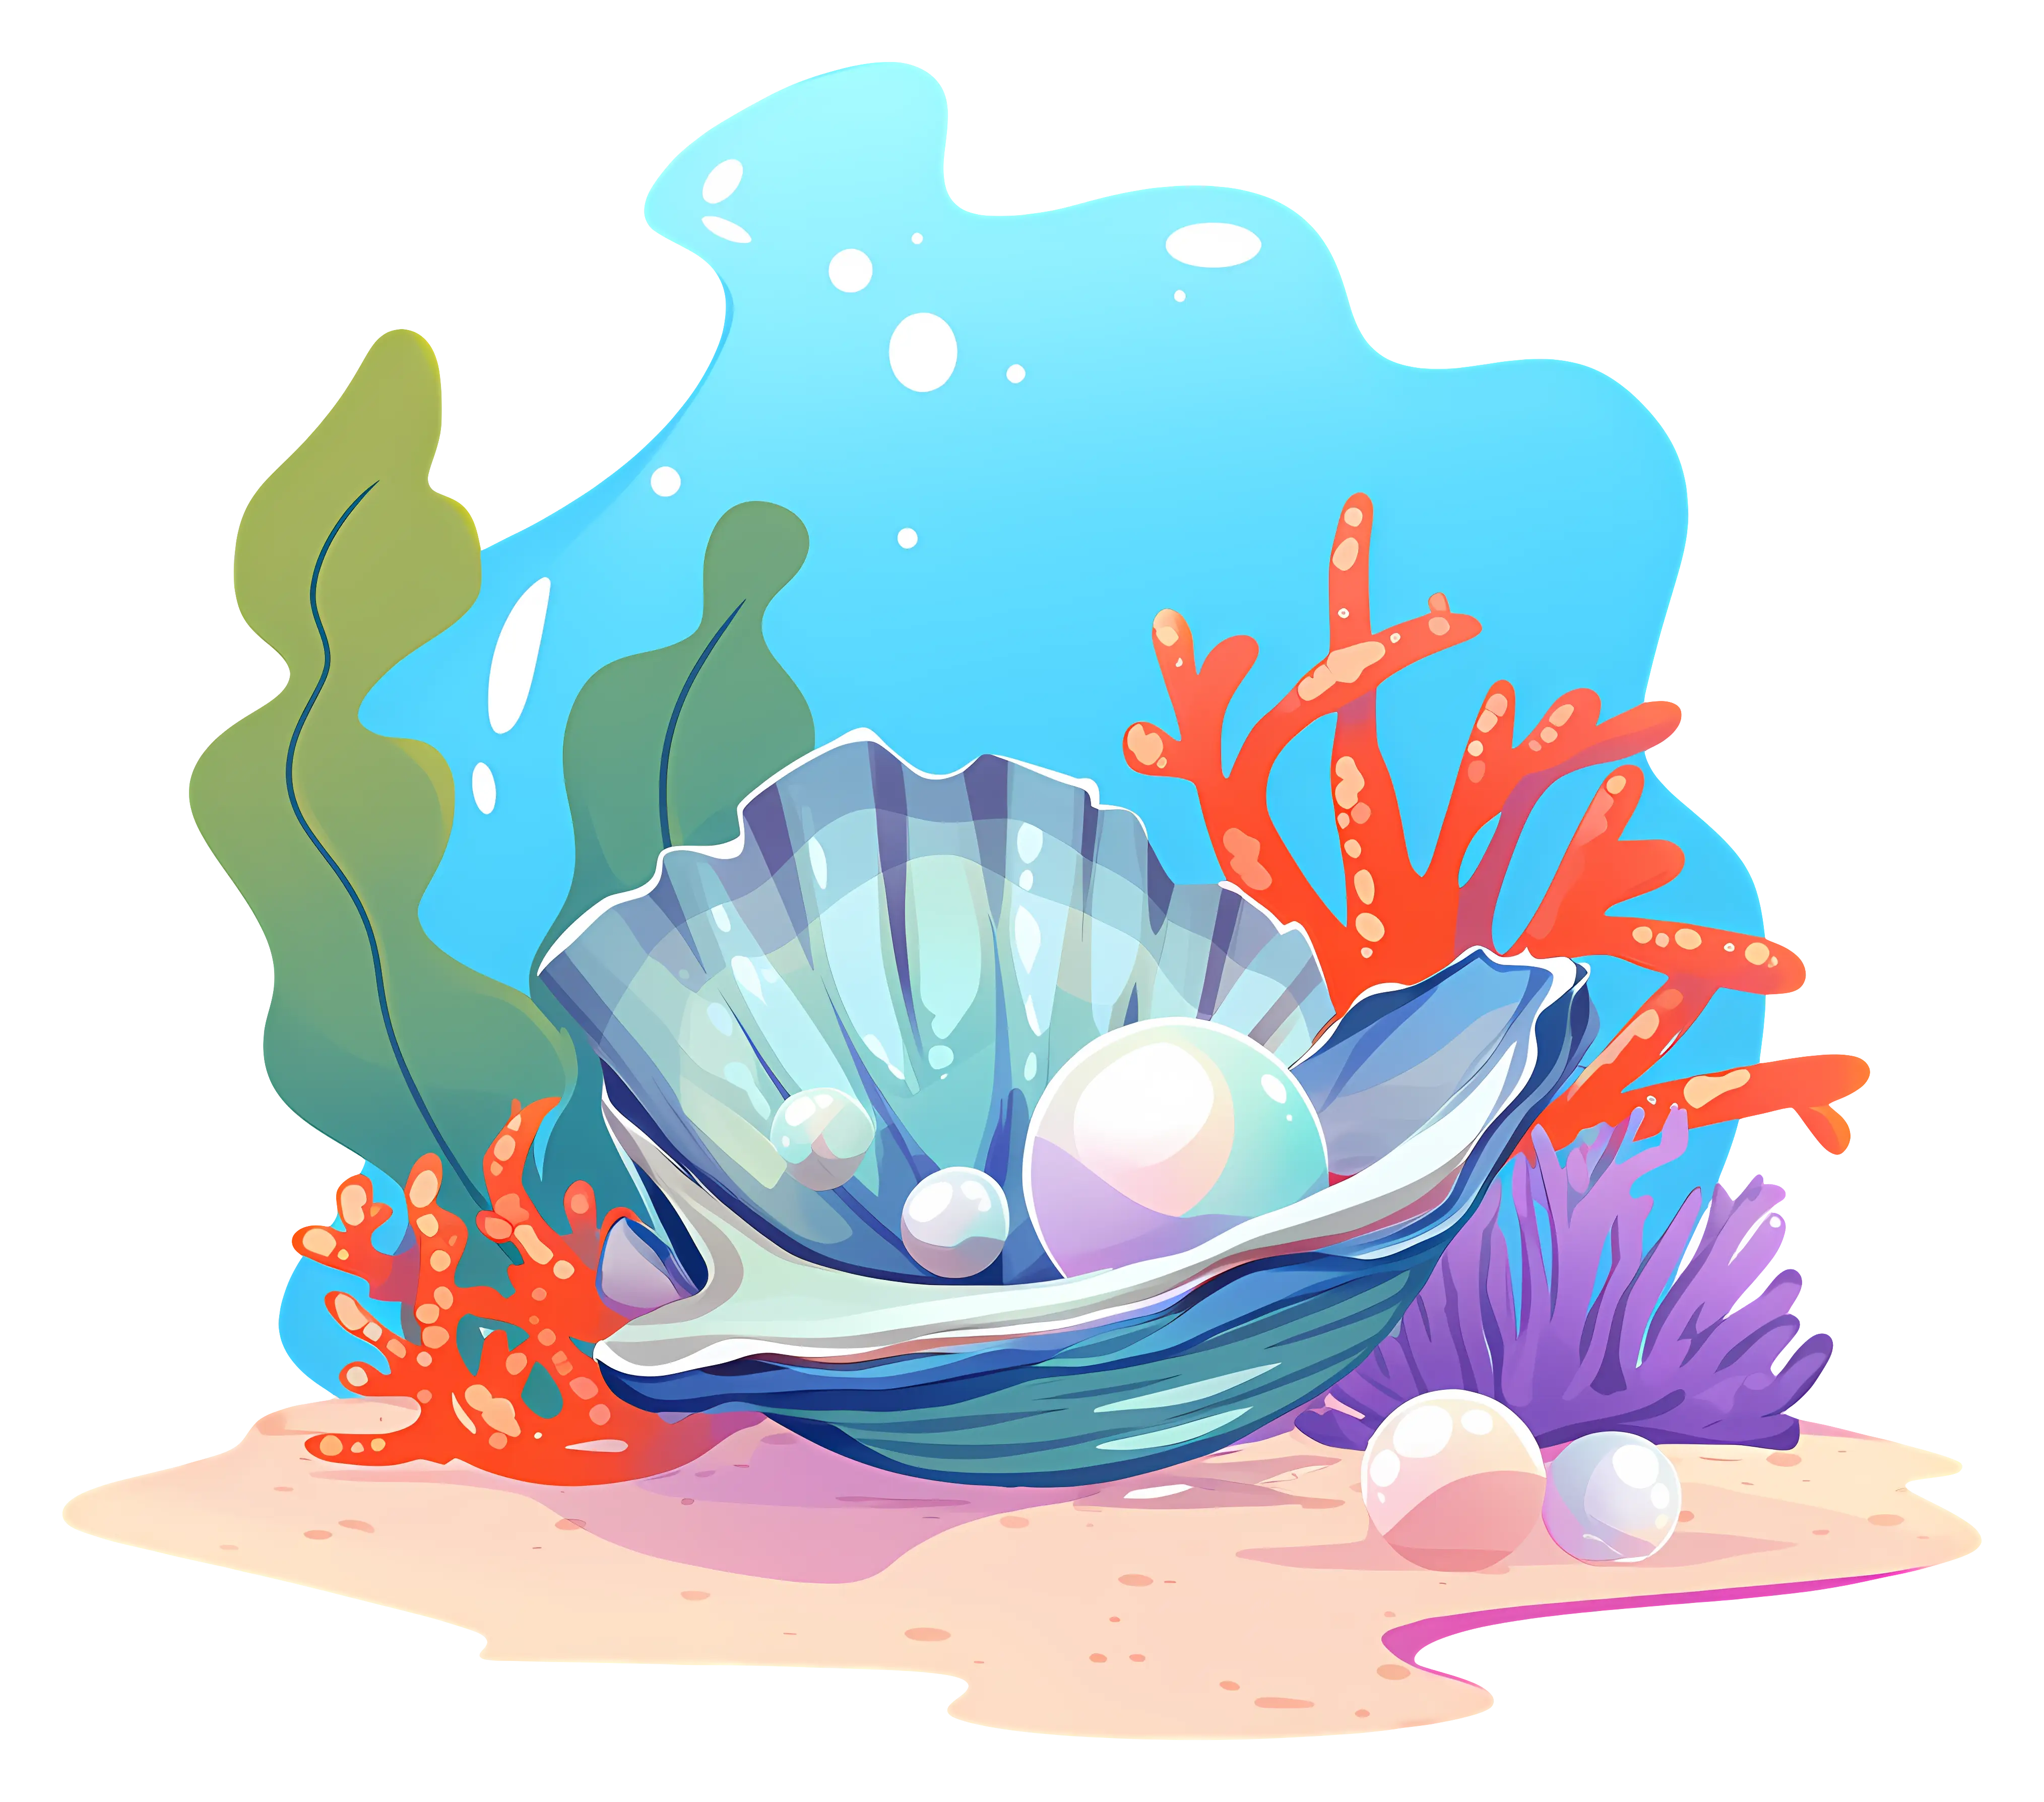
Underwater Pearl in Seashell Illustration -
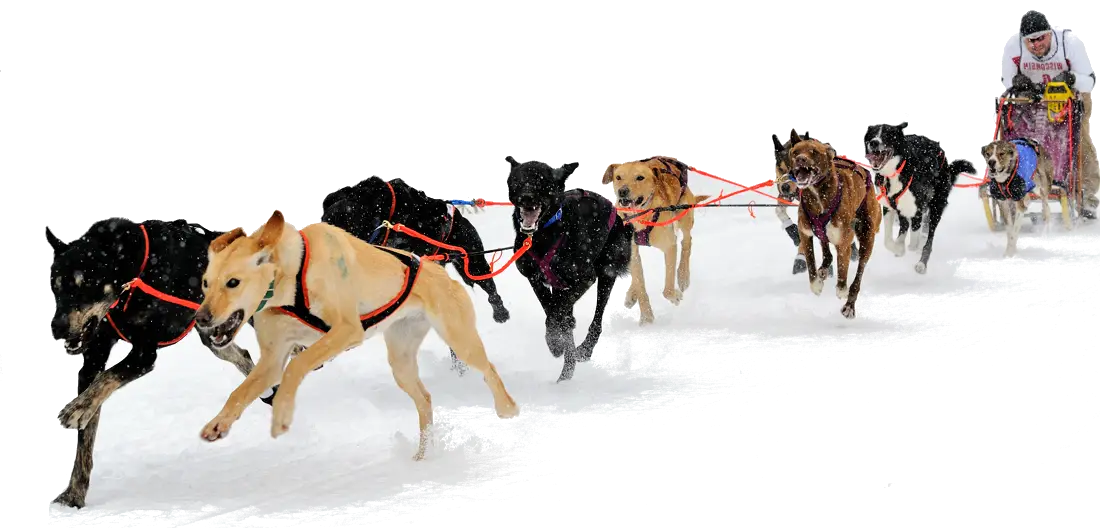
Dog Sledding in Snow -

Polar Bear Face Illustration -

Bar Chart with Upward Arrow -
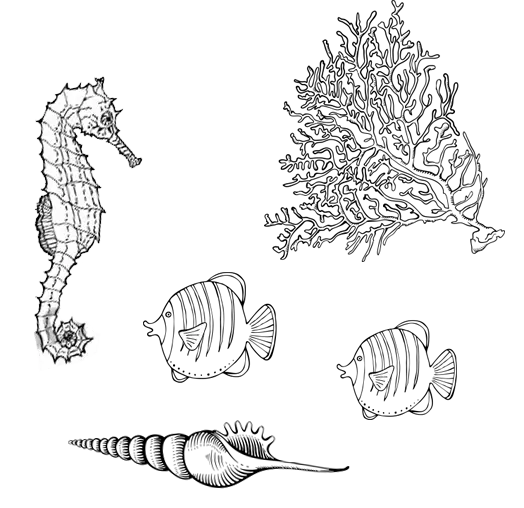
Illustration of Sea Creatures -
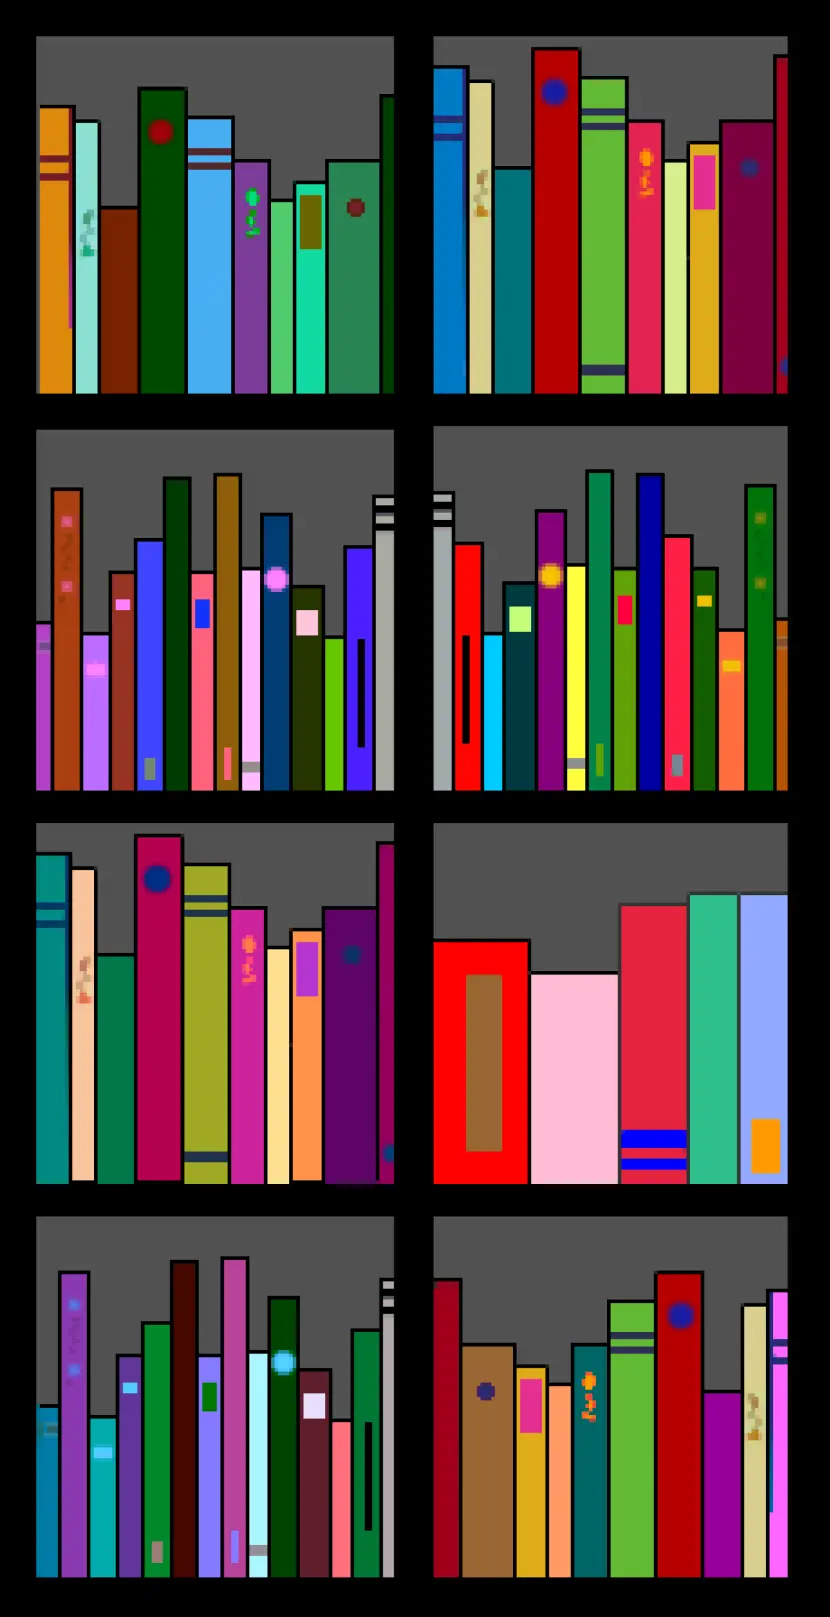
Colorful Bookshelf -
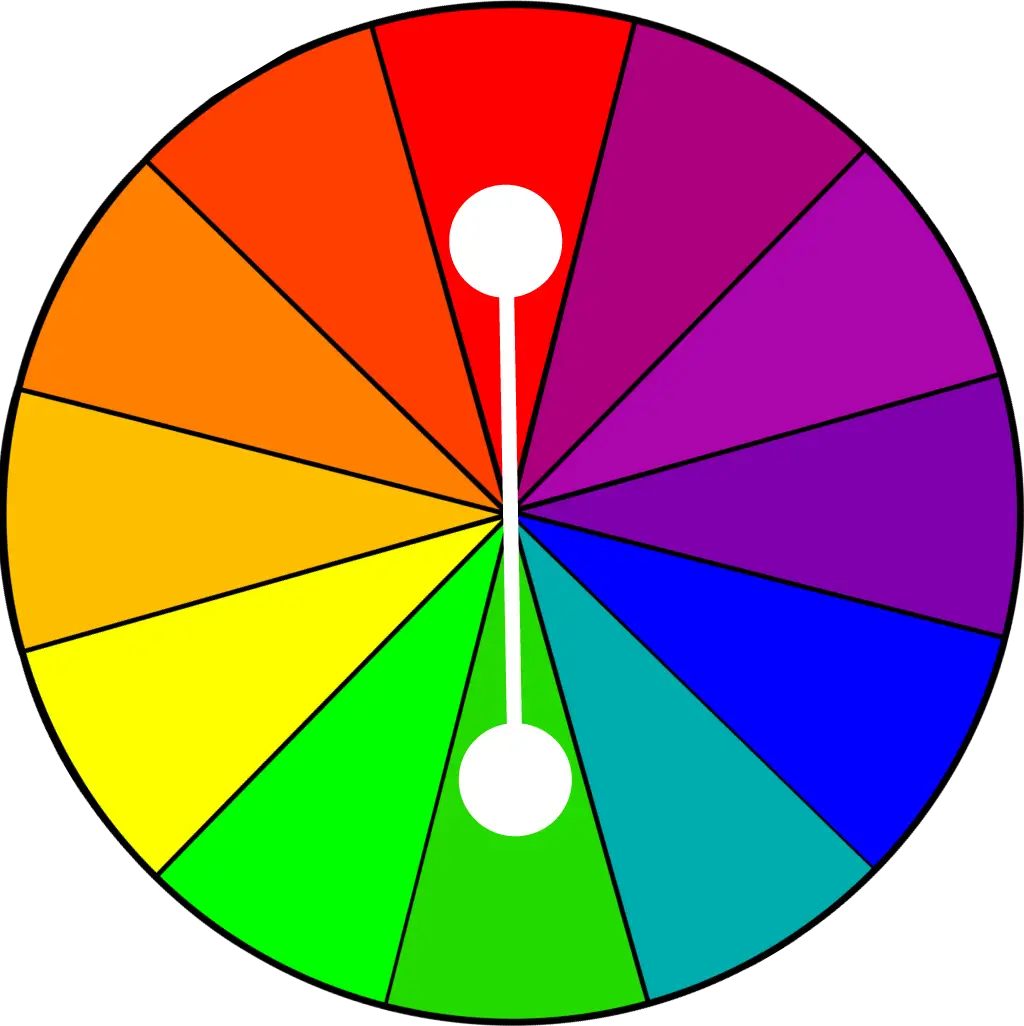
Color Wheel for Artistic Inspiration -

Cute Cartoon Penguin in Winter Attire -

Search Growth Icon -
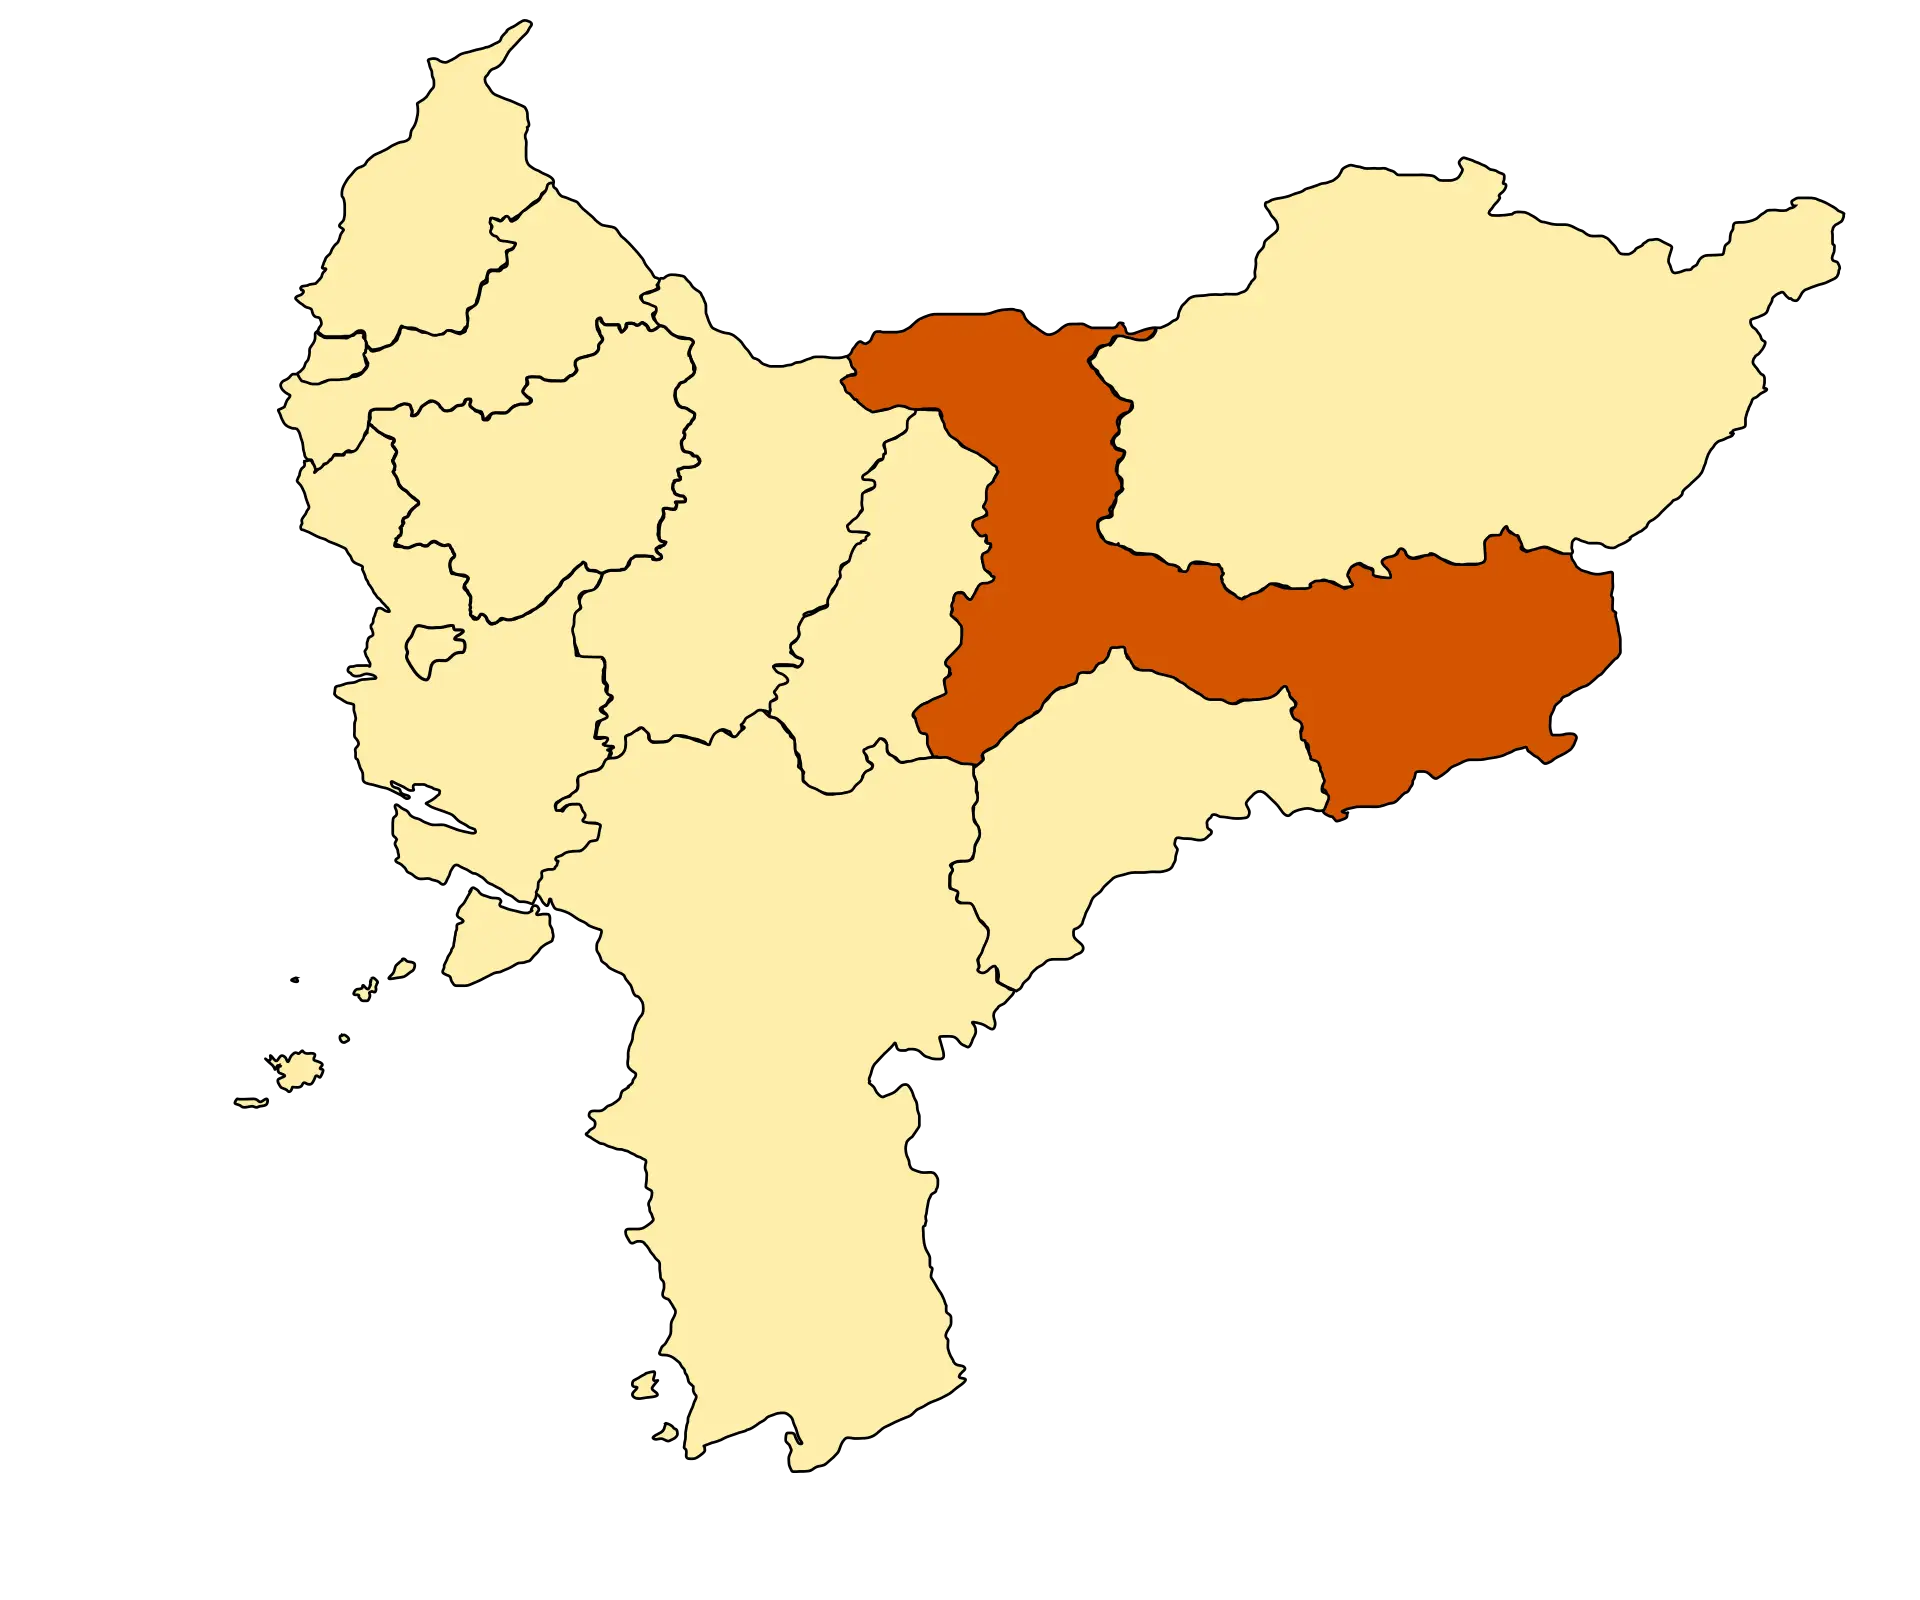
Map Highlighting Specific Regions -

Illustration of Growth Chart with Upward Arrow -

Thermometer Symbol Icon -
Transparent Jellyfish Illustration -
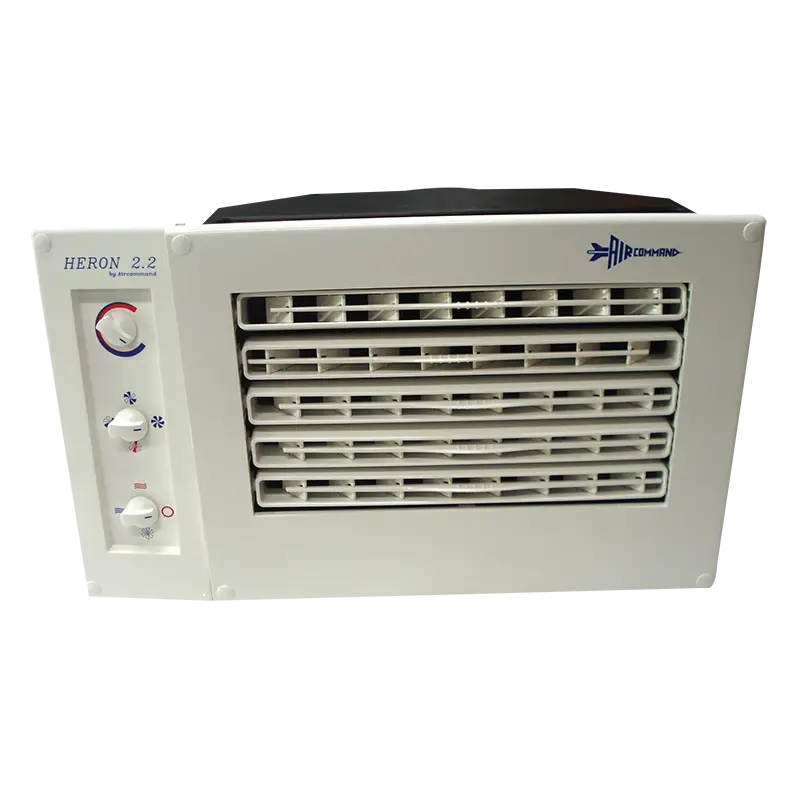
Electric Room Heater