
You Might Like
-
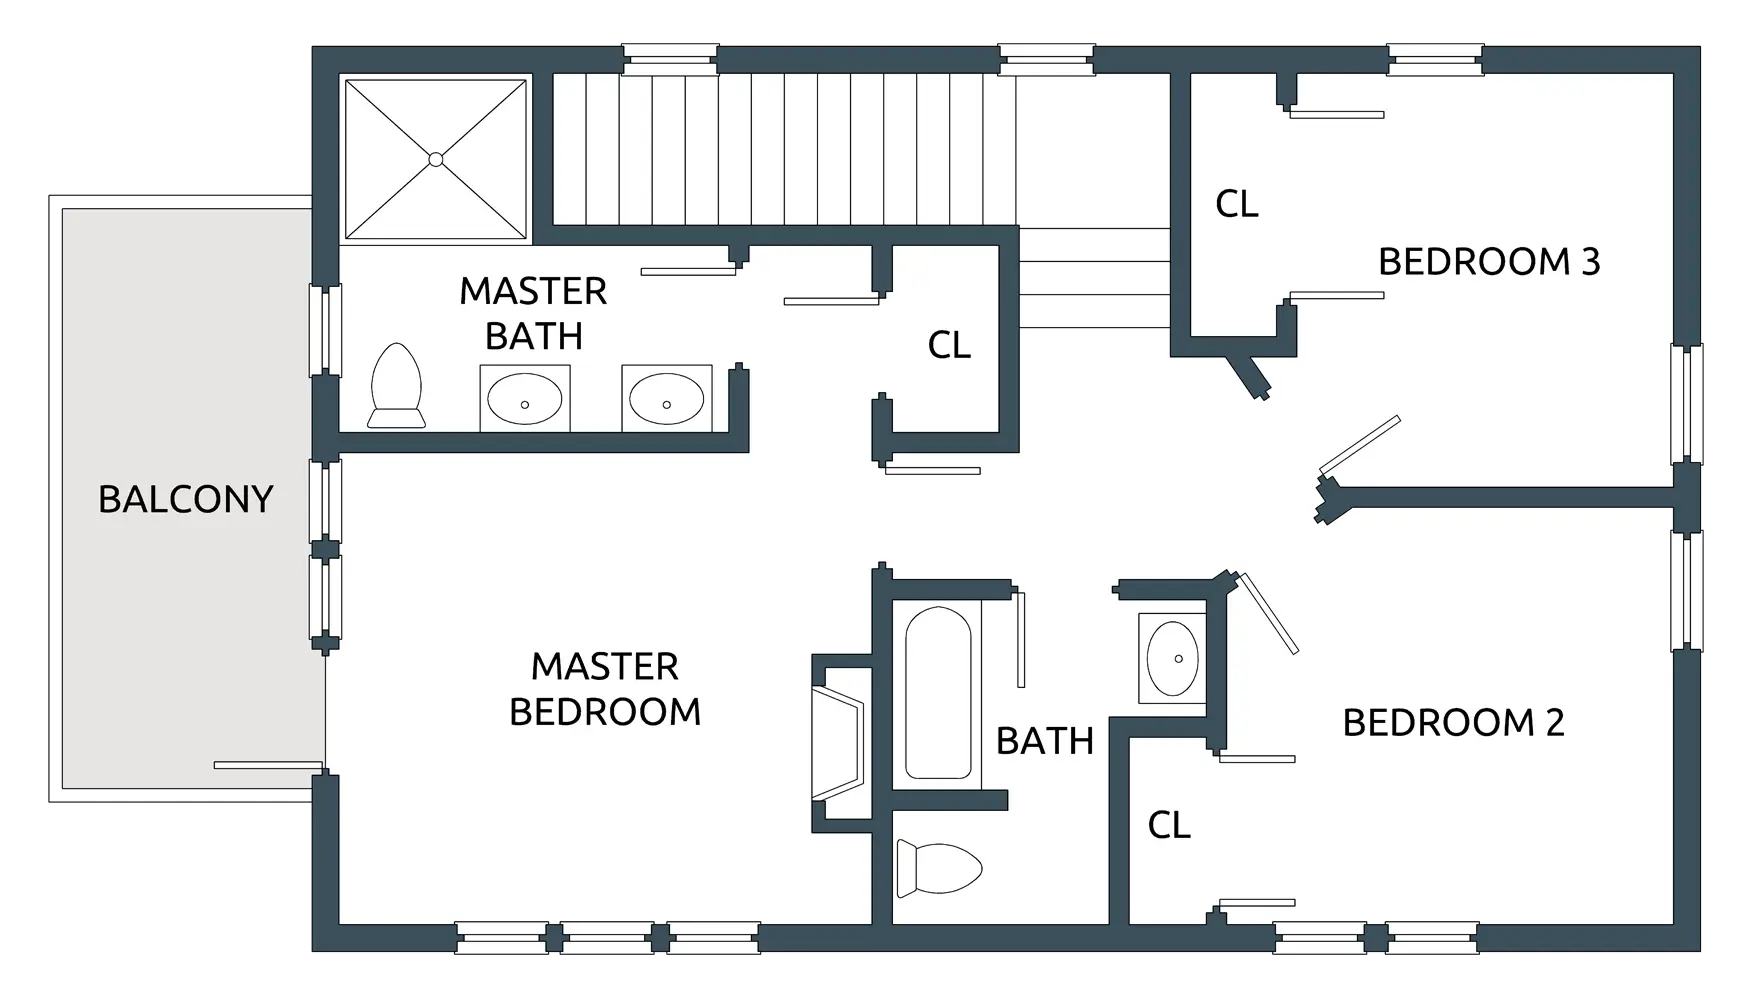
House Floor Plan with Three Bedrooms -

Blue Globe Network Icon -

Satellite Dish Icon -
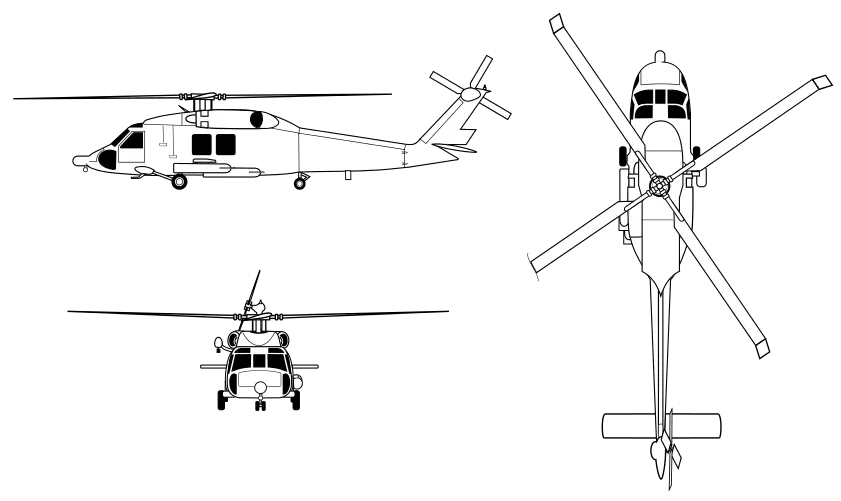
Helicopter Design and Outline Illustration -

Free WiFi Area Logo -

Complete Blue World Map -

Wireless Padlock Icon with Wi-Fi Signal -

Yellow Ethernet Cable for Network Connections -
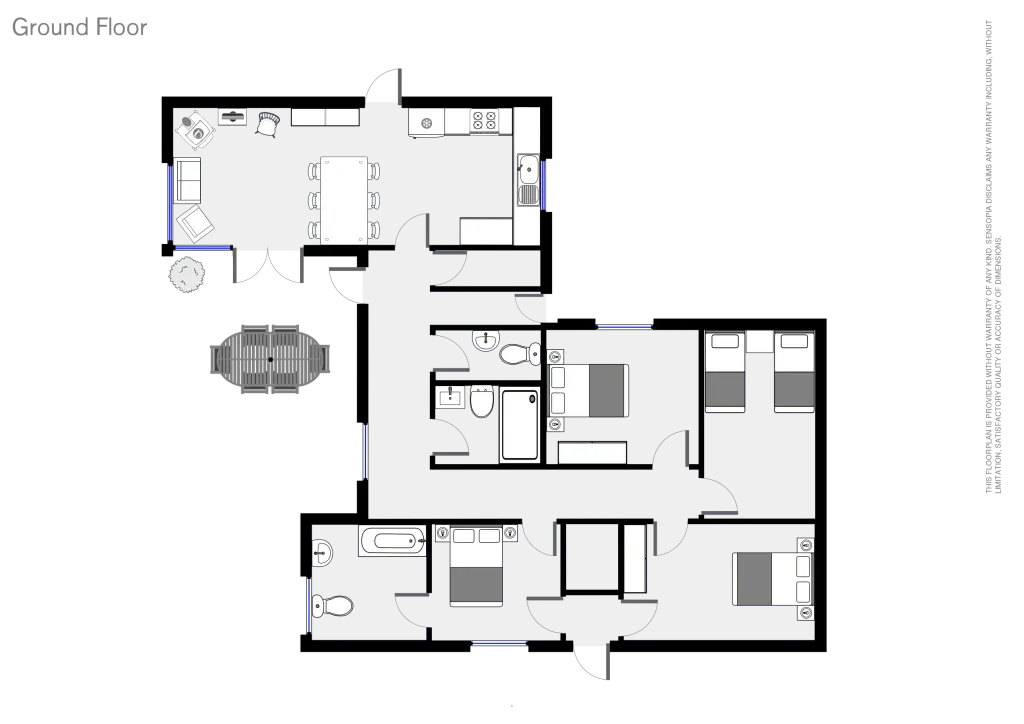
Ground Floor Plan Diagram Illustration -

Phone Call Icon with Signal Waves -

Blue Signal Tower Icon with Radio Waves -

Blue Satellite Icon with Signals -
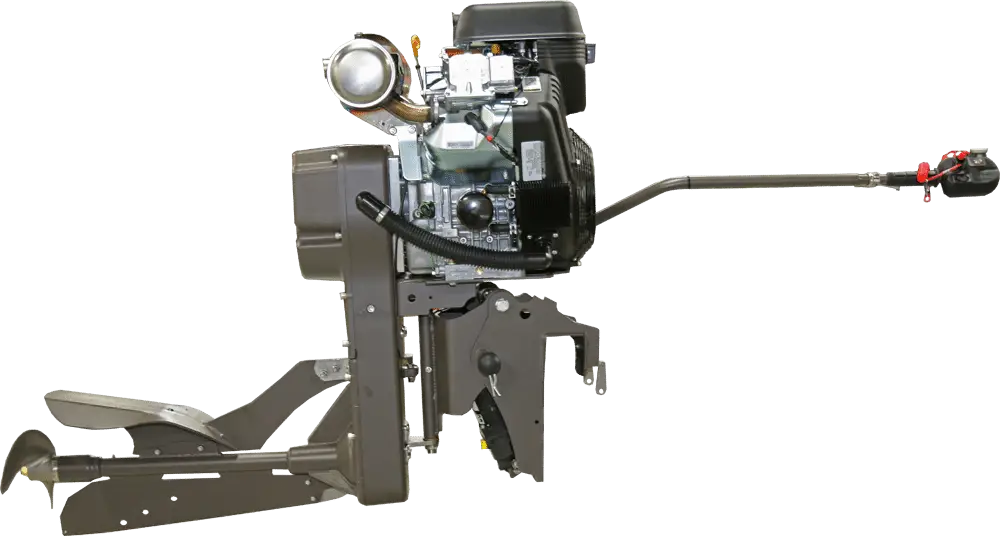
Powerful Engine Machinery -

Firewall Icon Depicting Security Concept -

3G Signal Wireless Icon -

Illustration of Call Center Network Connections -

Green Signal Bars Icon -

Blue Globe Icon for Global Connectivity -

Cloud Computing Concept with Connected Devices -

Team Cooperation Diagram -

Yammer Logo in Blue Circle -
Abstract architectural design in peach tones -

Simplistic Green Wireless Wifi Icon Illustration -
Modern Hexagonal Grid Pattern for Design -

Digestive System Diagram -
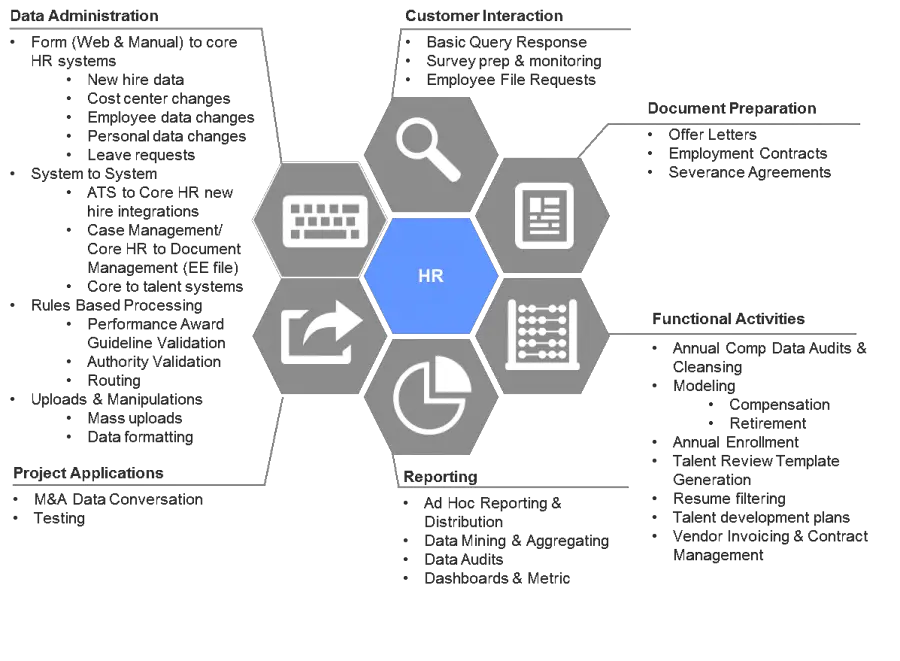
HR Workflow Diagram -

A+E Networks Logo -
Gray Cloud Icon with Signal -

Truck Silhouette for Transport and Freight -

Cloud Security Icon