
You Might Like
-

Chemical Molecule Structure Illustration -

Red Virus Illustration Representing Pathogen -

Zigzag Down Arrow Icon for Decline Representation -

Art Supplies Doodle -

Black Microscope Illustration -

Thermometer Symbol Icon -

Molecule Structure Scientific Model -

Cross Made of DNA Strands -

Blue Declining Bar Graph with Arrow -

Circle Pie Chart Icon -

Telescope on Tripod Illustration -
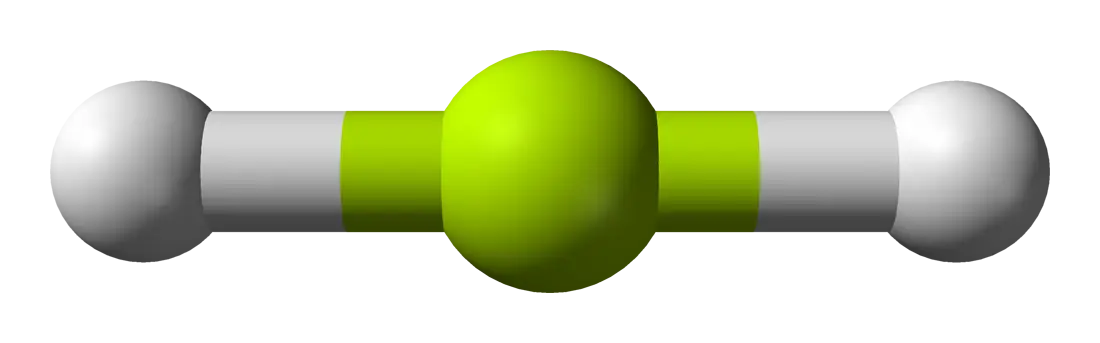
Chemical Molecule Illustration -

Blue Human Brain Illustration -

Declining Chart Illustration -

Eco-Friendly Science Flask Icon -

Round-Bottom Flask with Green Liquid -

Laboratory Experiment Setup Illustration -

Science Beaker Icon -

Scientist in a White Lab Coat -

Blue Heart Flask Illustration -

Space Station Silhouette -

Magnifying Glass with Graph Illustration -

Digital Microscope for Scientific Research -

Detailed Cannabis Plant Illustration -

Blue Science Flask with Liquid -

Astronaut Floating in Outer Space Illustration -

Human Skull Model for Anatomy Study -

Electric Field and Electrostatic Force Diagram -
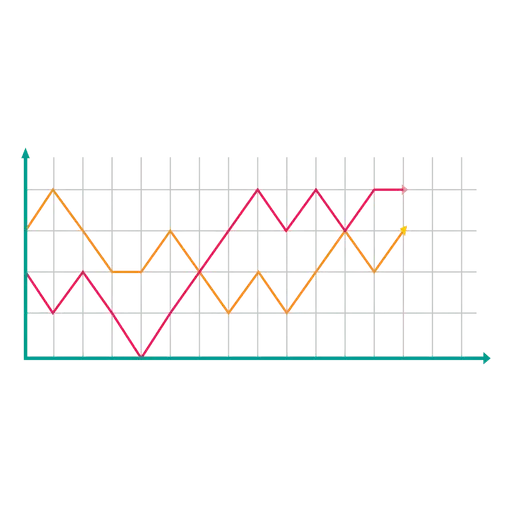
Line Graph for Data Visualization -

ESA European Space Agency Logo