
You Might Like
-

Simple Credit Card Icon -

Colored Regional Map of Africa -

LinkedIn Professional Networking Platform Logo -
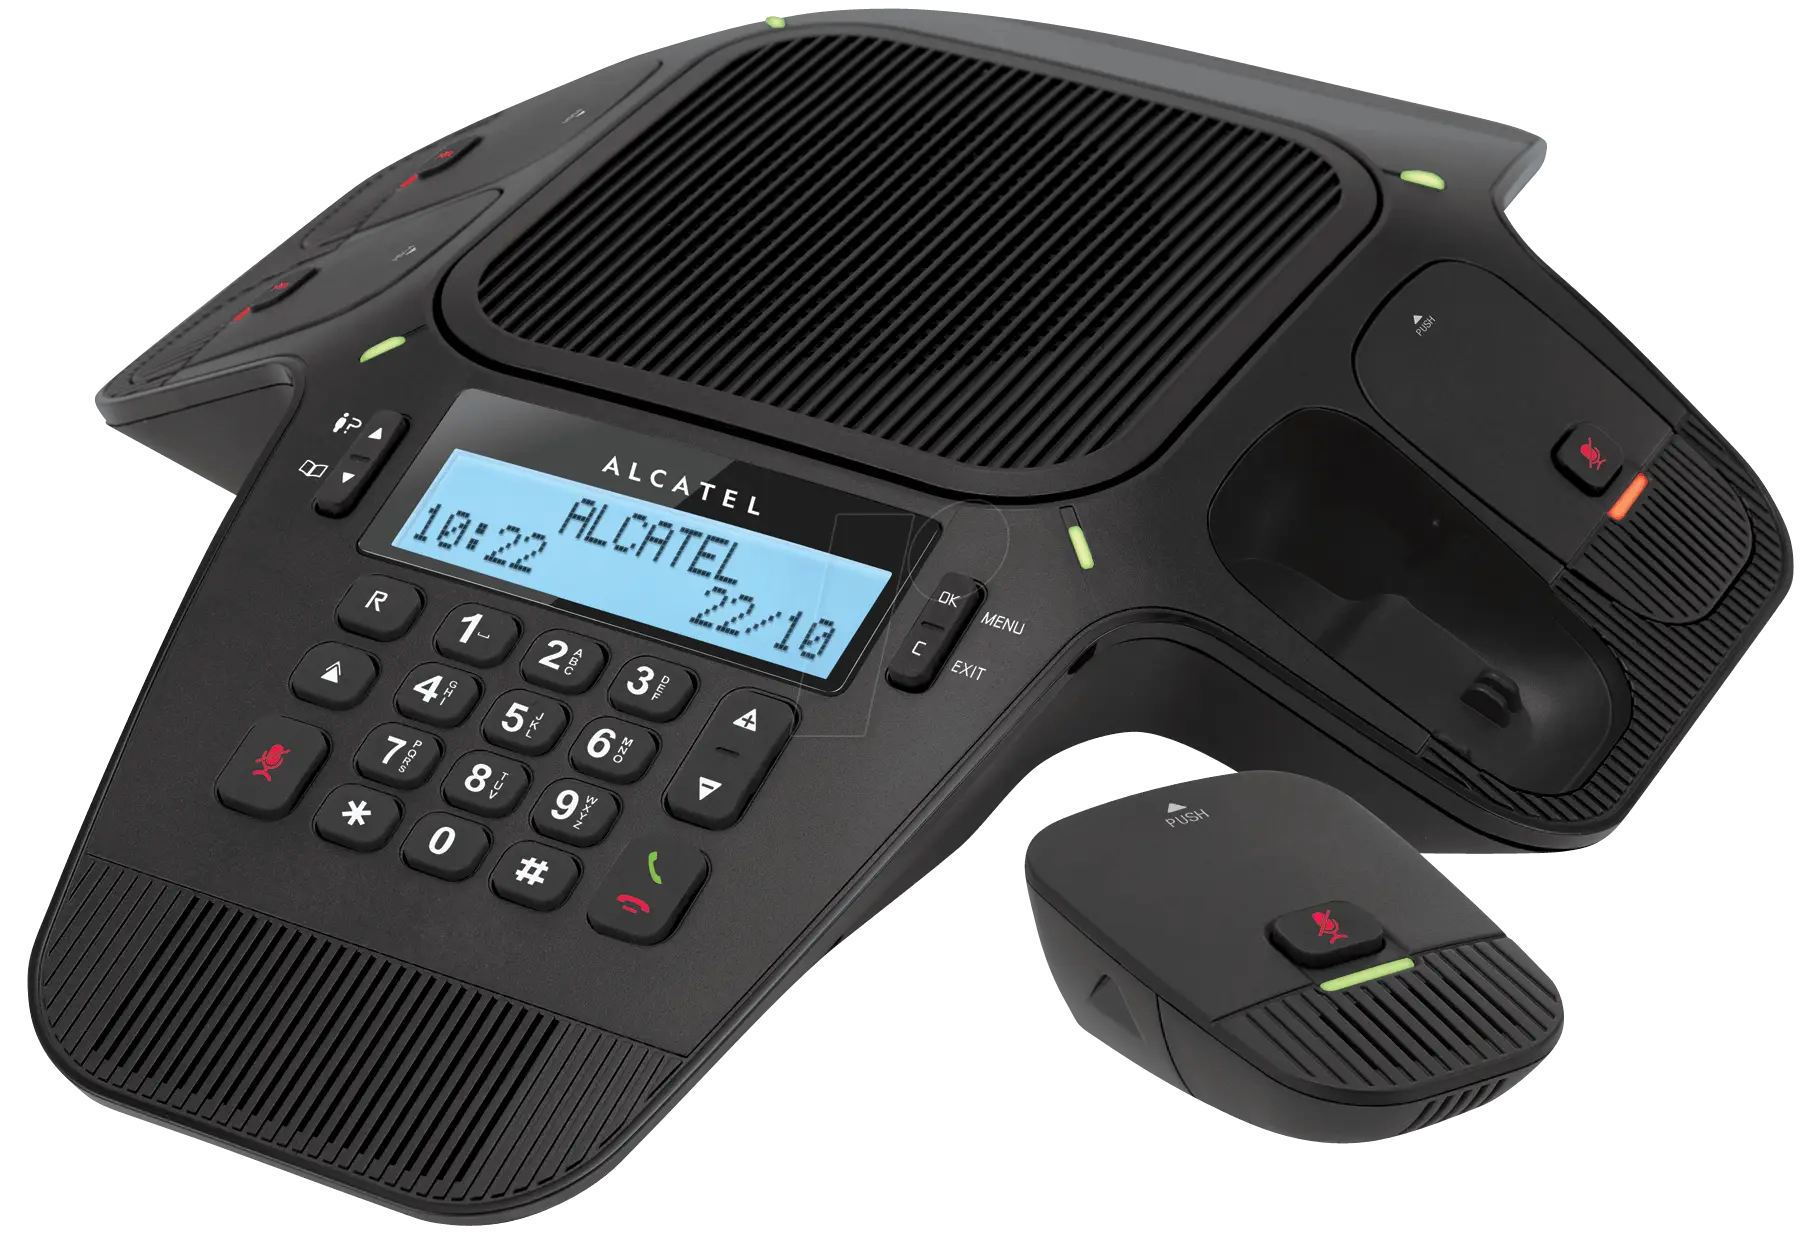
Modern Office Conference Phone System -

Monopoly Board Game in Space Theme -

Idea Generation and Teamwork Illustration -

Team with Growth Graph Illustration -

Black Money Bag Icon with Dollar Sign -

Business Strategy Icons -

Businessmen Climbing Stairs -

Hand Holding Credit Card -

Hand Holding a Coin -

Ziraat Sigorta Insurance Logo -

Various Devices Displaying Software -

Open Signboard Icon for Business Representation -

Complete Blue World Map -

Professional Tan Leather Briefcase -

Icon of KPI Dashboard with Graph and Person -

Thumbs Up Gesture -

Zigzag Down Arrow Icon for Decline Representation -

Dollar Sign Made of Pills -

Presentation Board with Graph for Business Concepts -

Businesswoman in Professional Suit -

Golden Bitcoin Cryptocurrency Coin -

Yellow Ethernet Cable for Network Connections -

Bar Chart with Upward Arrow -

Infographic Pencil with Data Elements -

Man in Black Suit -

Group of Professional Businesspeople in Formal Attire -

Dollar Sign with Circular Arrows