
You Might Like
-
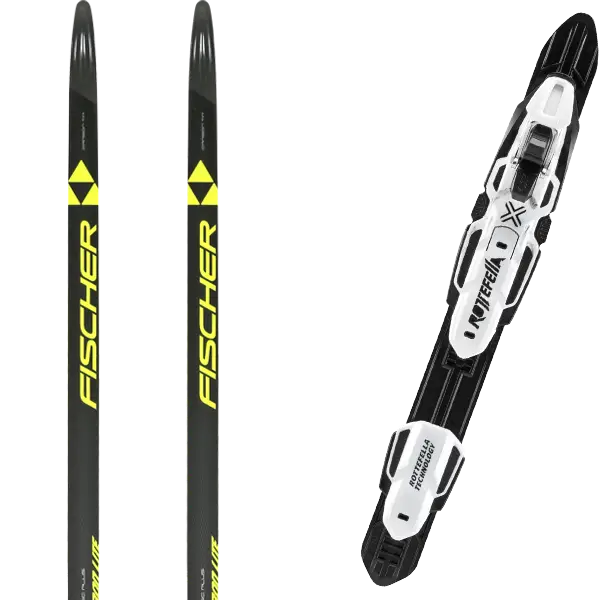
High-Performance Fischer Ski Equipment -

Colored Regional Map of Africa -

LinkedIn Professional Networking Platform Logo -

Modern Office Conference Phone System -

Team with Growth Graph Illustration -
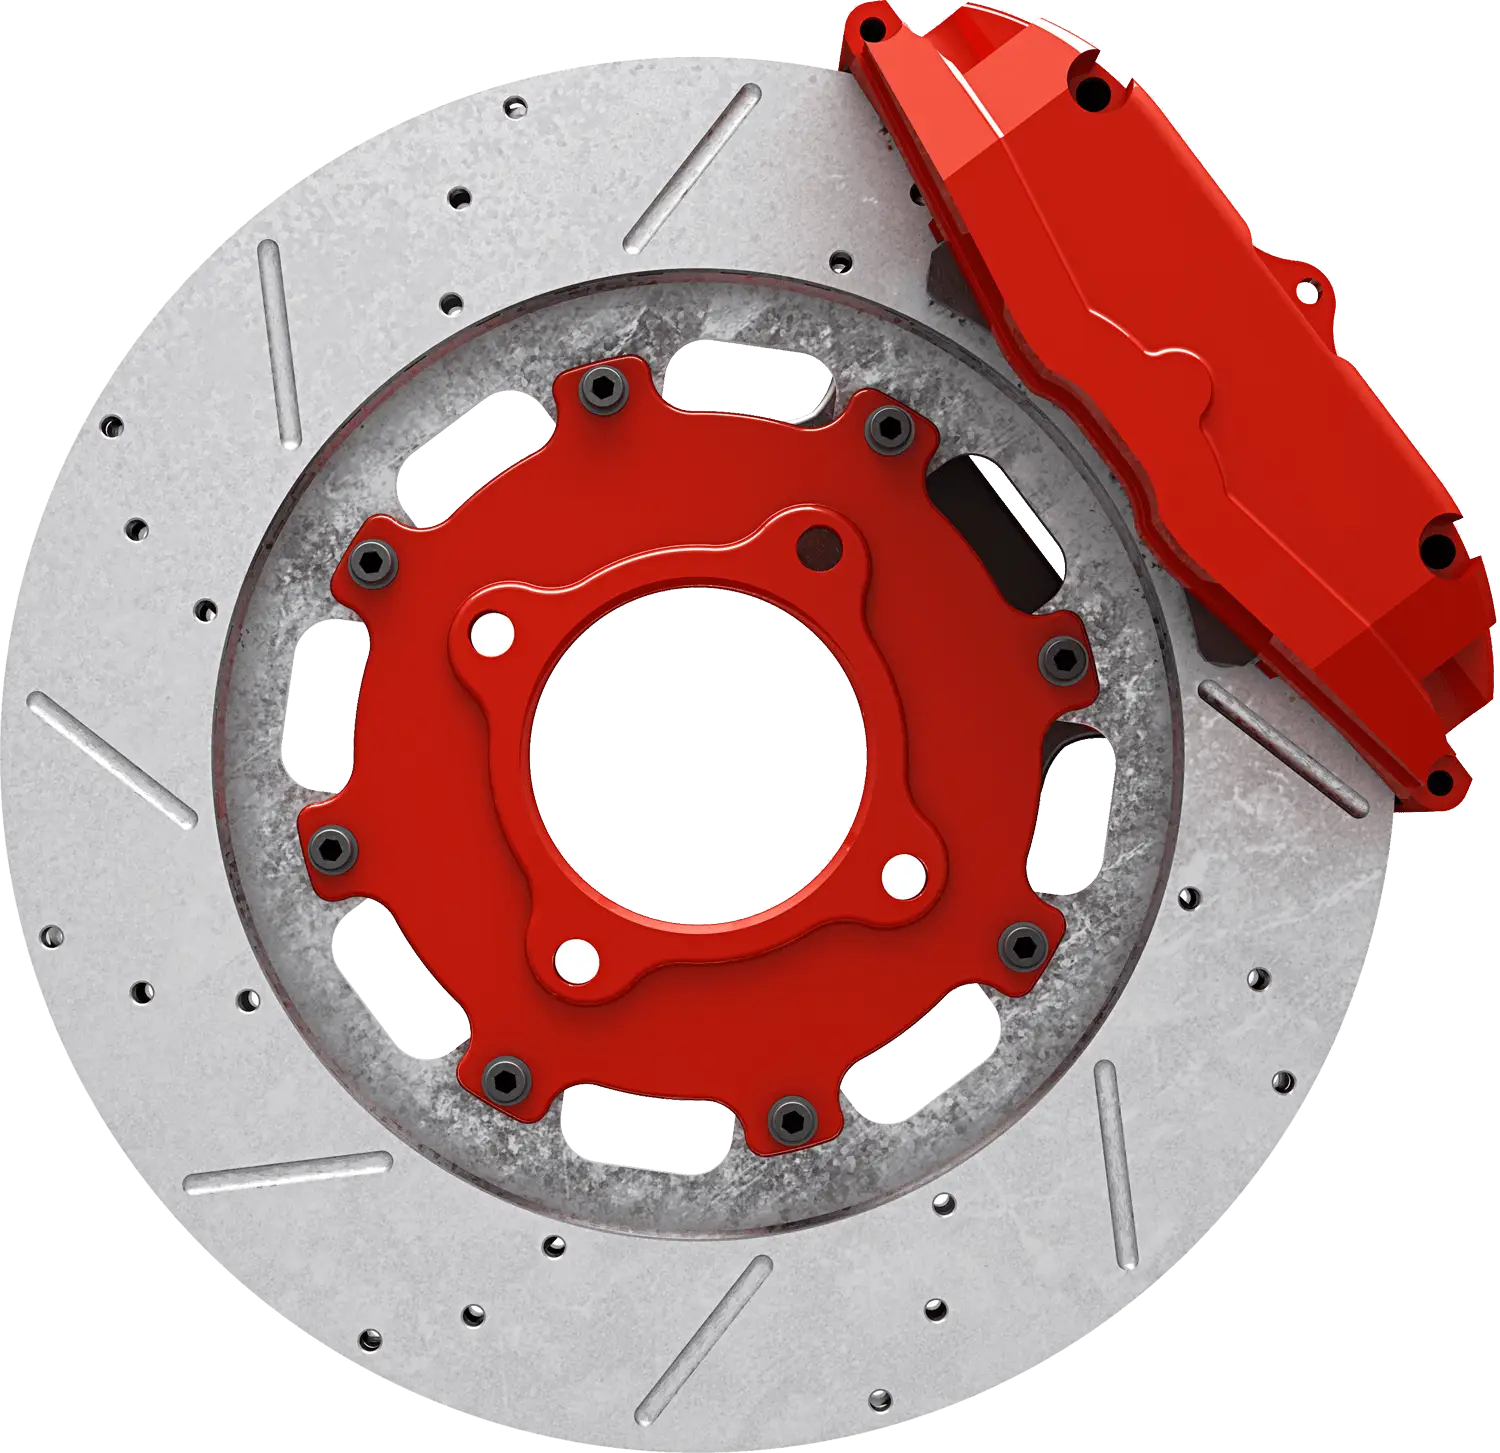
Red Brake Disc Automotive Part -
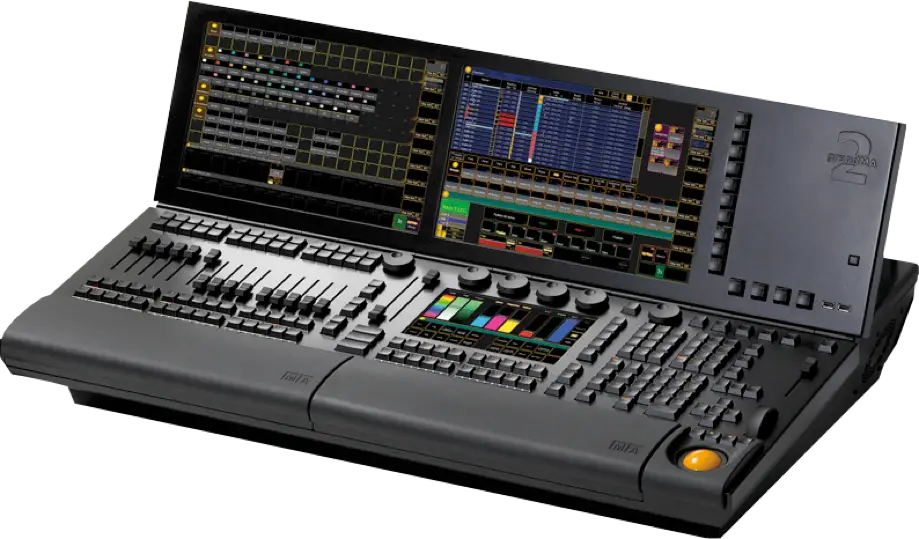
Professional Lighting Console for Stage Performance -

Business Strategy Icons -

Traditional Figure Drawing -

White Sports Luxury Car -
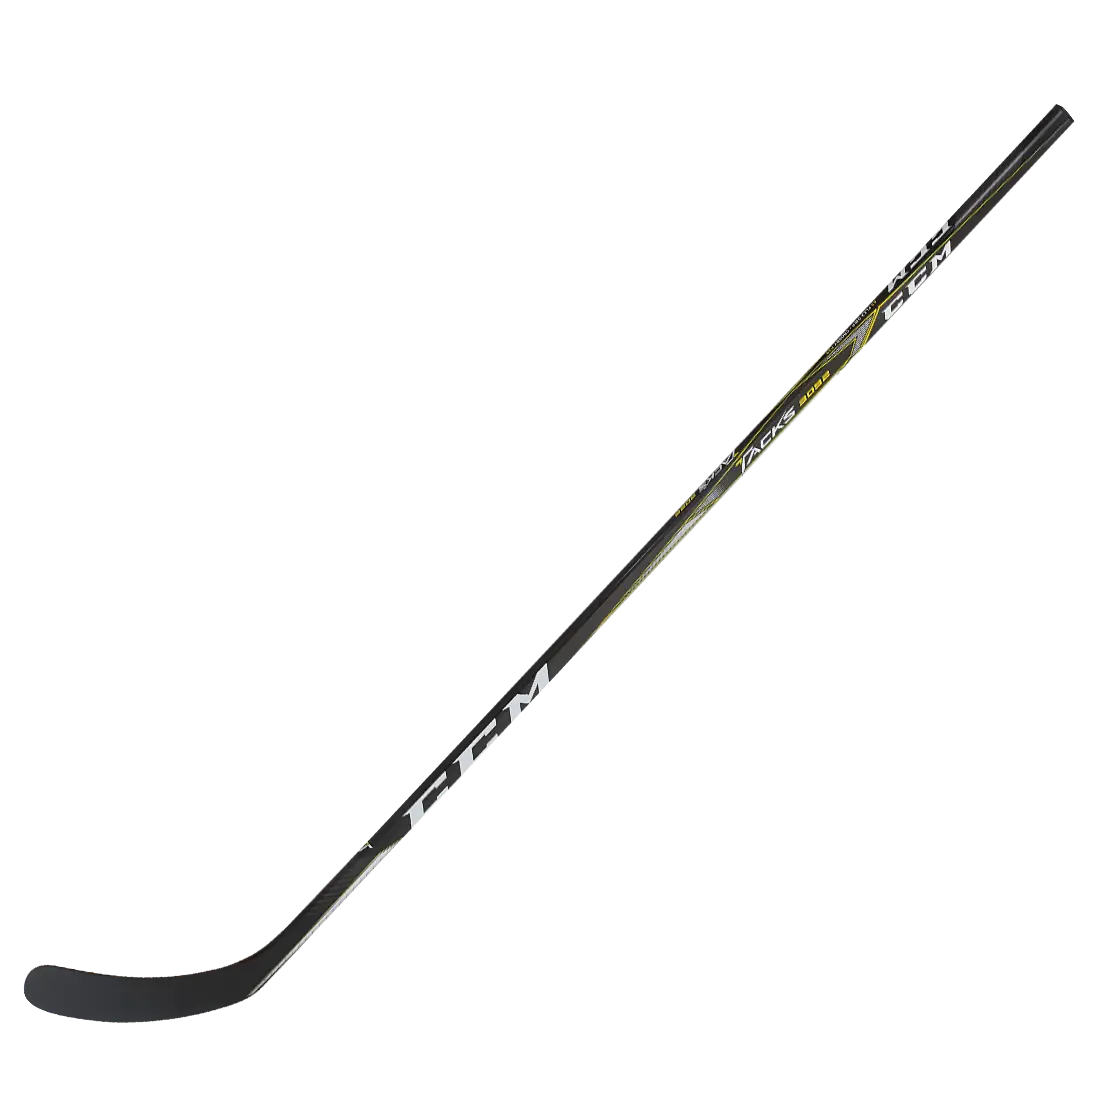
Black Hockey Stick for Sports Use -
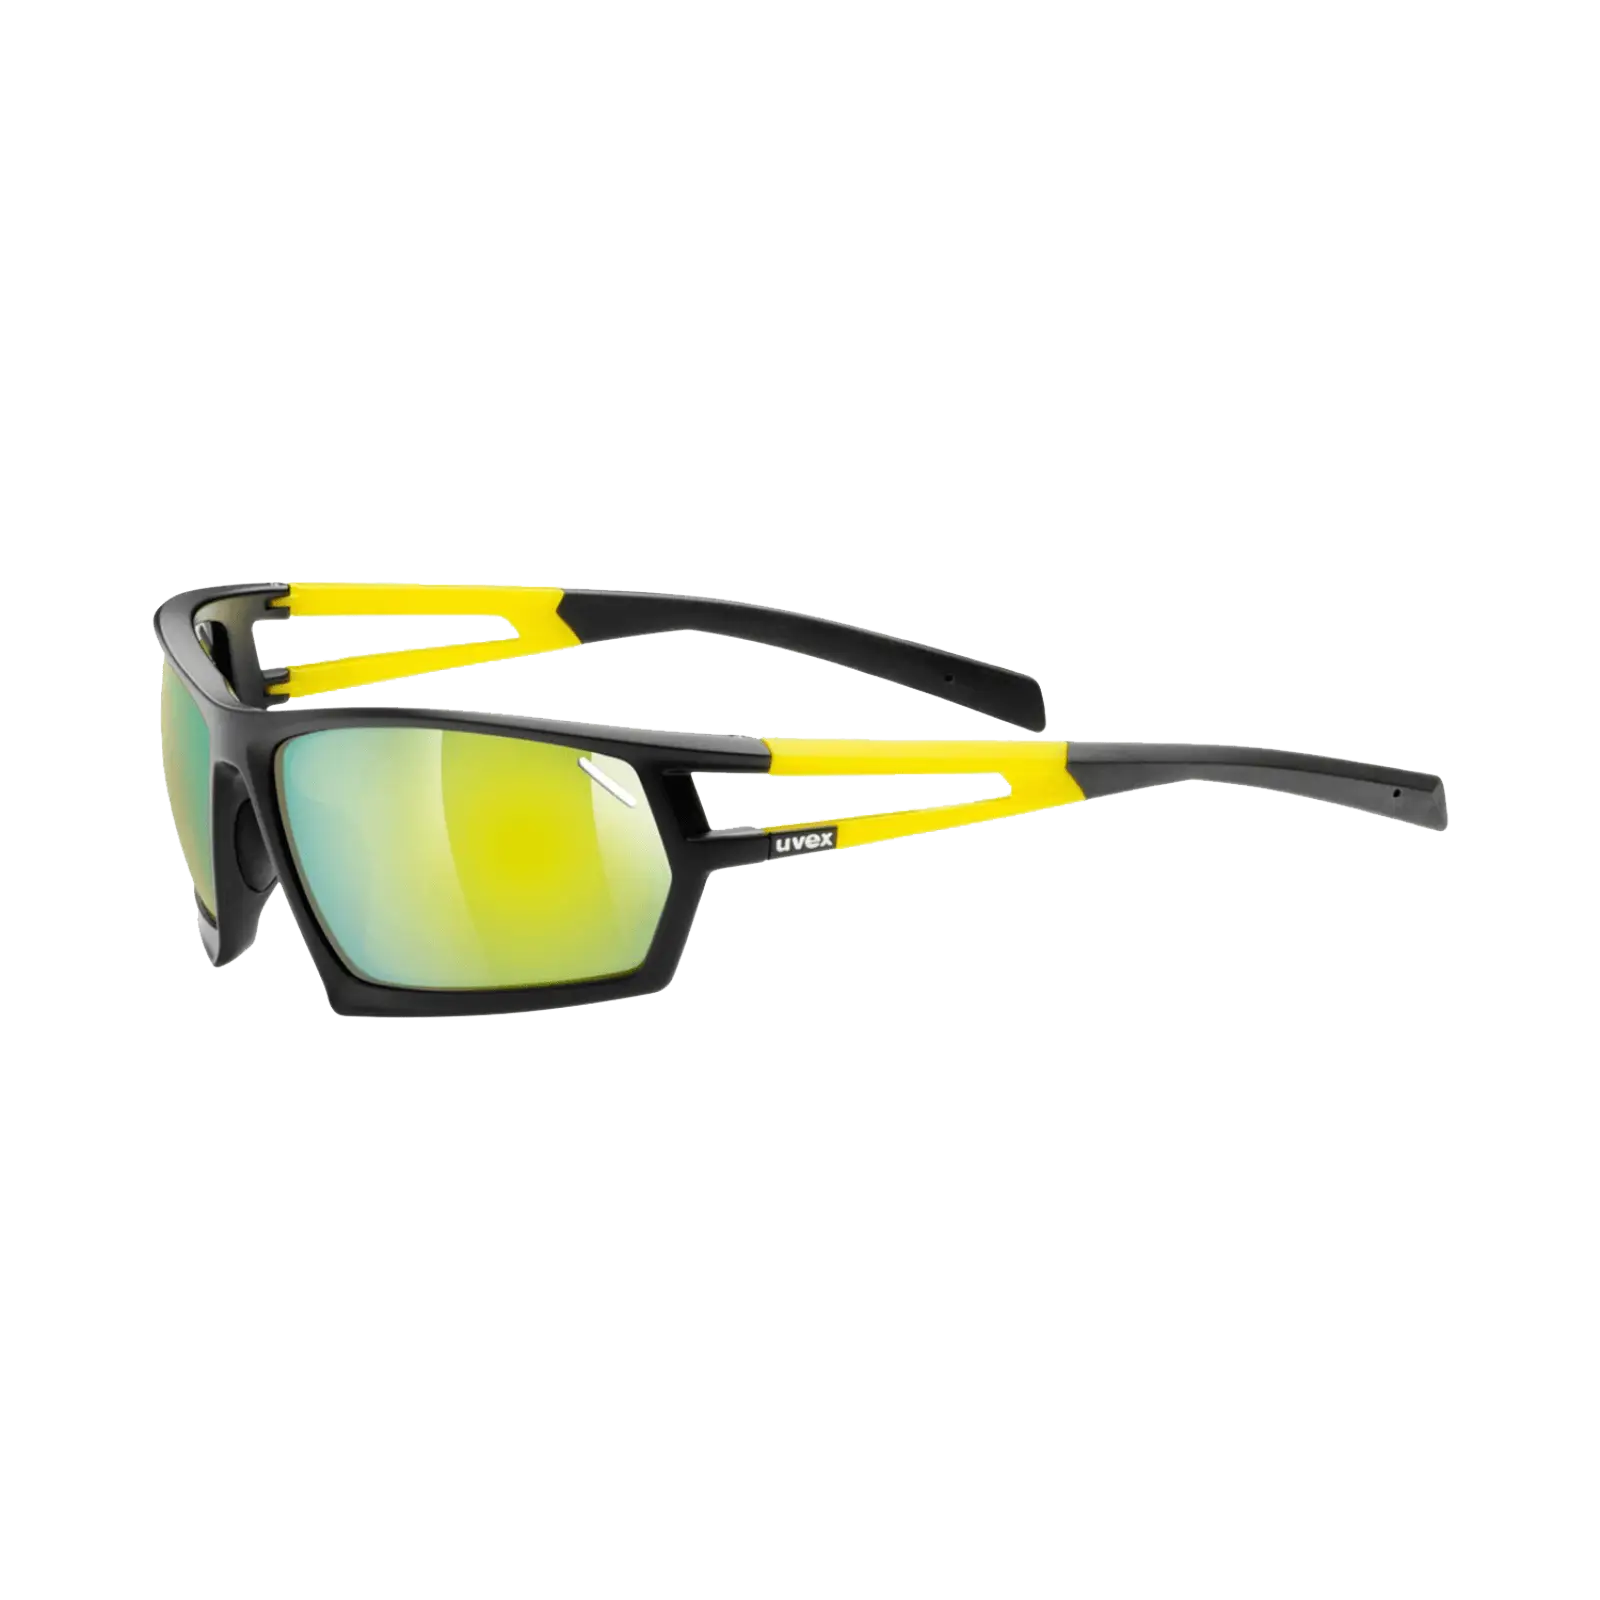
Yellow Reflective Sports Sunglasses -

Cartoon Elephant Balancing on a Ball -
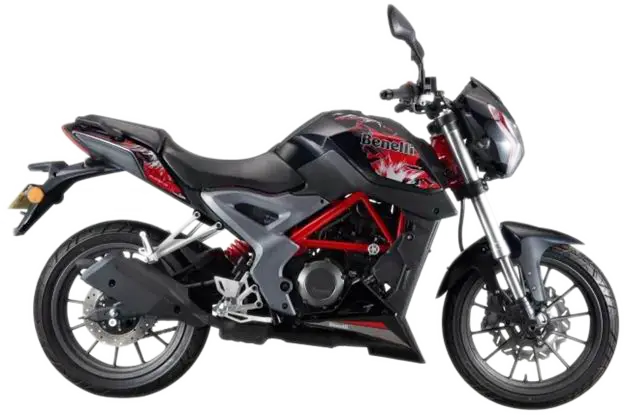
Sleek Sports Motorcycle in Black and Red -

Various Devices Displaying Software -

Open Signboard Icon for Business Representation -

Complete Blue World Map -
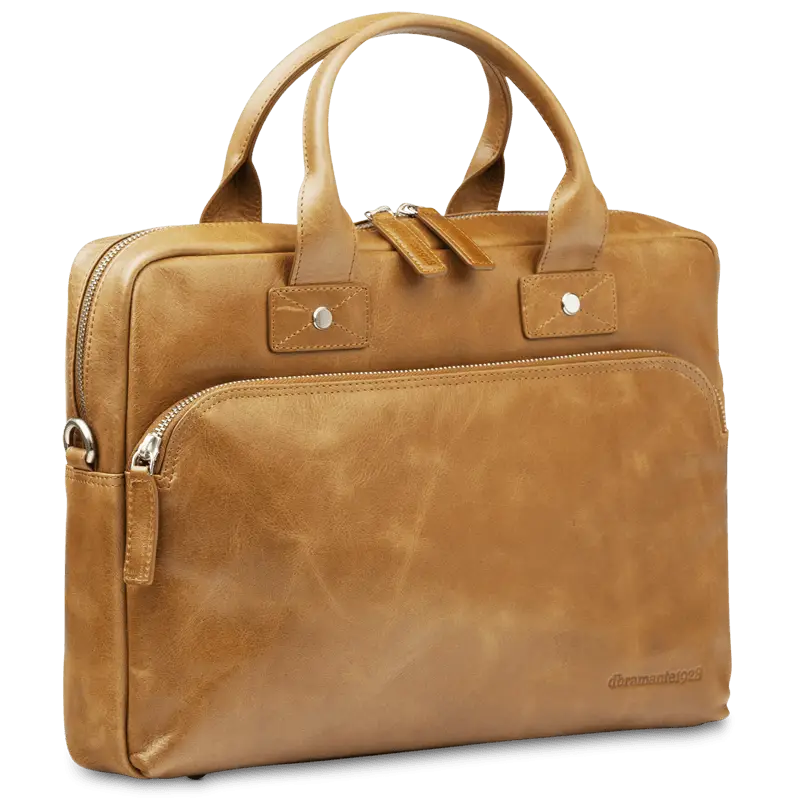
Professional Tan Leather Briefcase -

Icon of KPI Dashboard with Graph and Person -
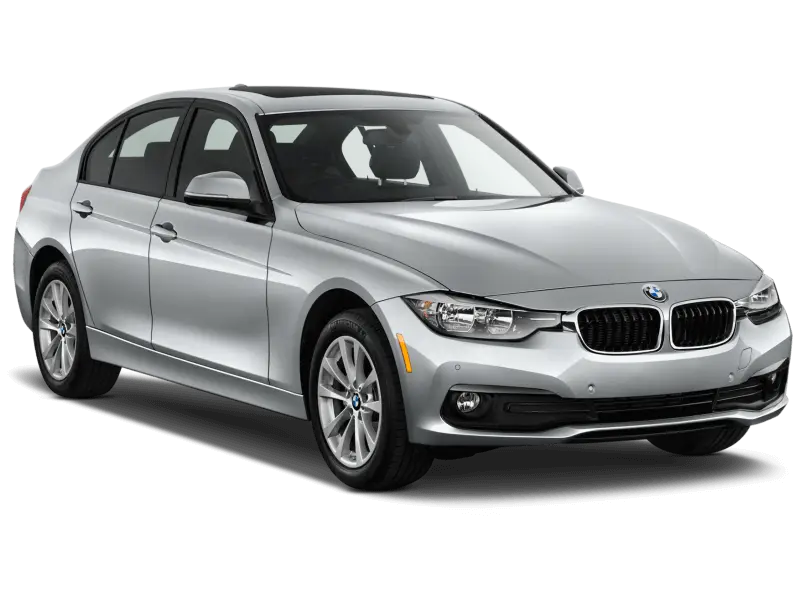
Stylish Silver Sedan Car for Urban and Family Use -

Thumbs Up Gesture -
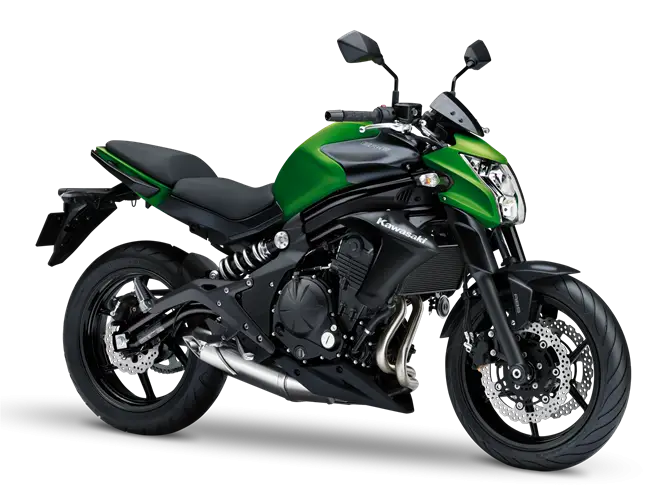
Green and Black Urban Motorcycle for Daily Commutes -

Zigzag Down Arrow Icon for Decline Representation -
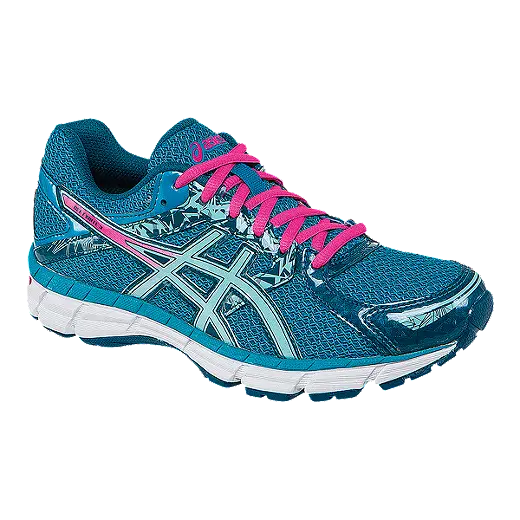
Blue Athletic Running Shoe with Pink Laces -

Presentation Board with Graph for Business Concepts -
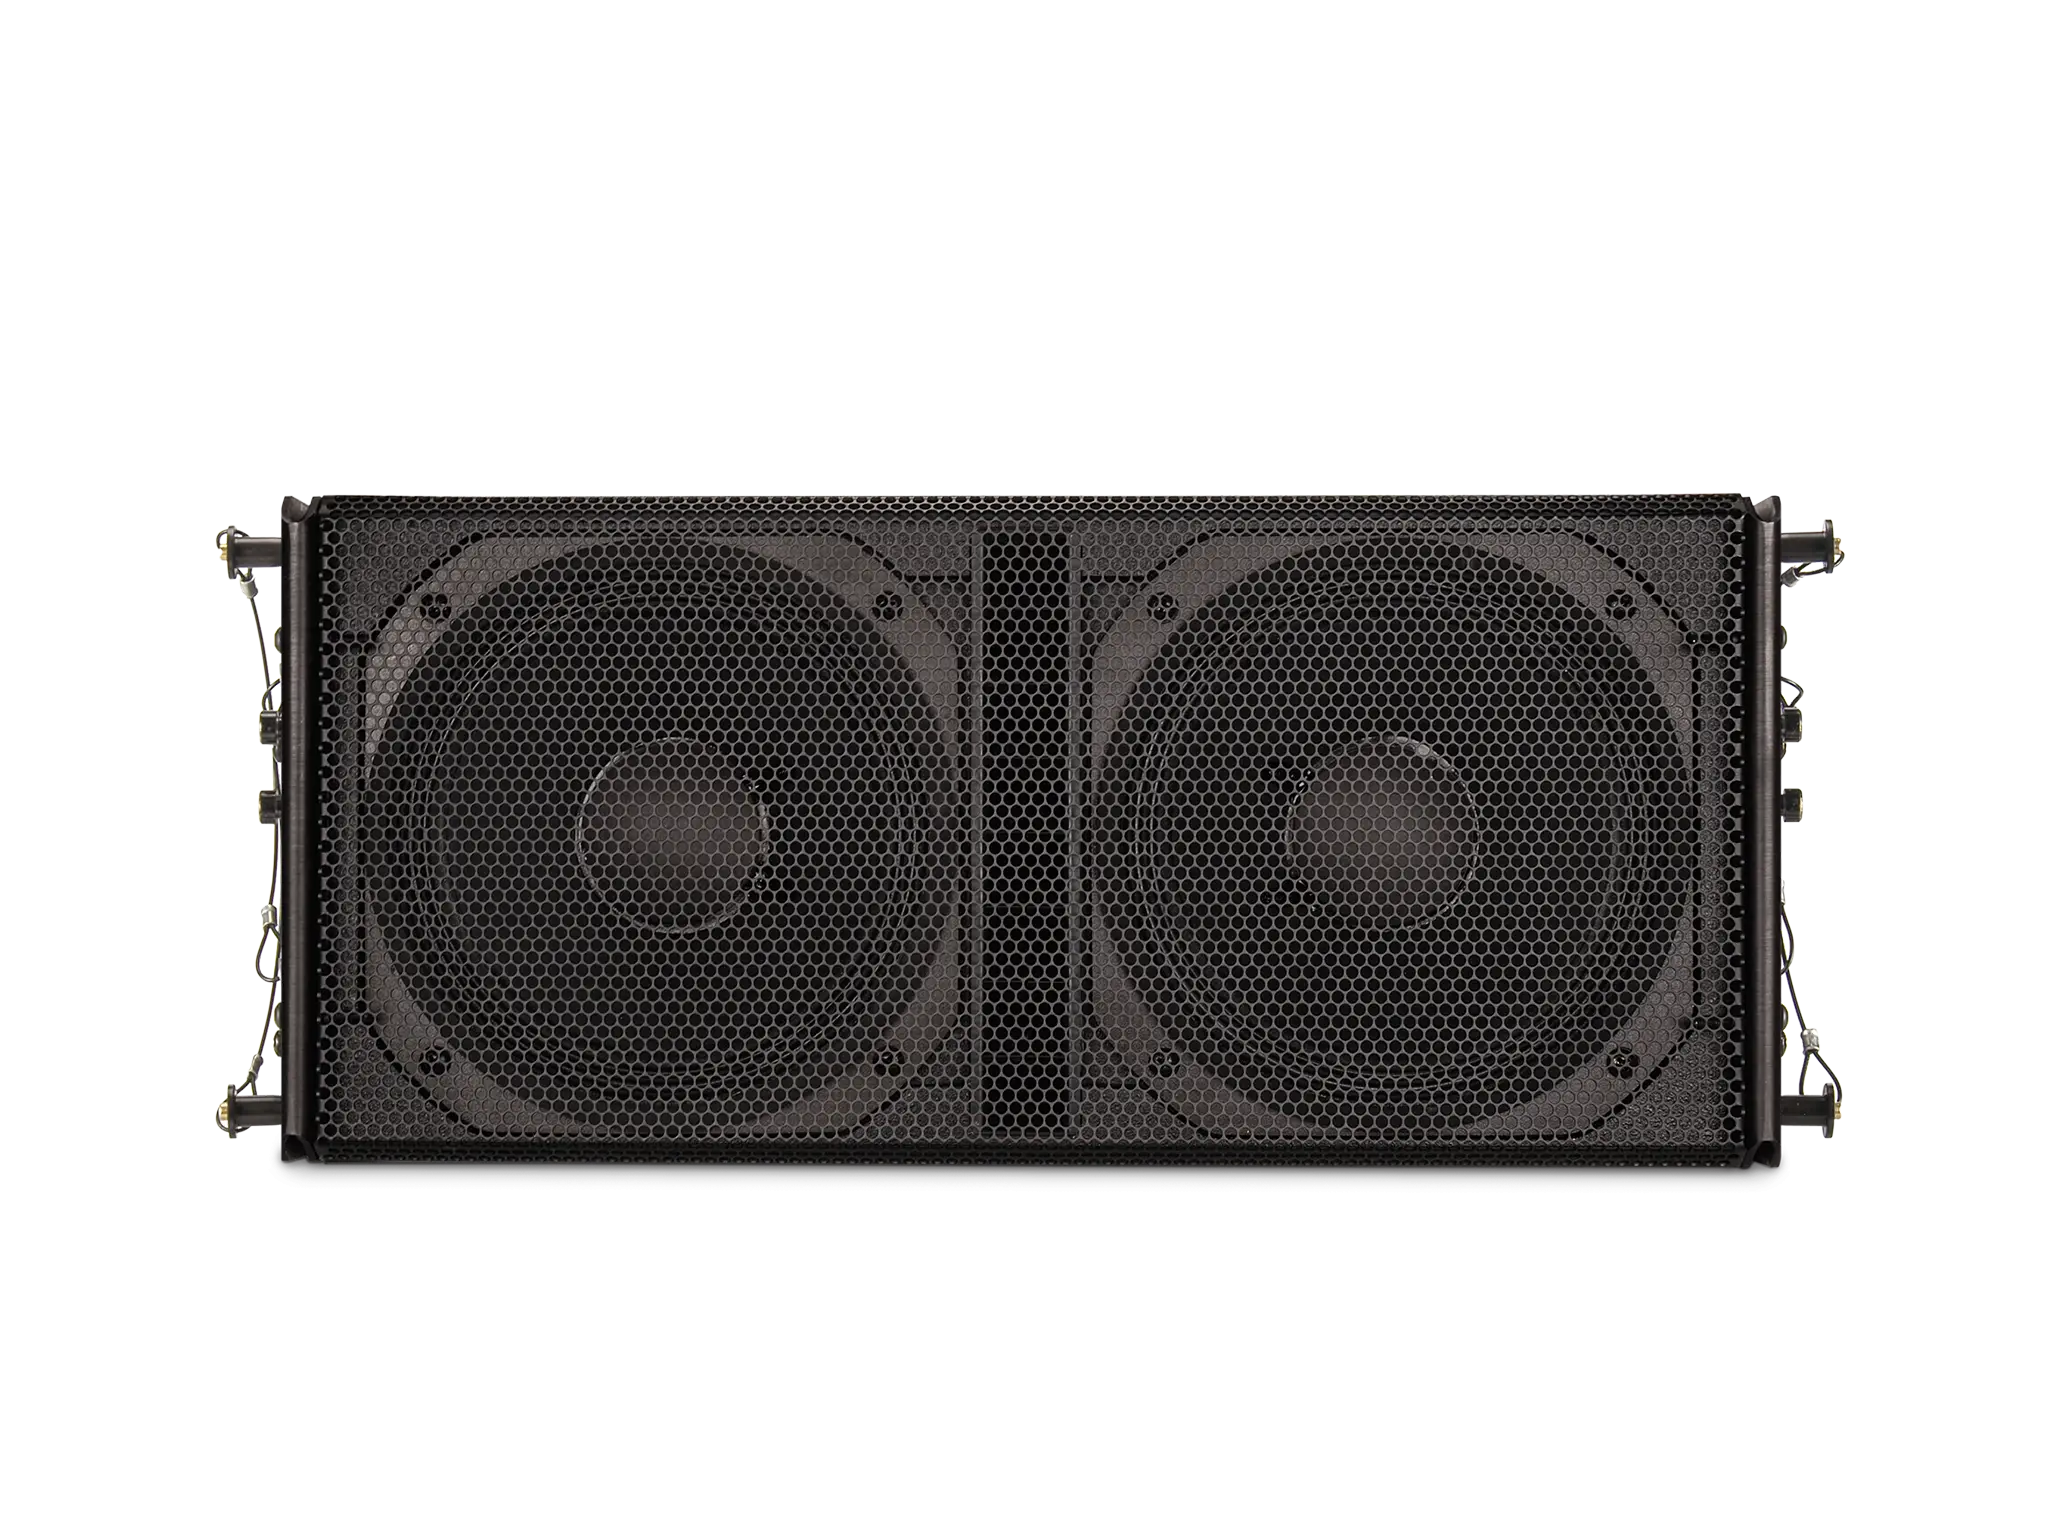
Black Speaker -

Businesswoman in Professional Suit -
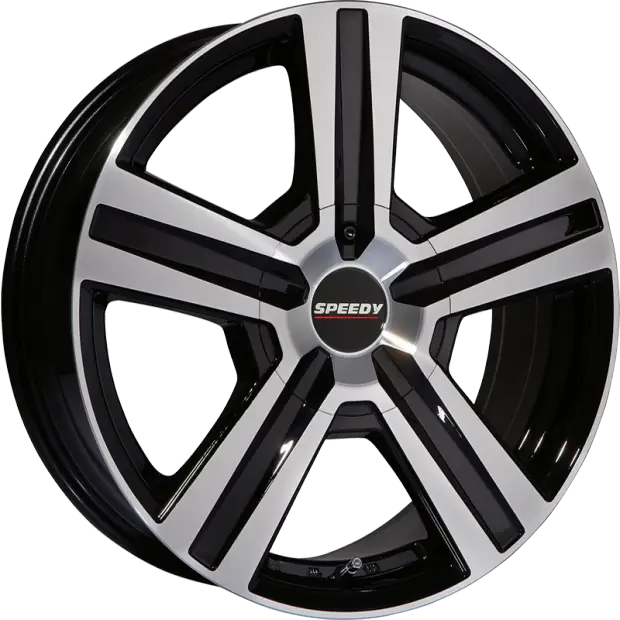
Speedy Black and Silver Car Wheel -

Yellow Ethernet Cable for Network Connections -

Bar Chart with Upward Arrow