You Might Like
-
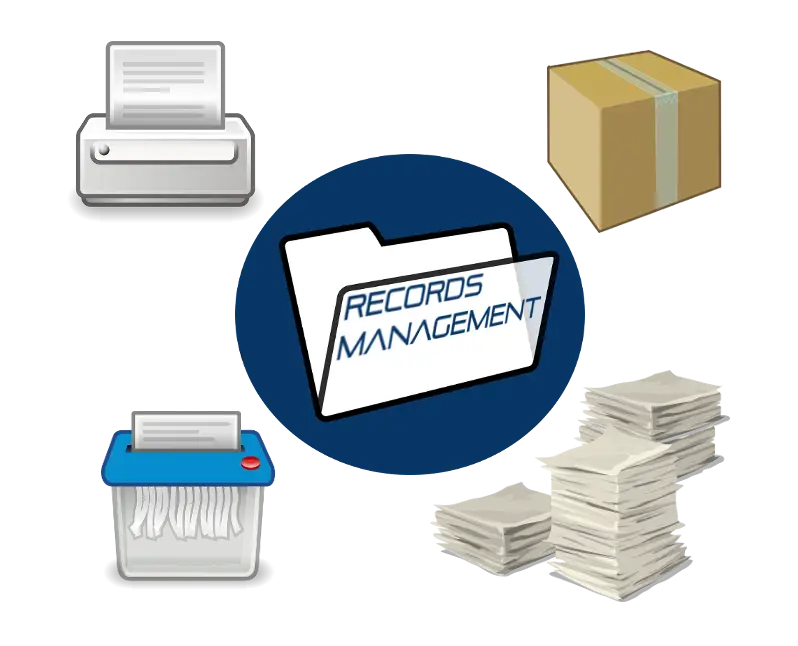
Records Management Tools -

Man Holding Completed Checklist Illustration -

Business Strategy Icons -

Simple Checklist Icon -

Laptop and Devices with Cloud -

What's Your Schedule? -

Assorted Office Supplies and Gadgets -

Business Icons Set for Digital Workflows -

Team Cooperation Diagram -

Head Icon with Clock Inside for Time Management Concept -
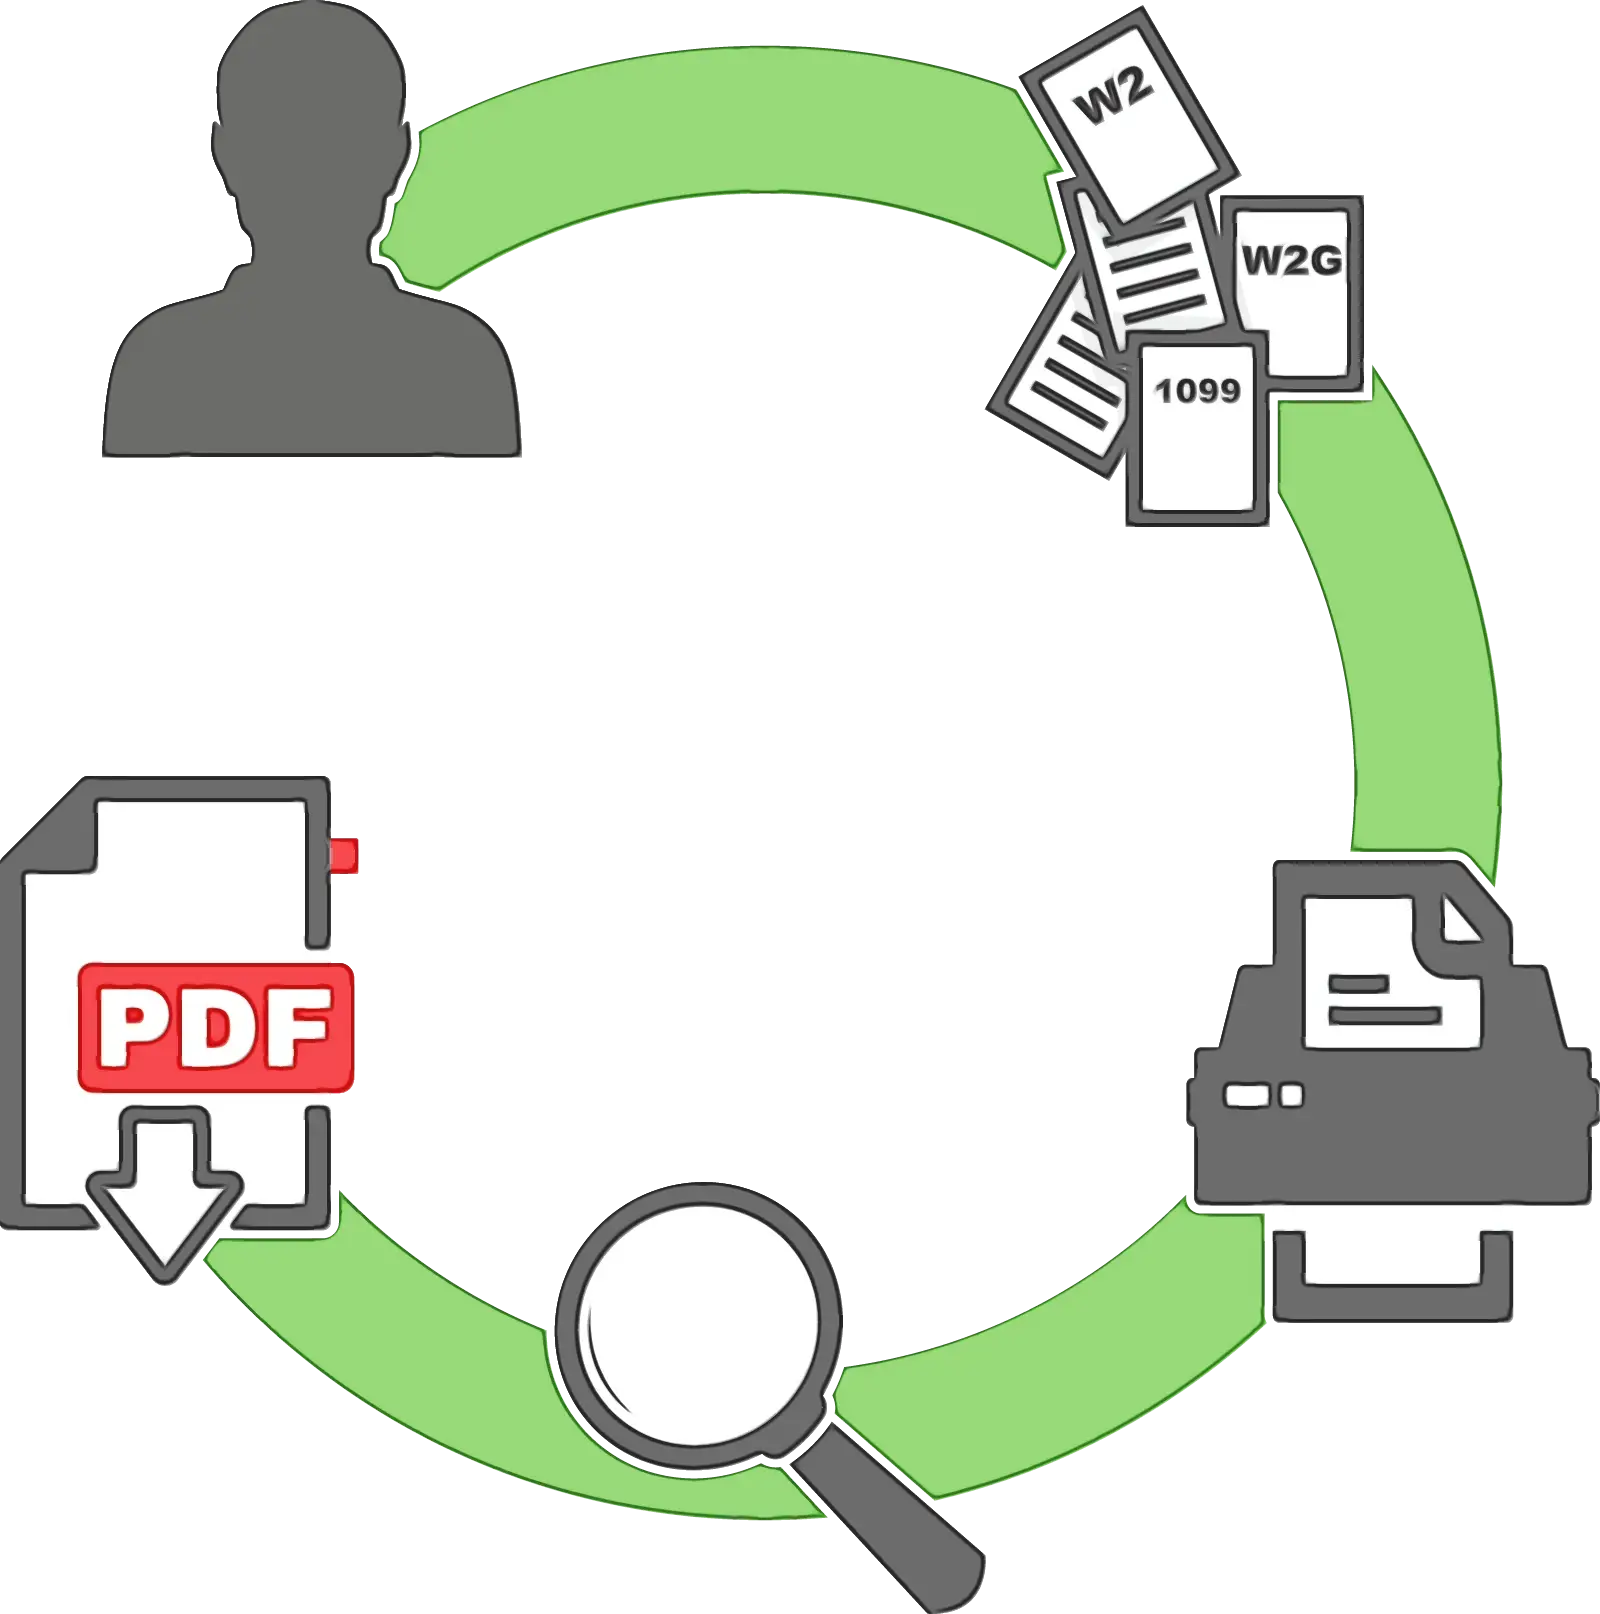
Document Processing Cycle -
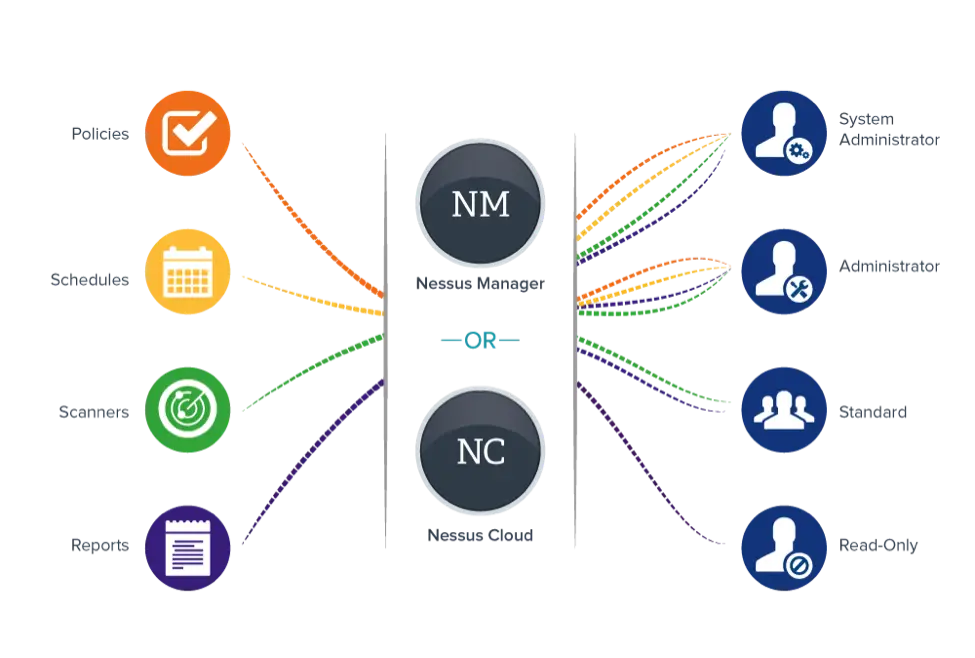
Nexus Manager Flowchart -
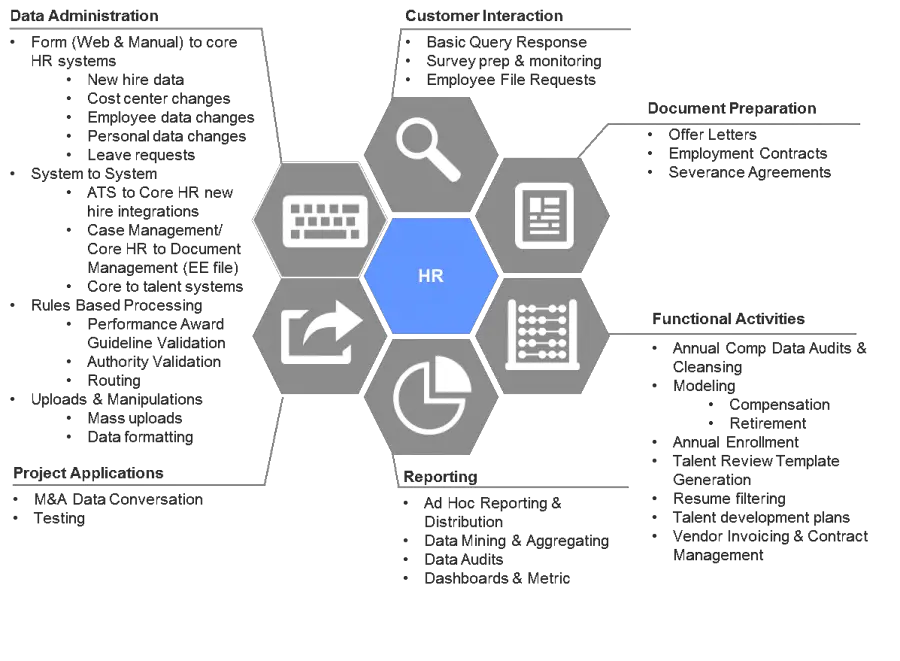
HR Workflow Diagram -

Man with Checklist Cartoon -

Gear with Arrows for Technology Concept -
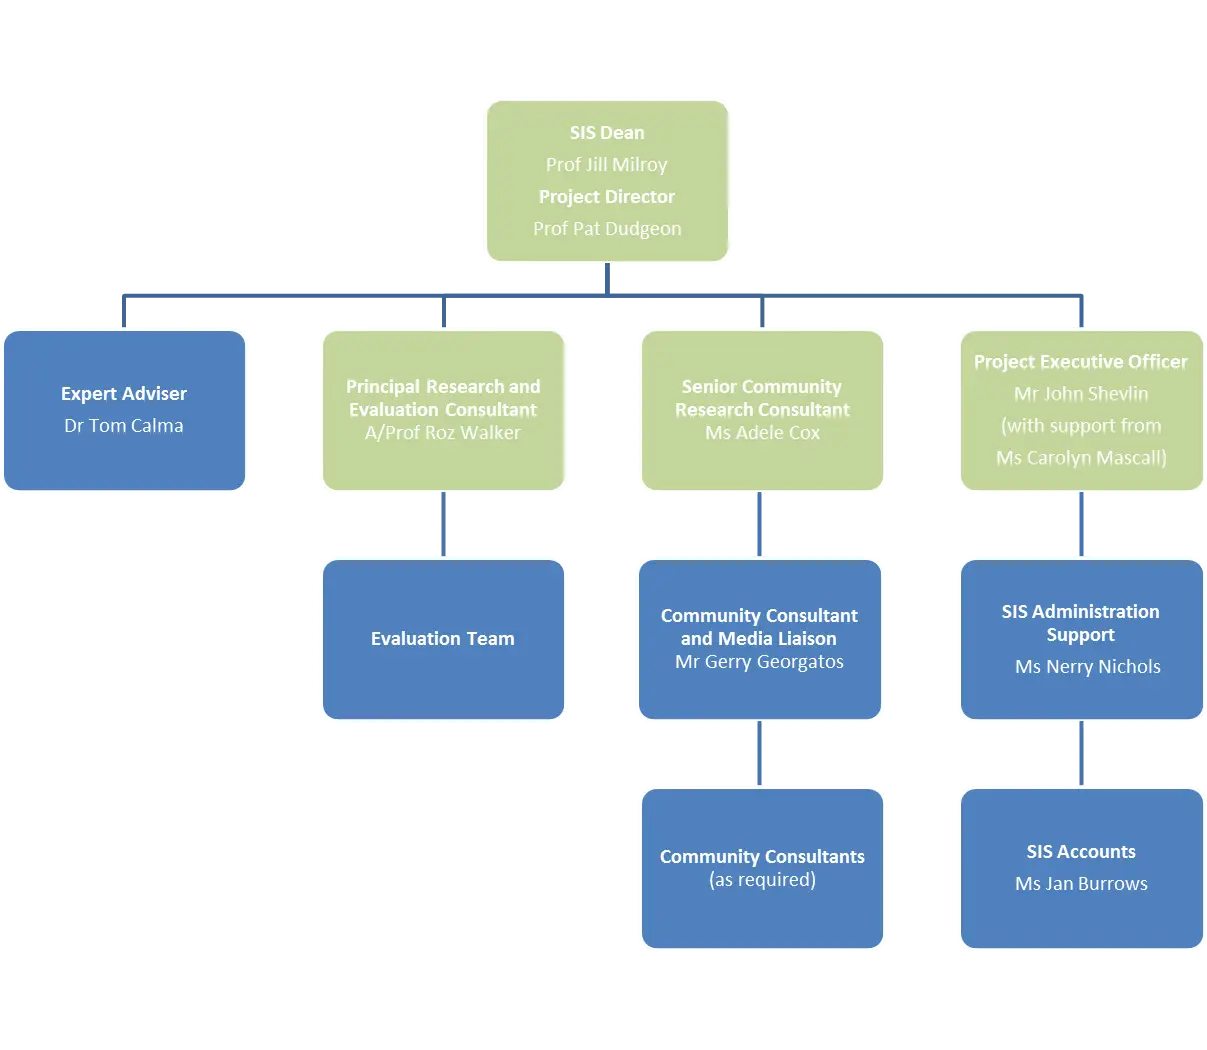
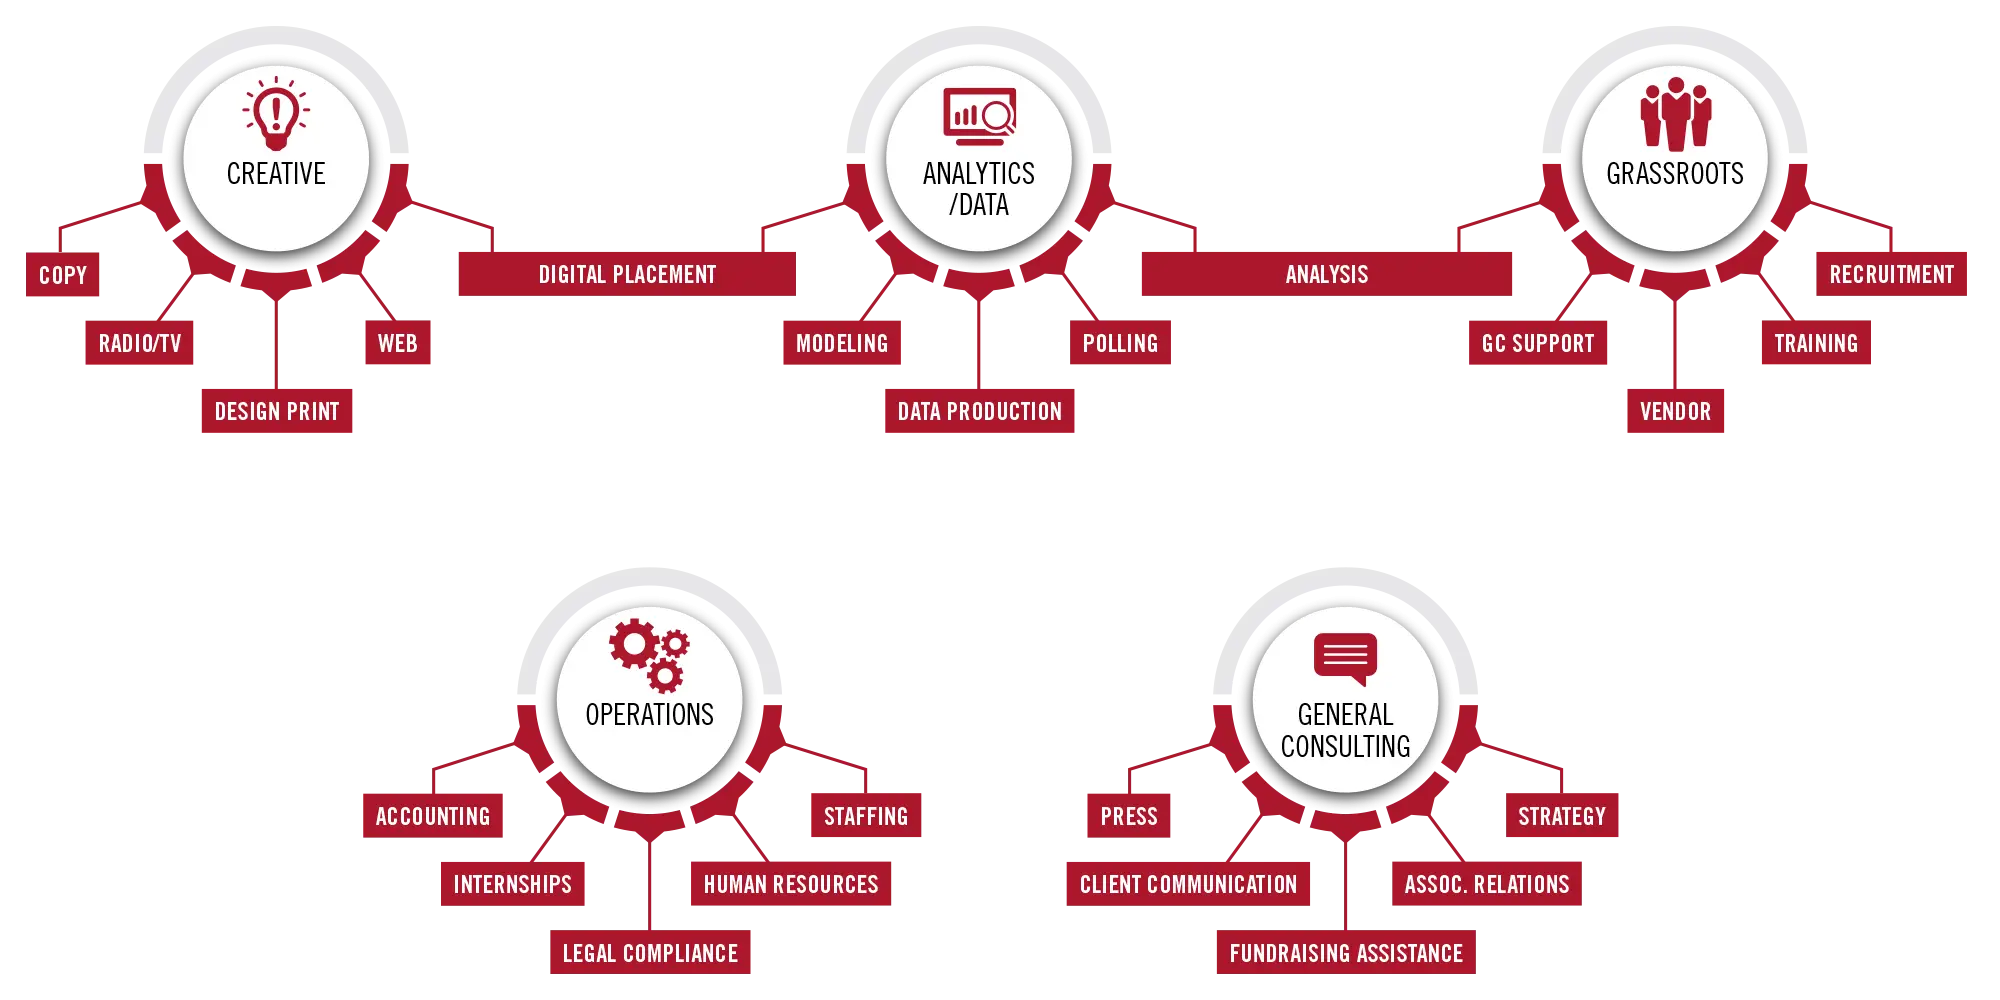
Organizational Flowchart Diagram -

Teamwork with Gears -

Teamwork and Gear Collaboration Illustration -

Documents on Laptop -

Yellow Clipboard with Checklist Icon -

McKinsey Global Institute Logo -
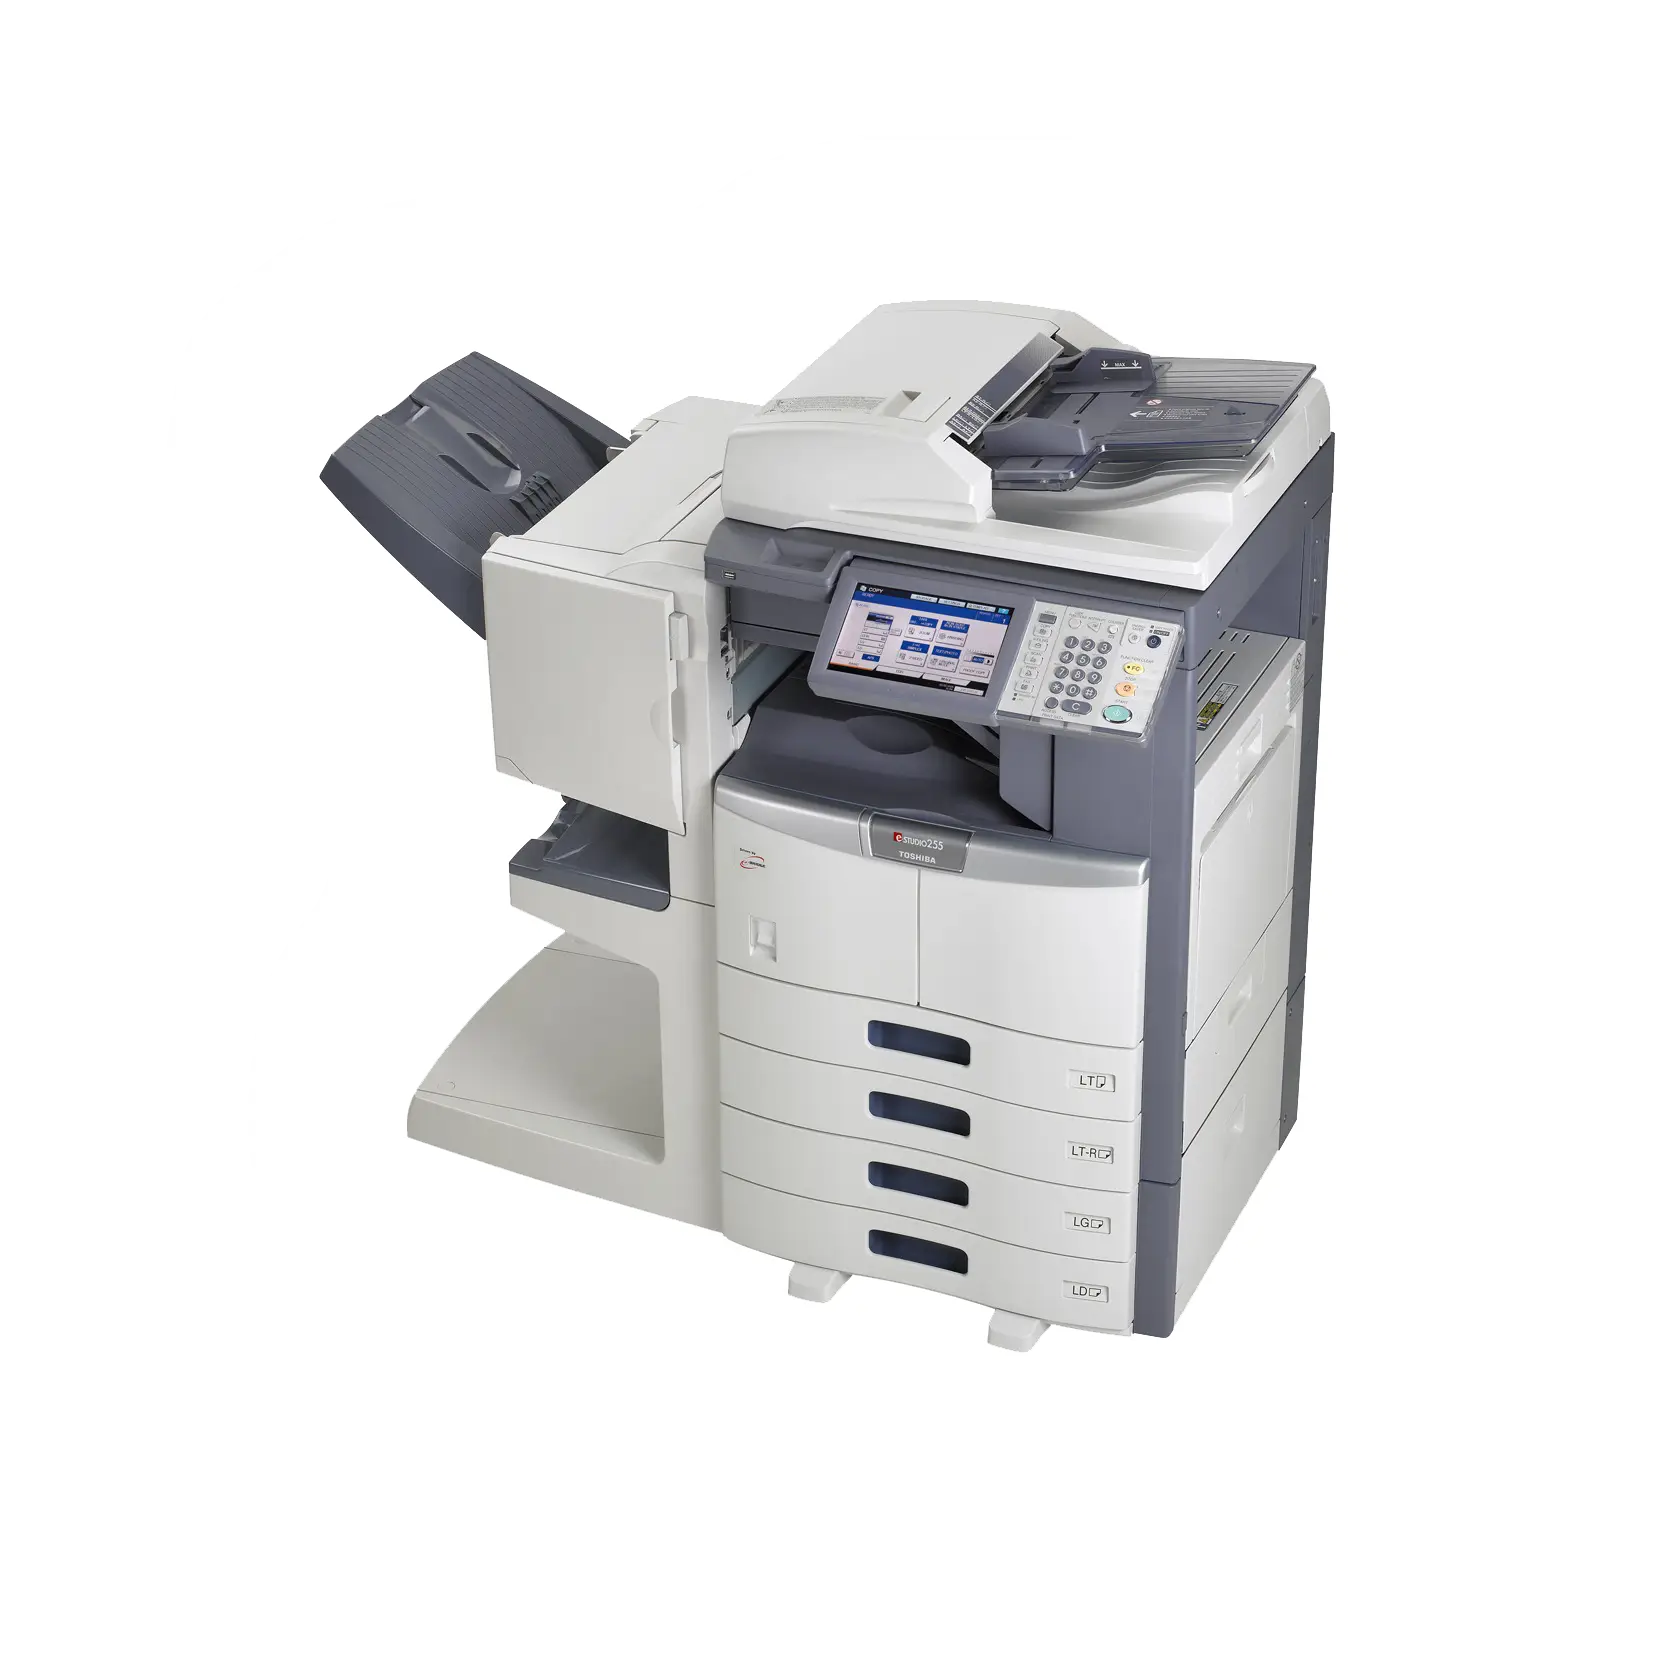
Office Printer for Efficient Document Management -

Network Connections Diagram -

Hand Truck with Boxes and Checklist for Logistics -
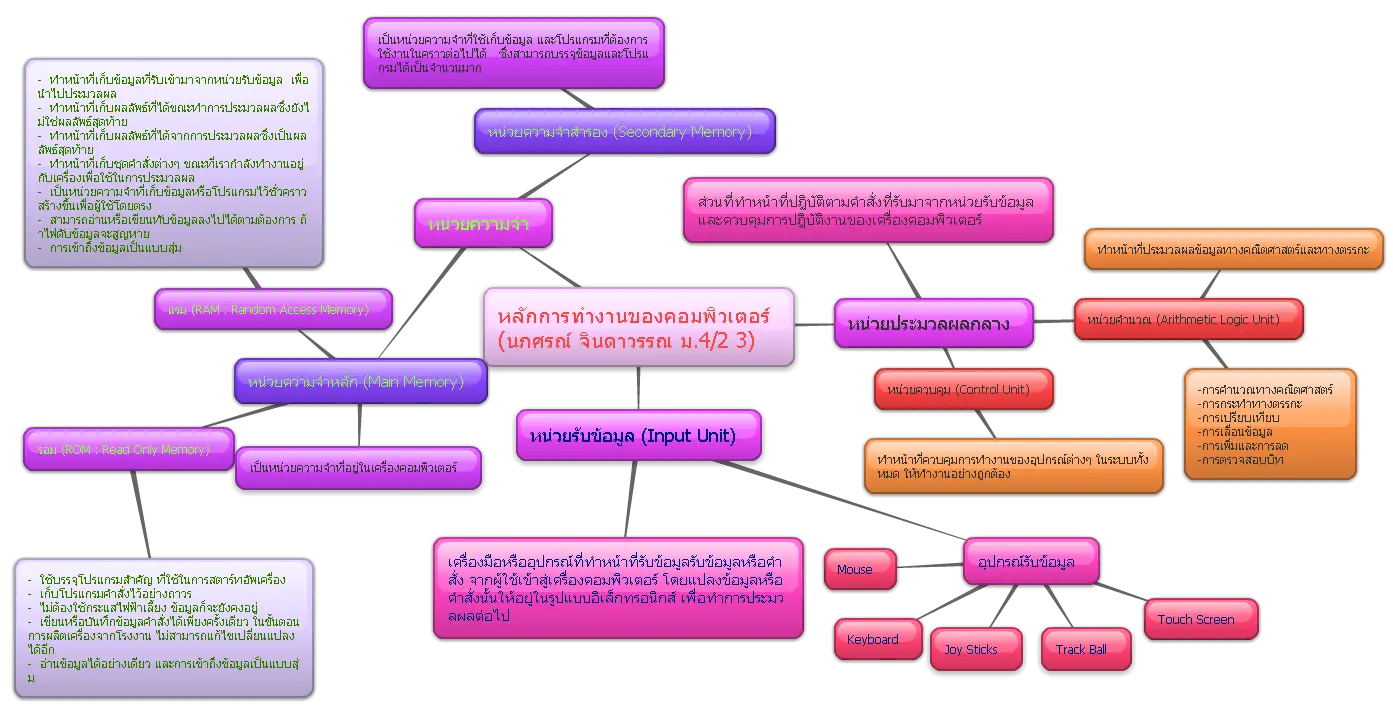
Mind Map Diagram in Colorful Design -

Time Management Concept with Calendar and Stopwatch -
Green Flowchart Diagram -

Clipboard with Checklist for Task Organization -
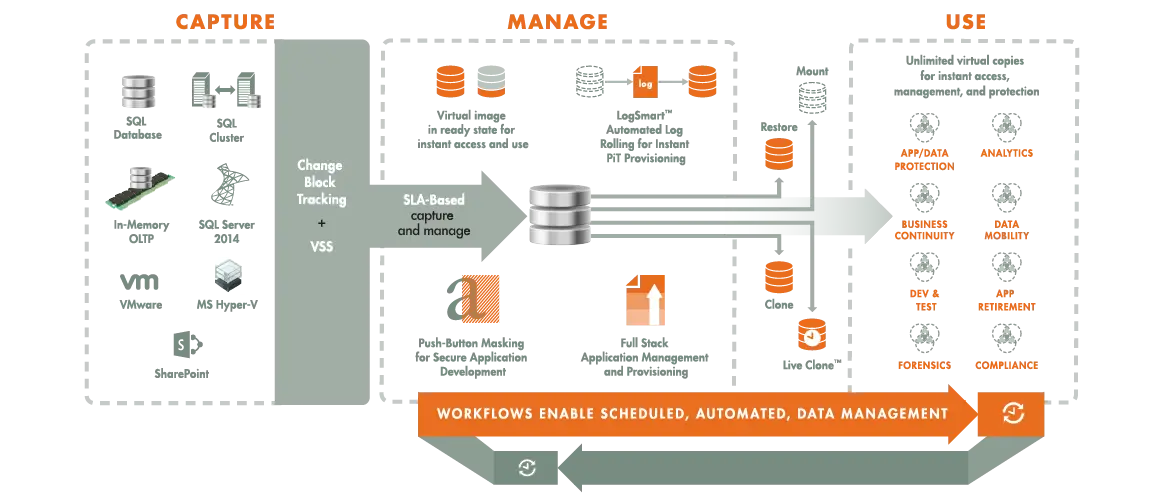
Data Management Workflow Diagram -

Strategy Map with Path and Plan