
You Might Like
-

Organizational Structure Chart -

Zigzag Down Arrow Icon for Decline Representation -

Magnifying Glass with Blue Lens -

Golden Bitcoin Cryptocurrency Coin -

Market Stall Icon -

Bar Chart with Upward Arrow -

Graph Plot with Blue Curve Illustration -

Cartoon Vegetable Stand with Shopper -
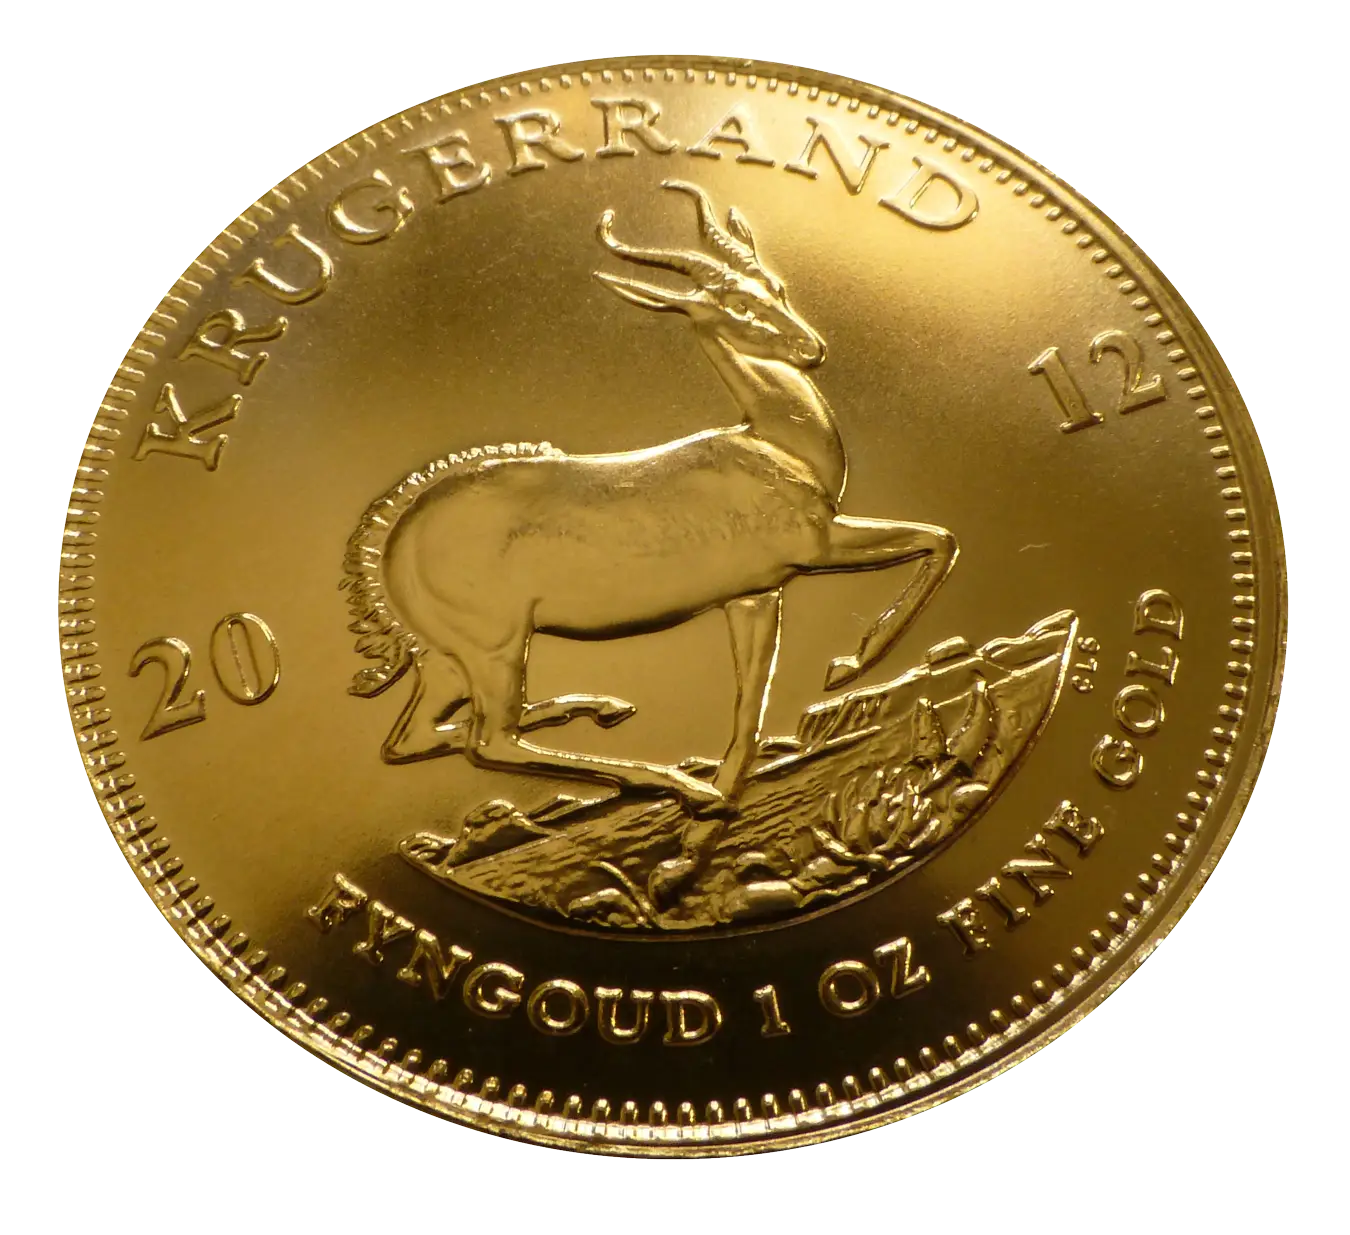
Gold Krugerrand Coin -
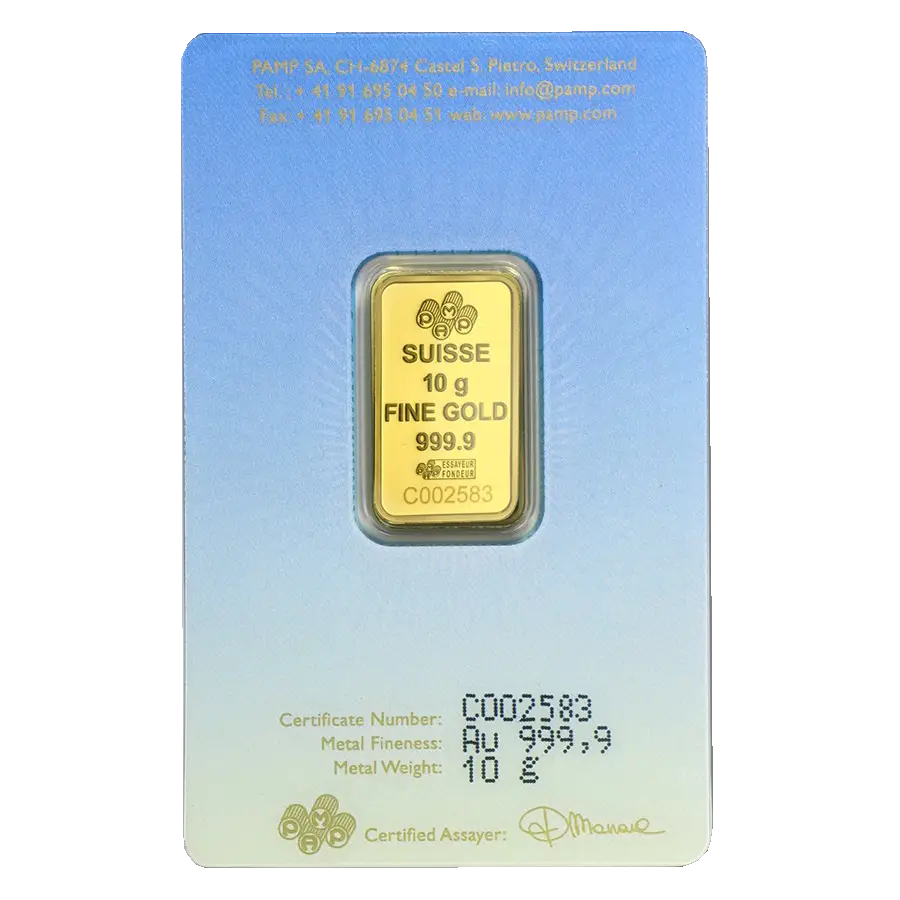
10g Suisse Fine Gold Bar -
Money Bag with Downward Arrows Illustration -

Person Icon with Dollar Sign -

Circle Pie Chart Icon -

Bull Market Symbol -

House with Dollar Sign Symbol -

Book Icon with Blue Background -

Pie Chart Representation -

Cartoon Businessman Holding Bitcoin -

Magnifying Glass on Document Icon -
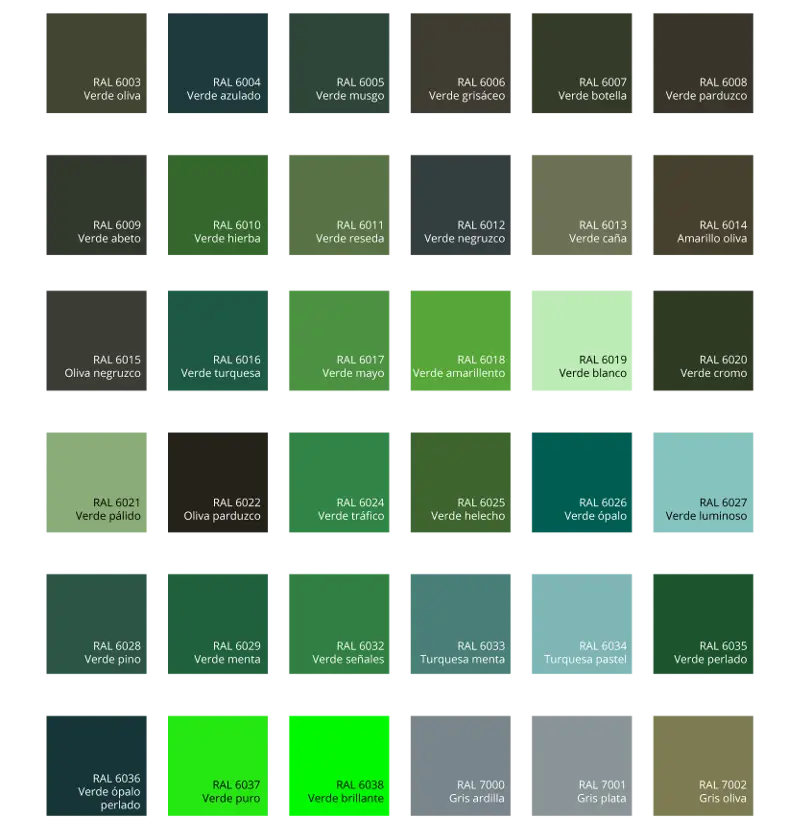
Green Color Palette Chart -

Clipboard Illustration with Financial Chart for Data Analysis -

Stack of Dollar Coins -

Man Holding Large Coin with Stack of Coins -

Piggy Bank with Gold Coins Illustration -
Green Money Tree Illustration Representing Wealth Growth -

Green Flowchart Diagram -
Gold Coins for Wealth and Prosperity -

Black House Symbol with Dollar Sign for Real Estate -

Money Bag Surrounded by Coins and Cash -

Colorful Bar Graph Illustration