
You Might Like
-
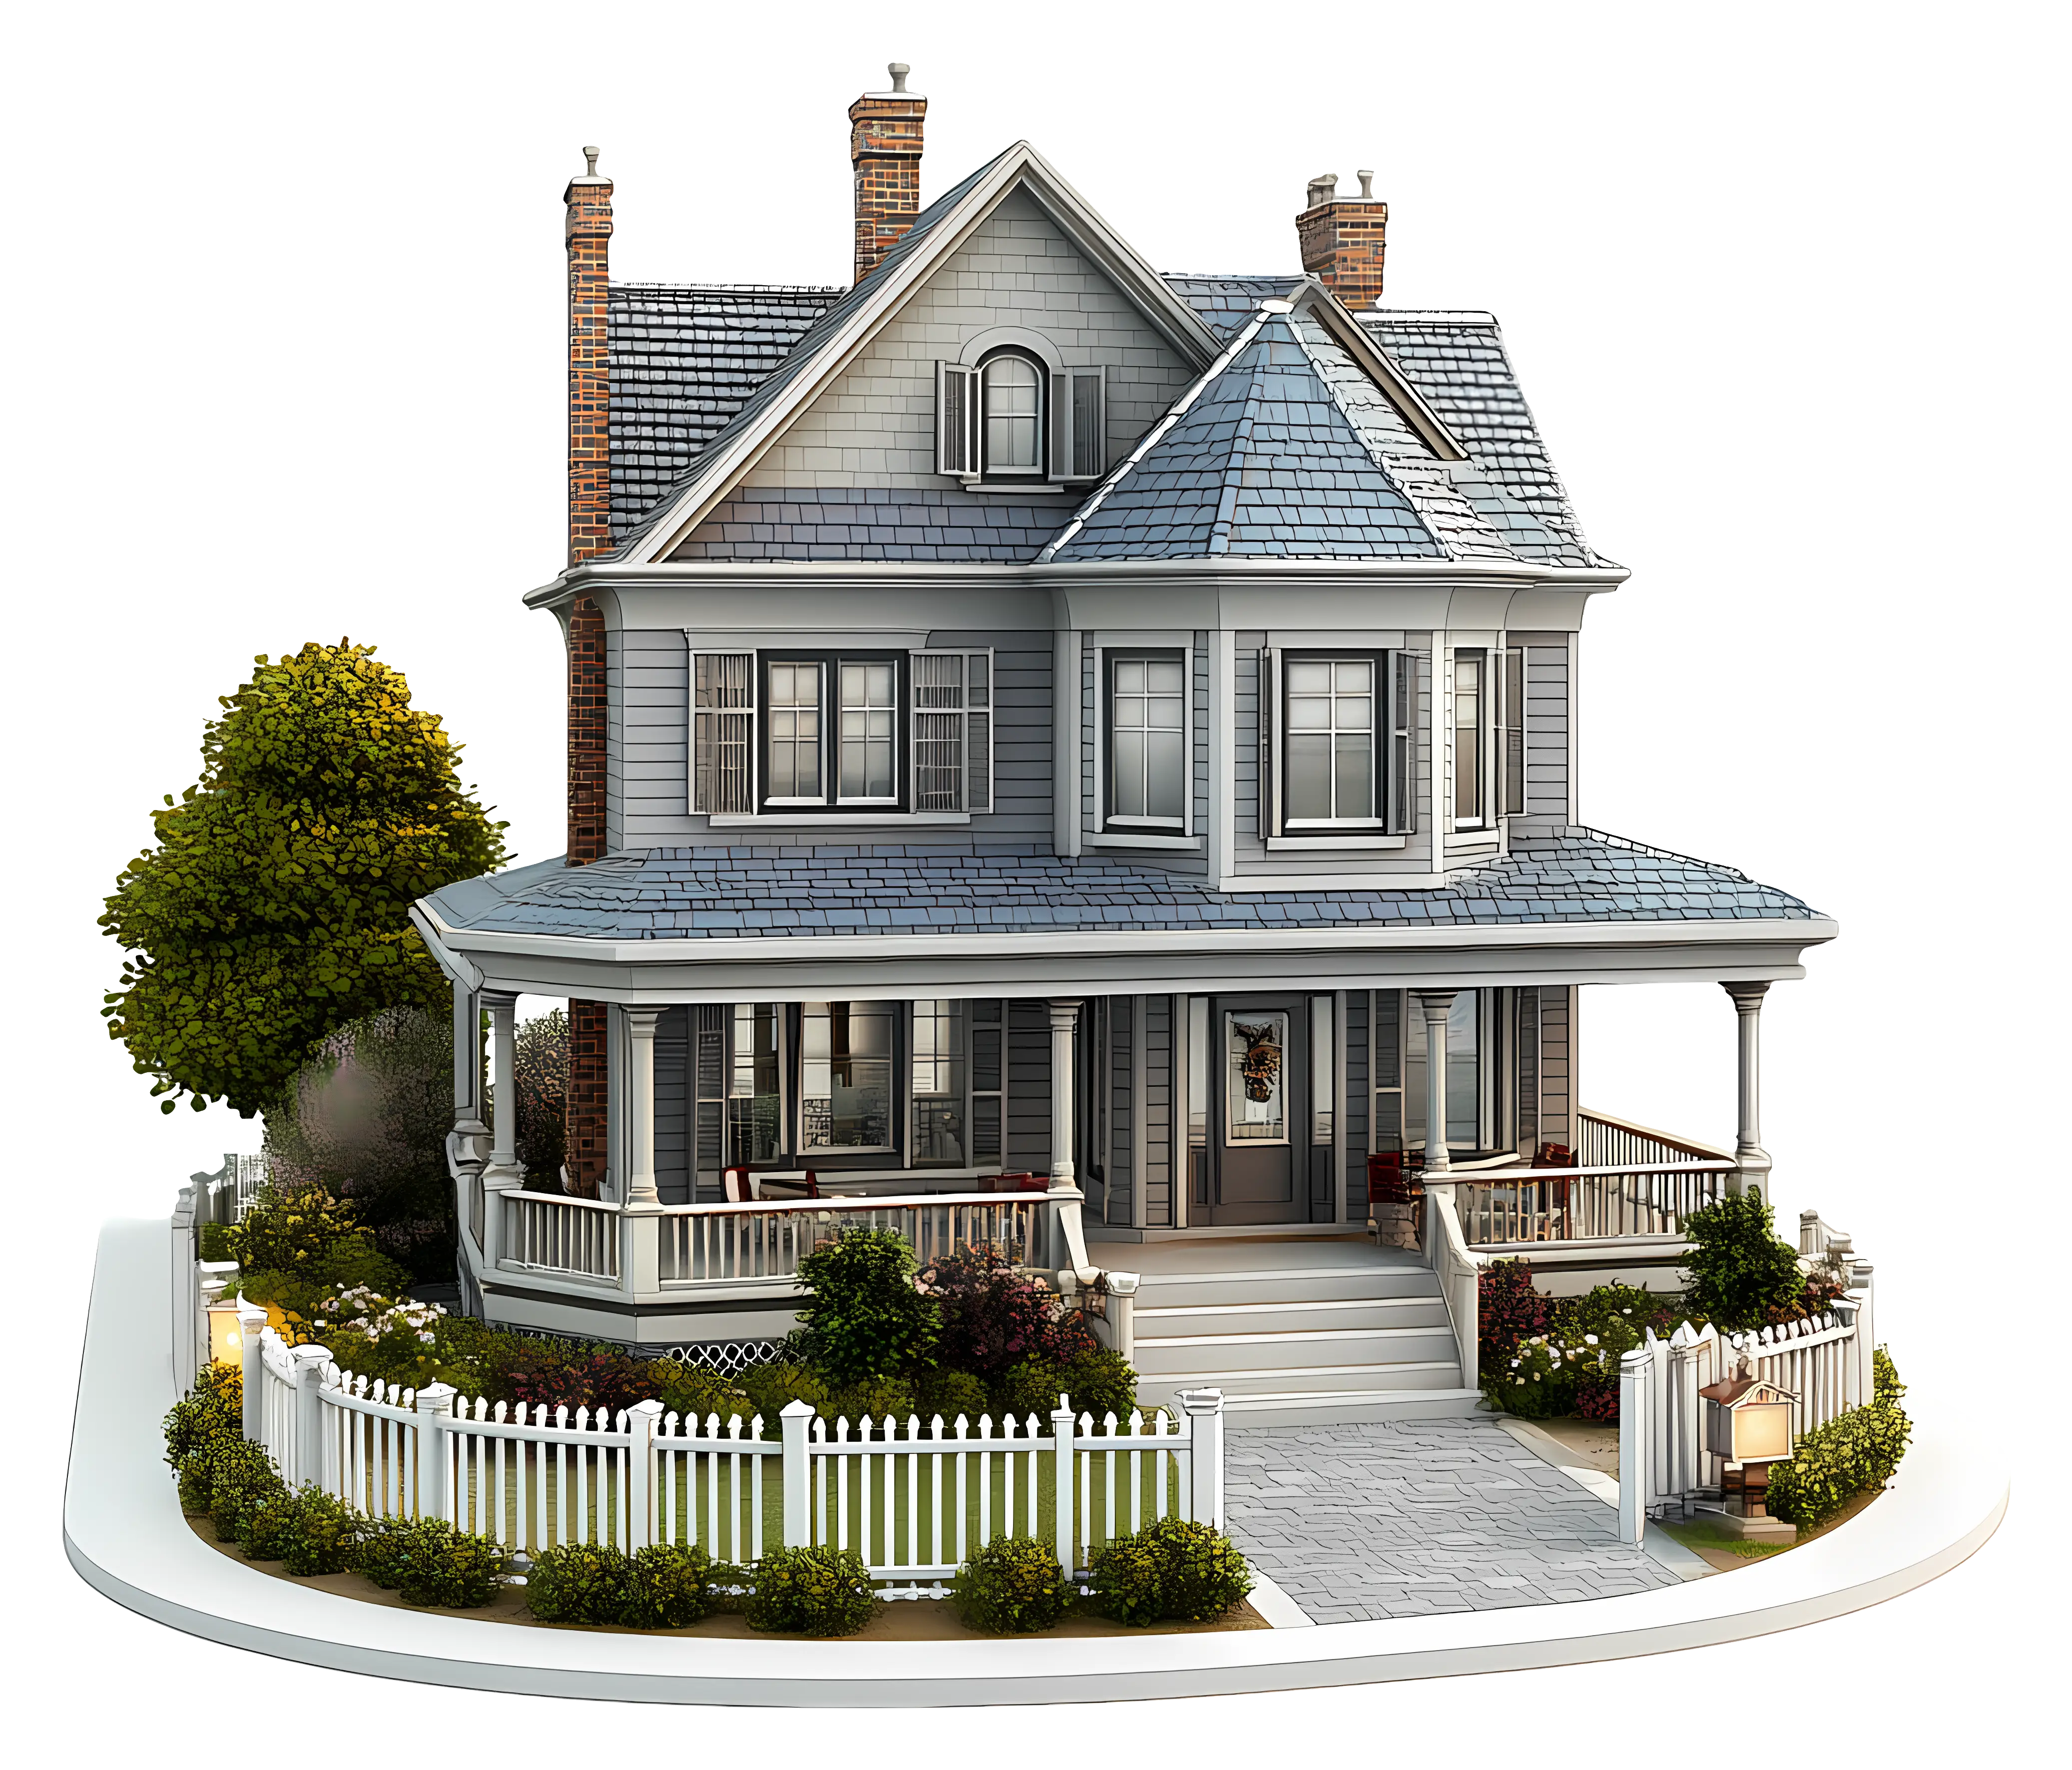
Charming House with Garden Illustration -
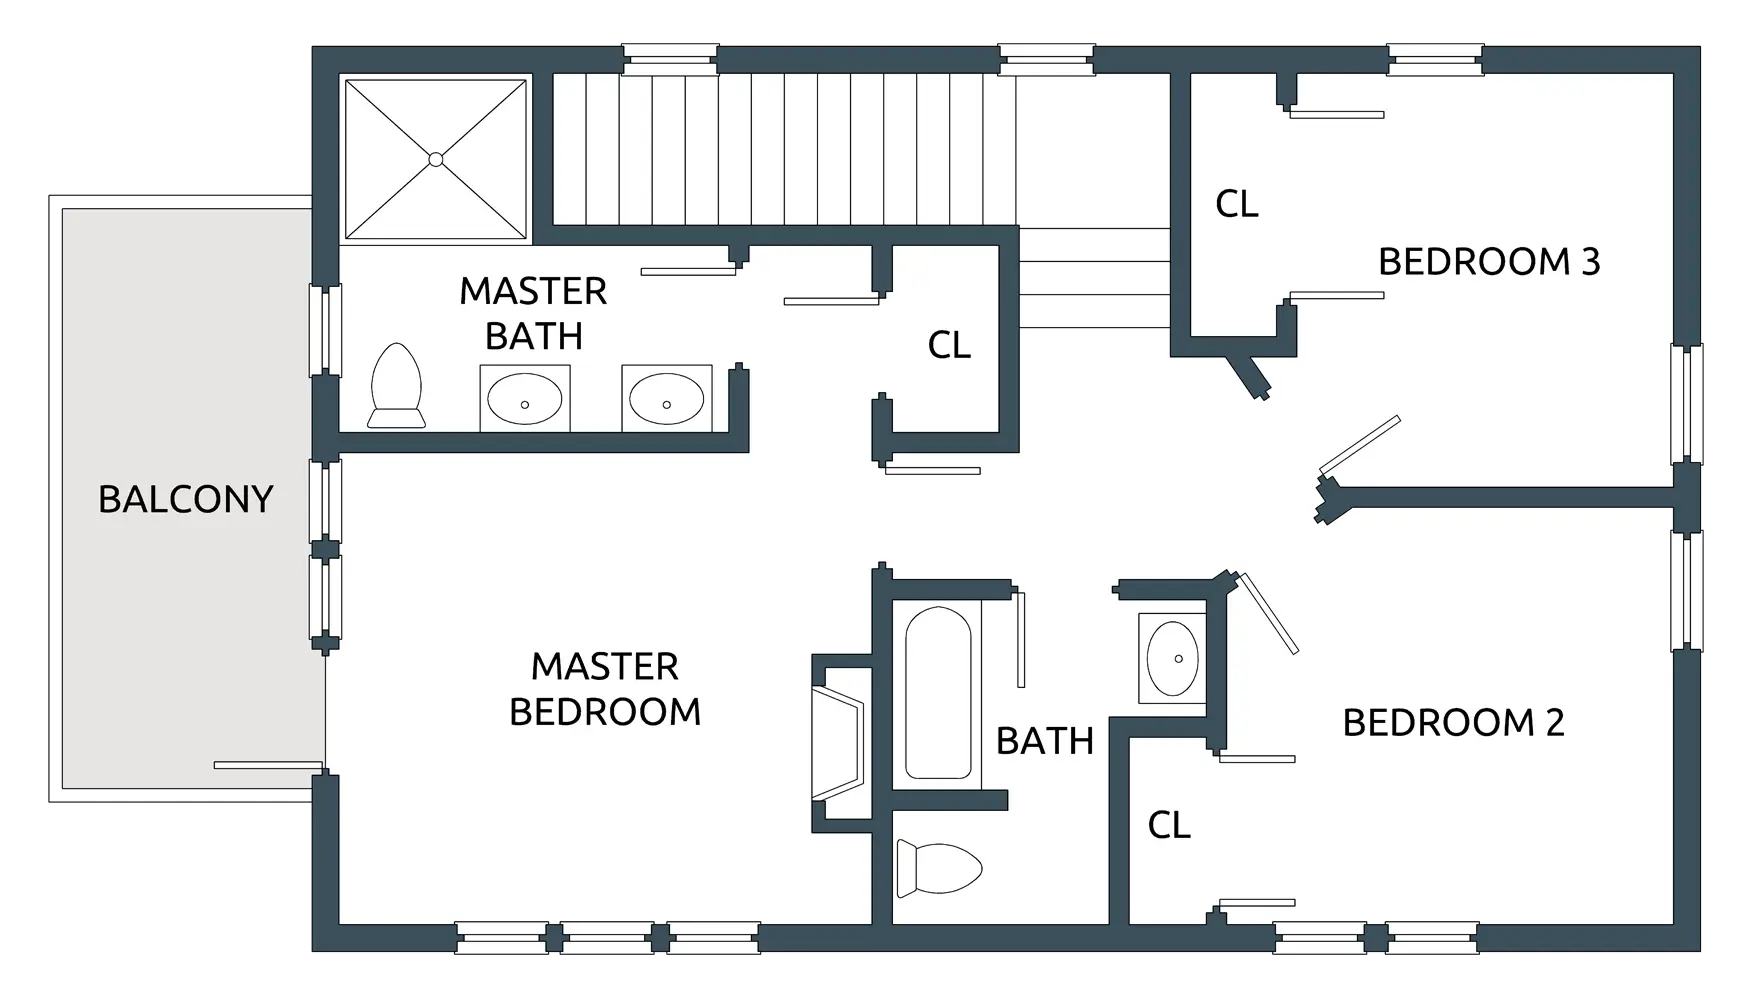
House Floor Plan with Three Bedrooms -

Beautiful Nature Scene with Lake and Forest -

Traditional House with Lanterns -

Team with Growth Graph Illustration -

Simple Black House Icon with Chimney -

Business Strategy Icons -

Vivid Marine Life in Underwater Illustration -

Computer Tower with Phone Icon -
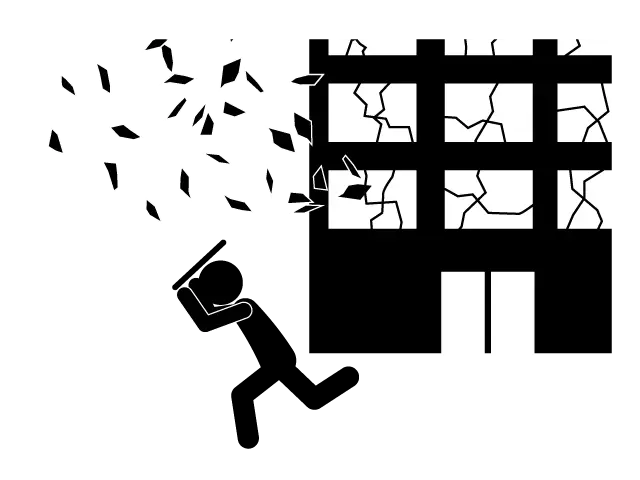
Collapsing Building with Debris and Running Person -

City Skyline Silhouette Art -
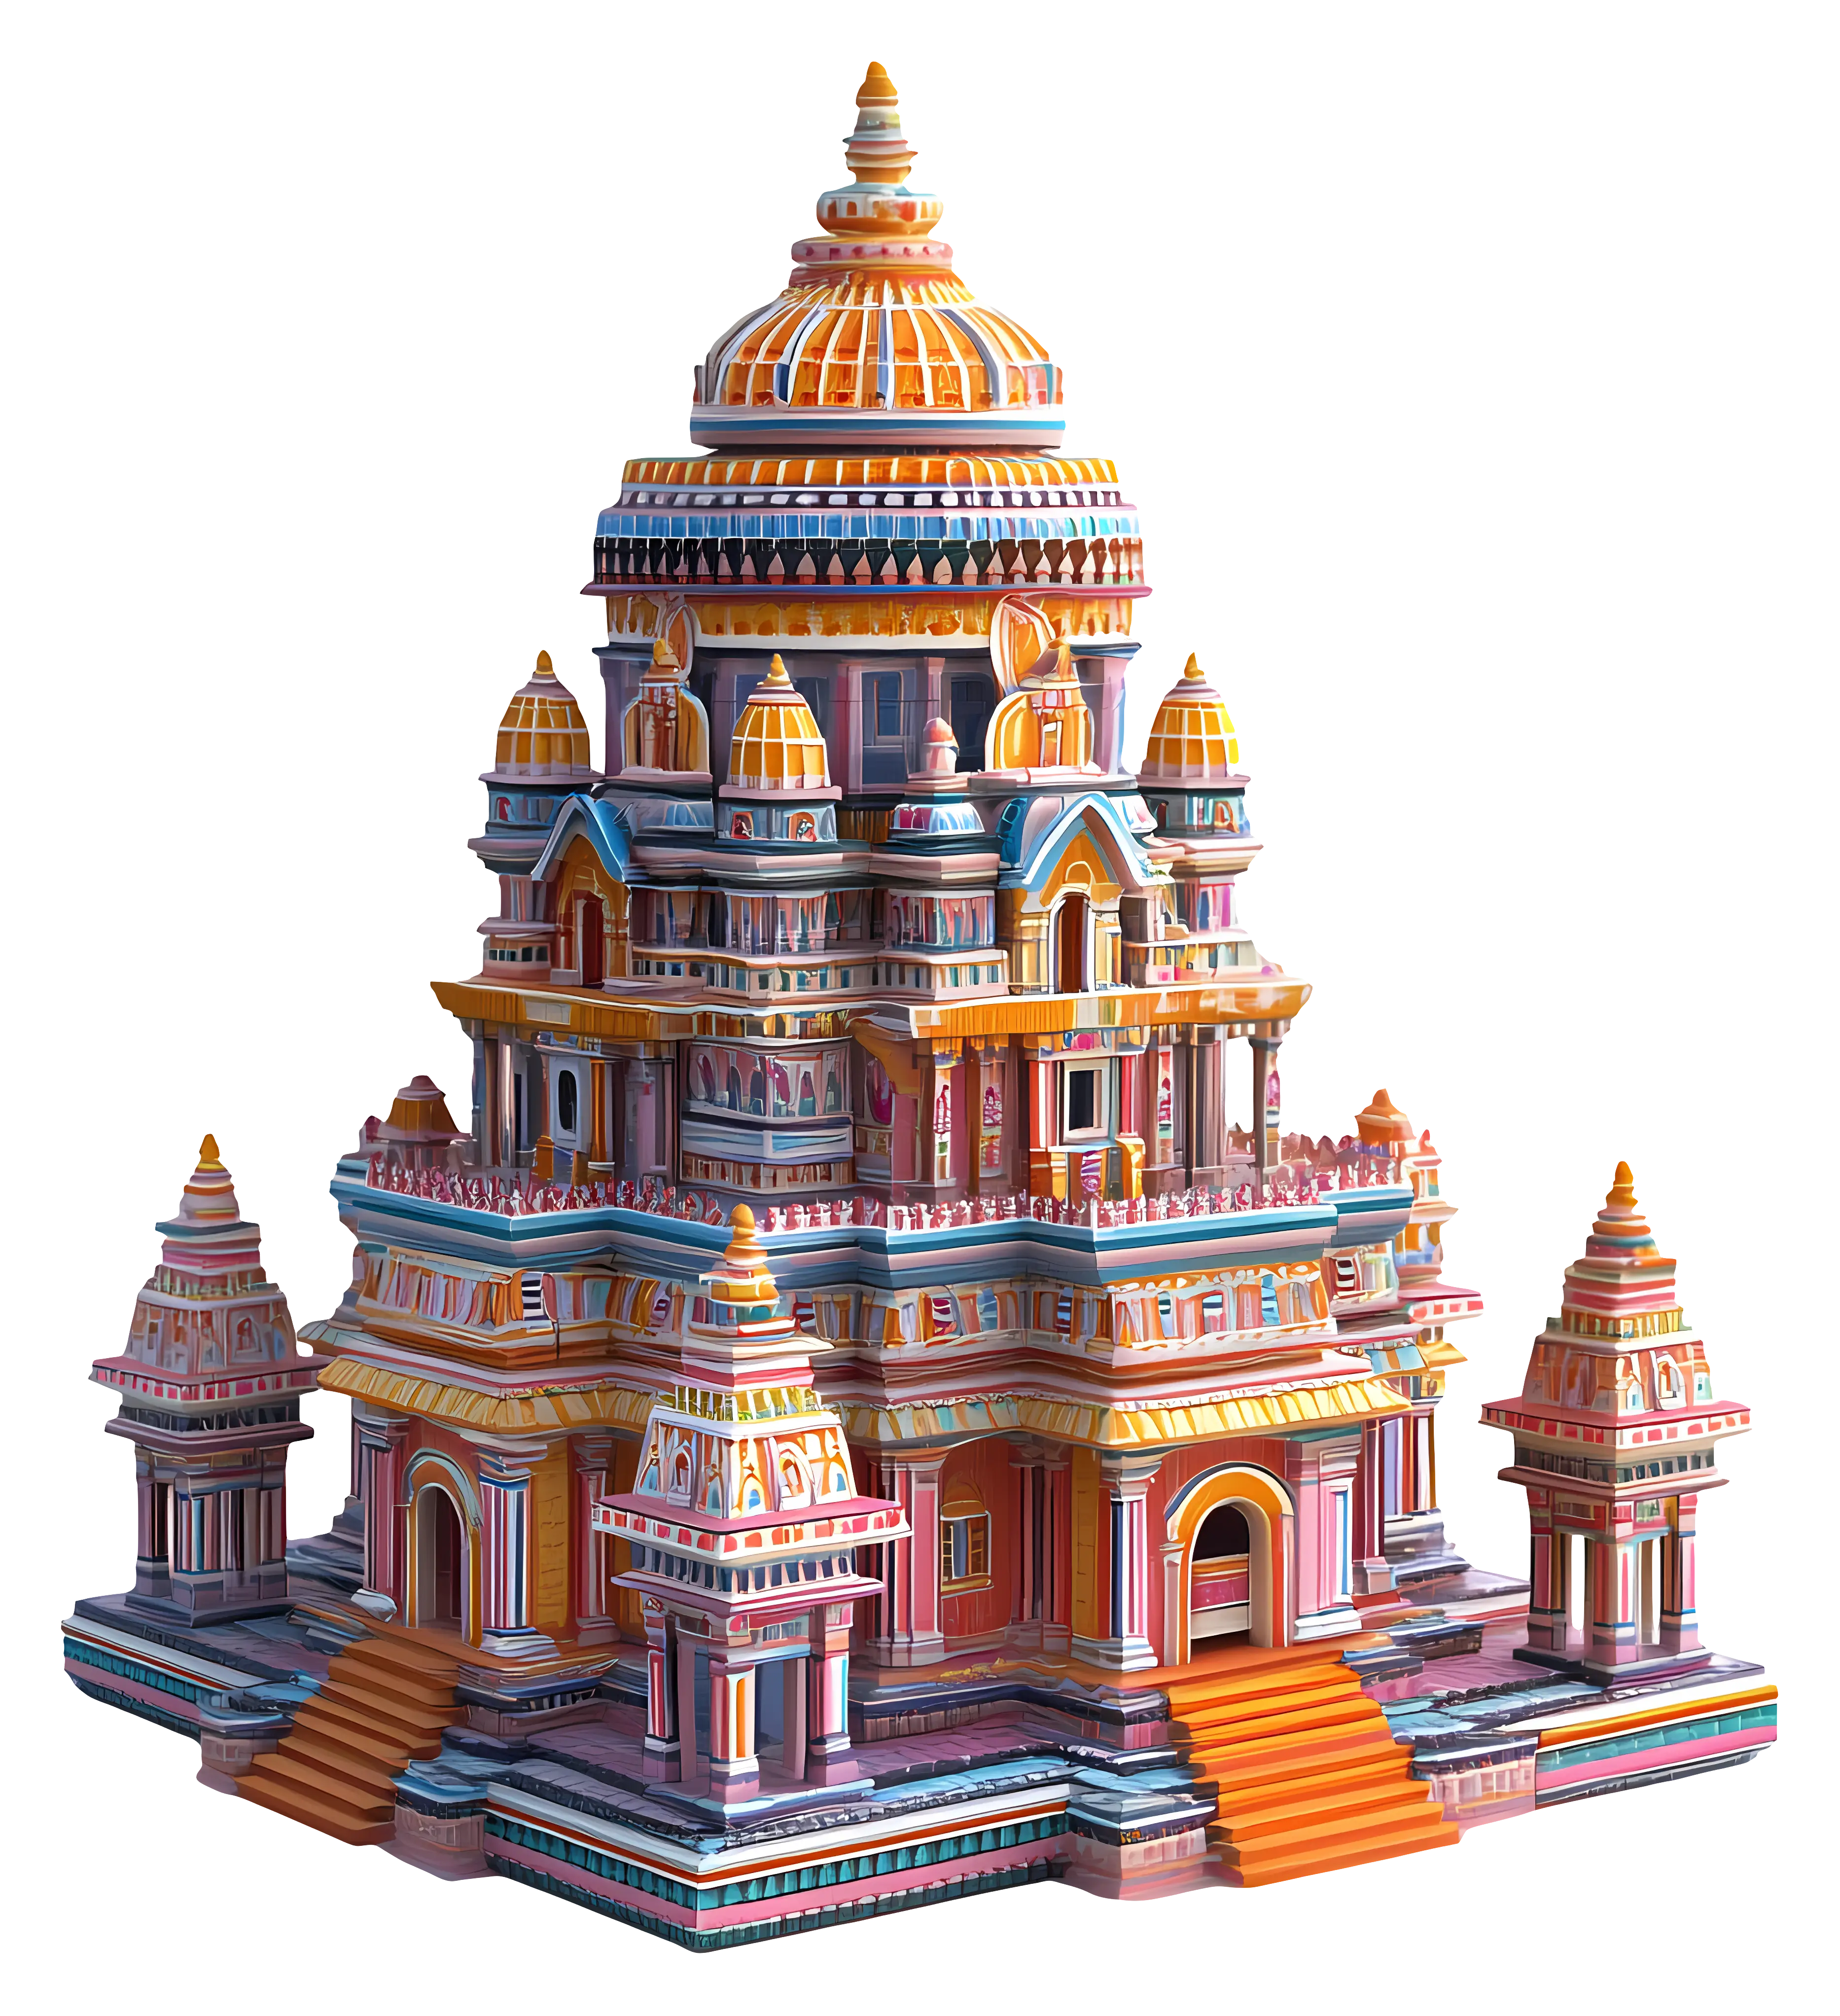
Colorful Heritage Temple -

Various Devices Displaying Software -

Icon of KPI Dashboard with Graph and Person -
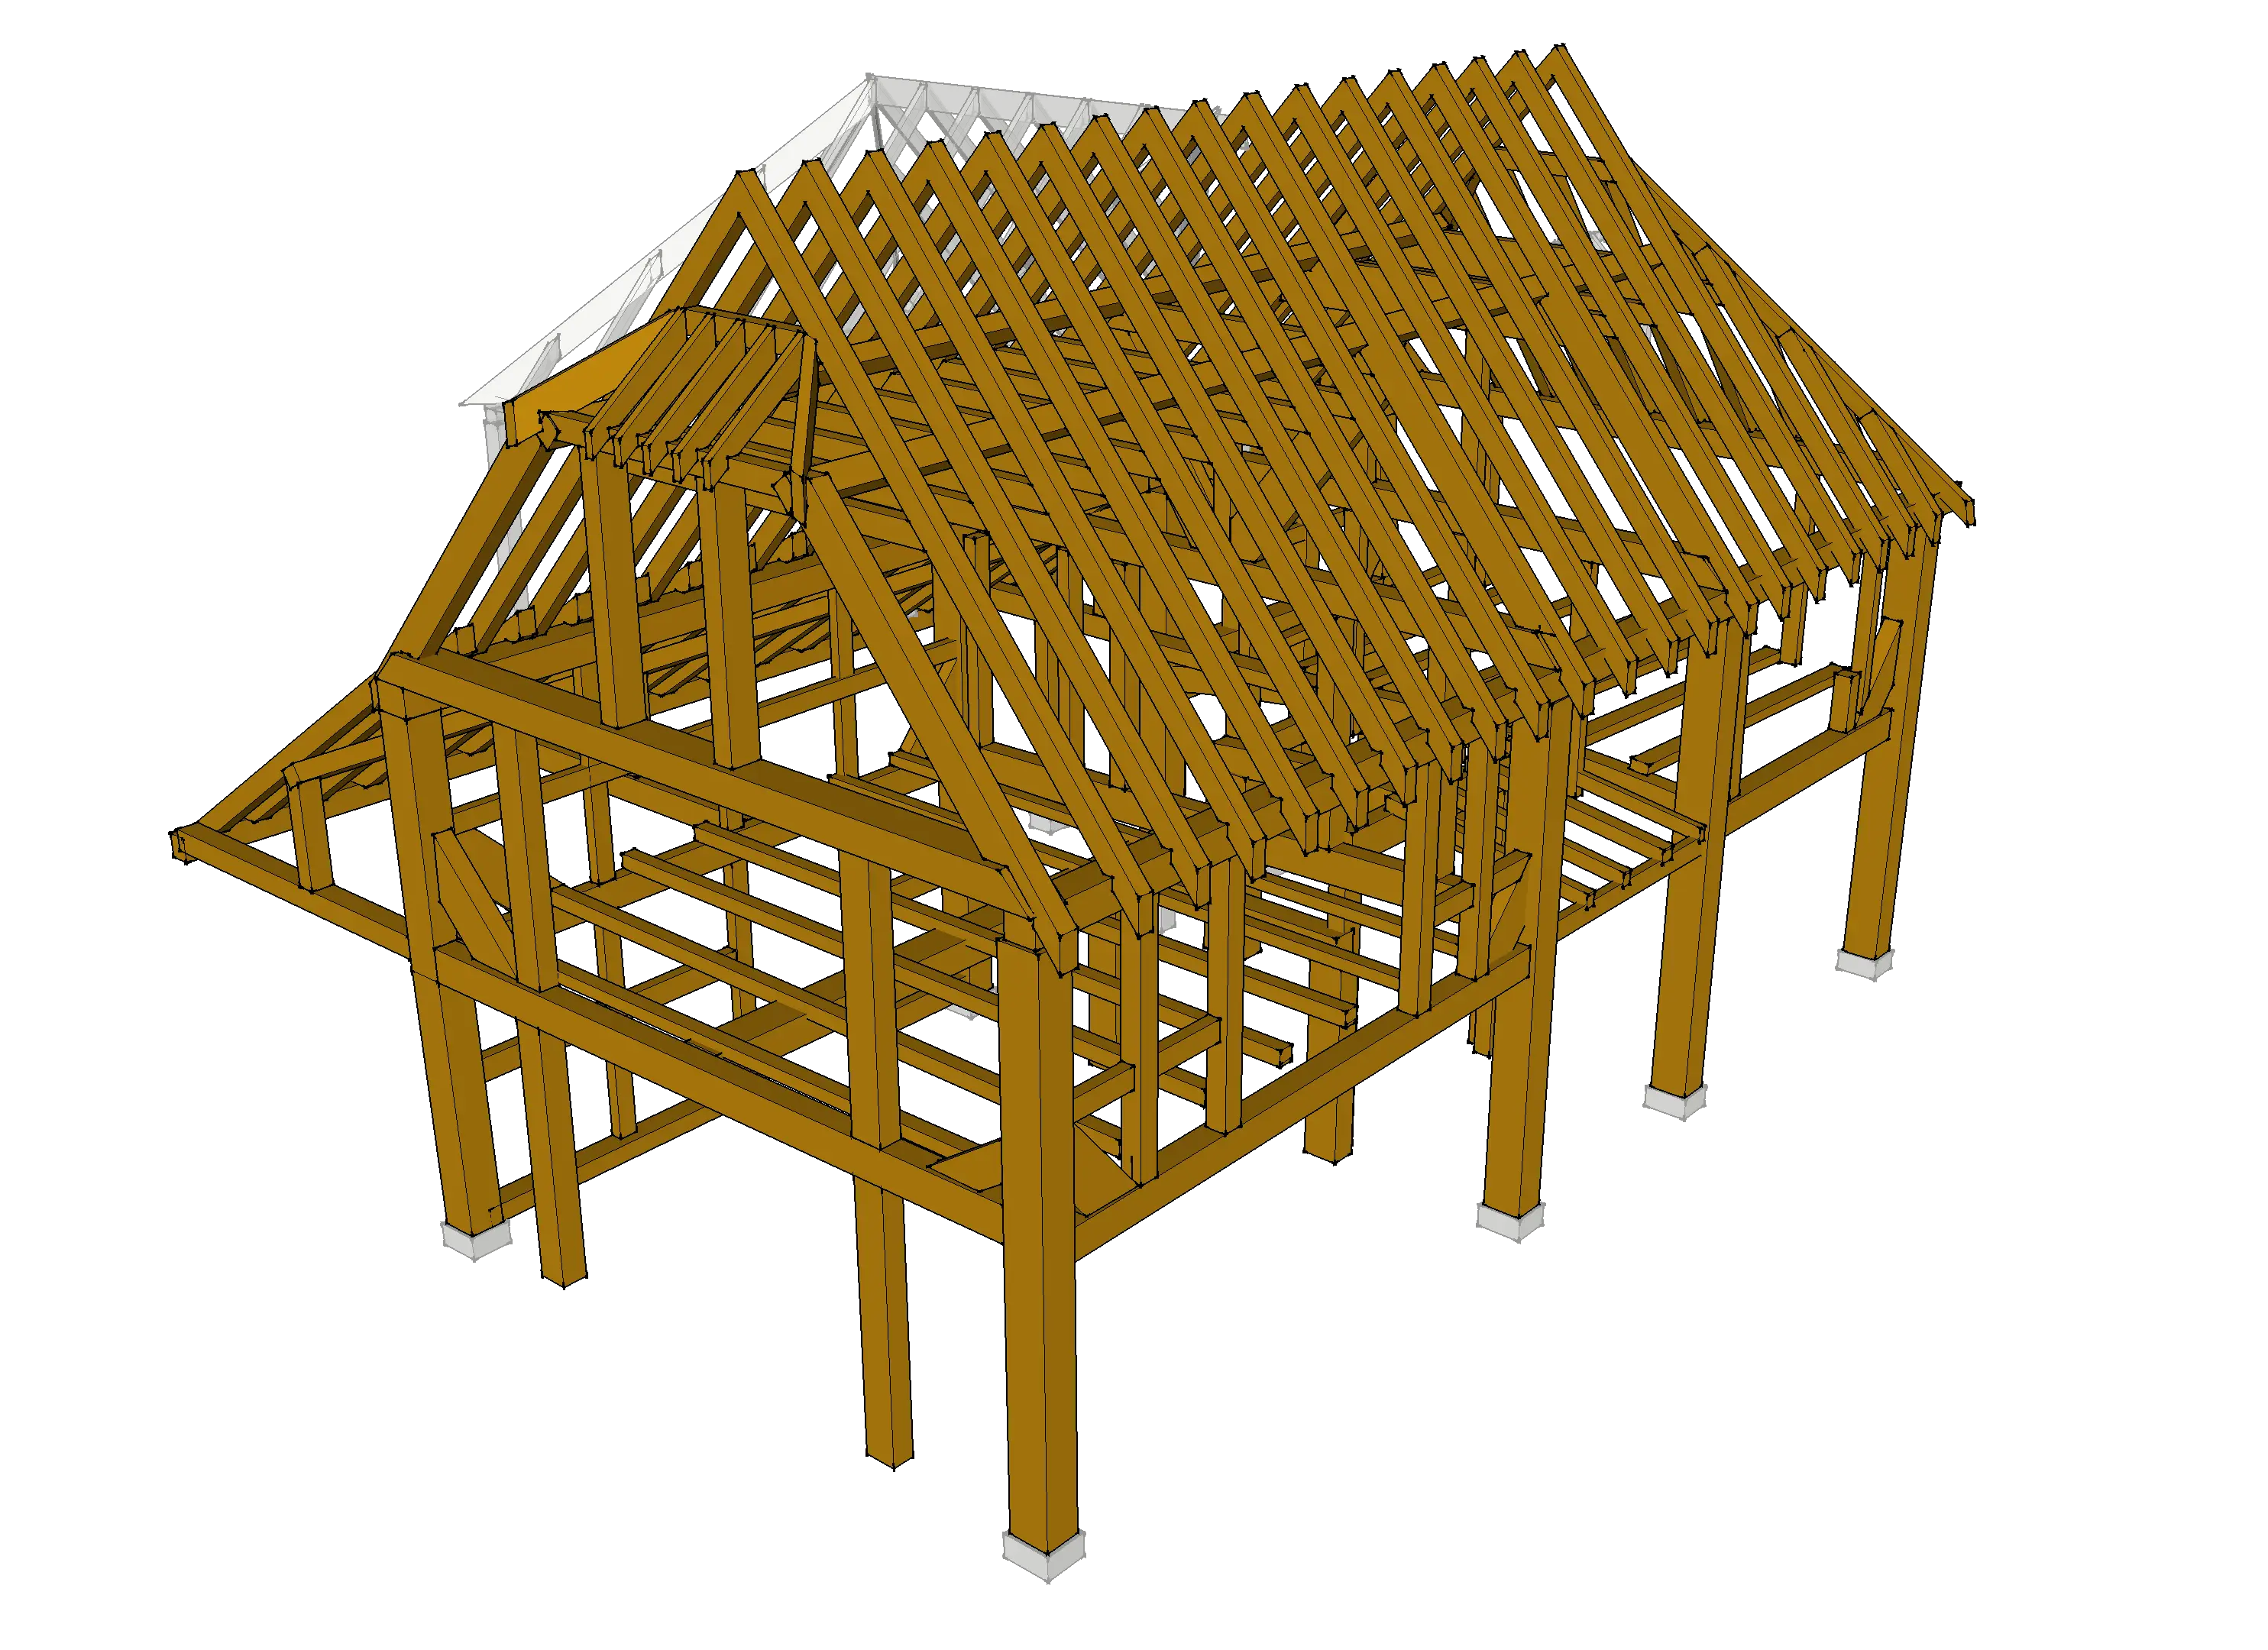
Wooden House Frame for Construction -

Colorful Mosque Illustration for Eid Celebration -

Modern Blue Skyscraper Icon -
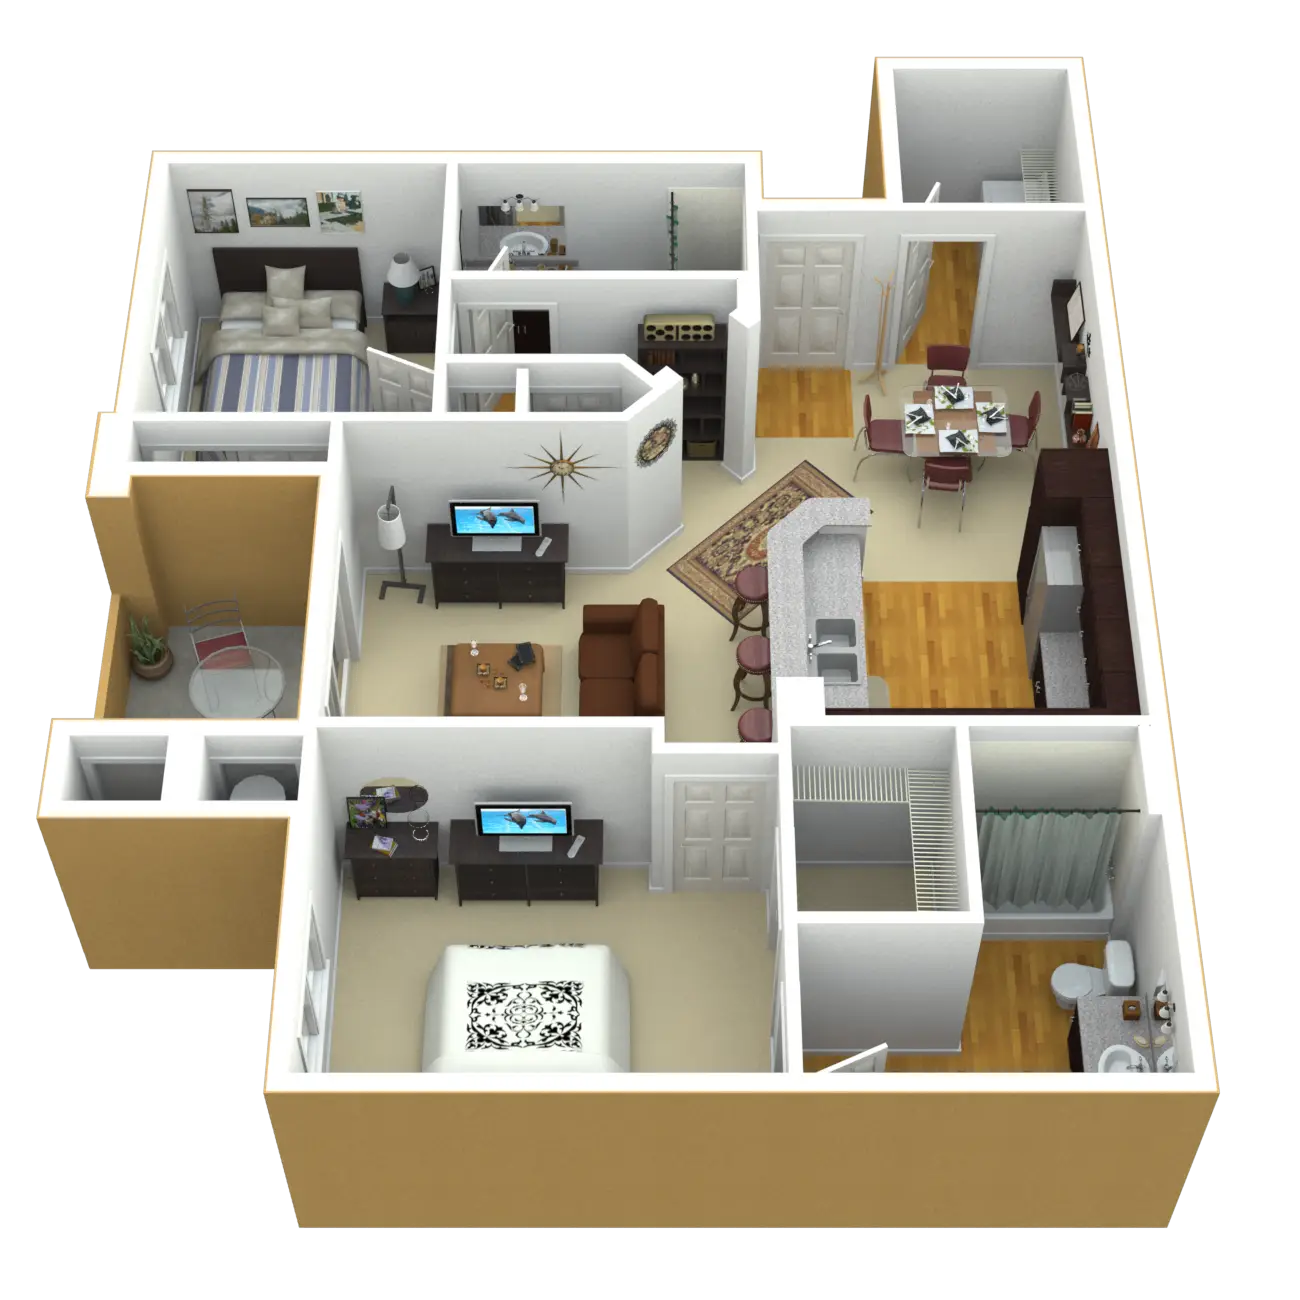
3D Apartment Layout Design -
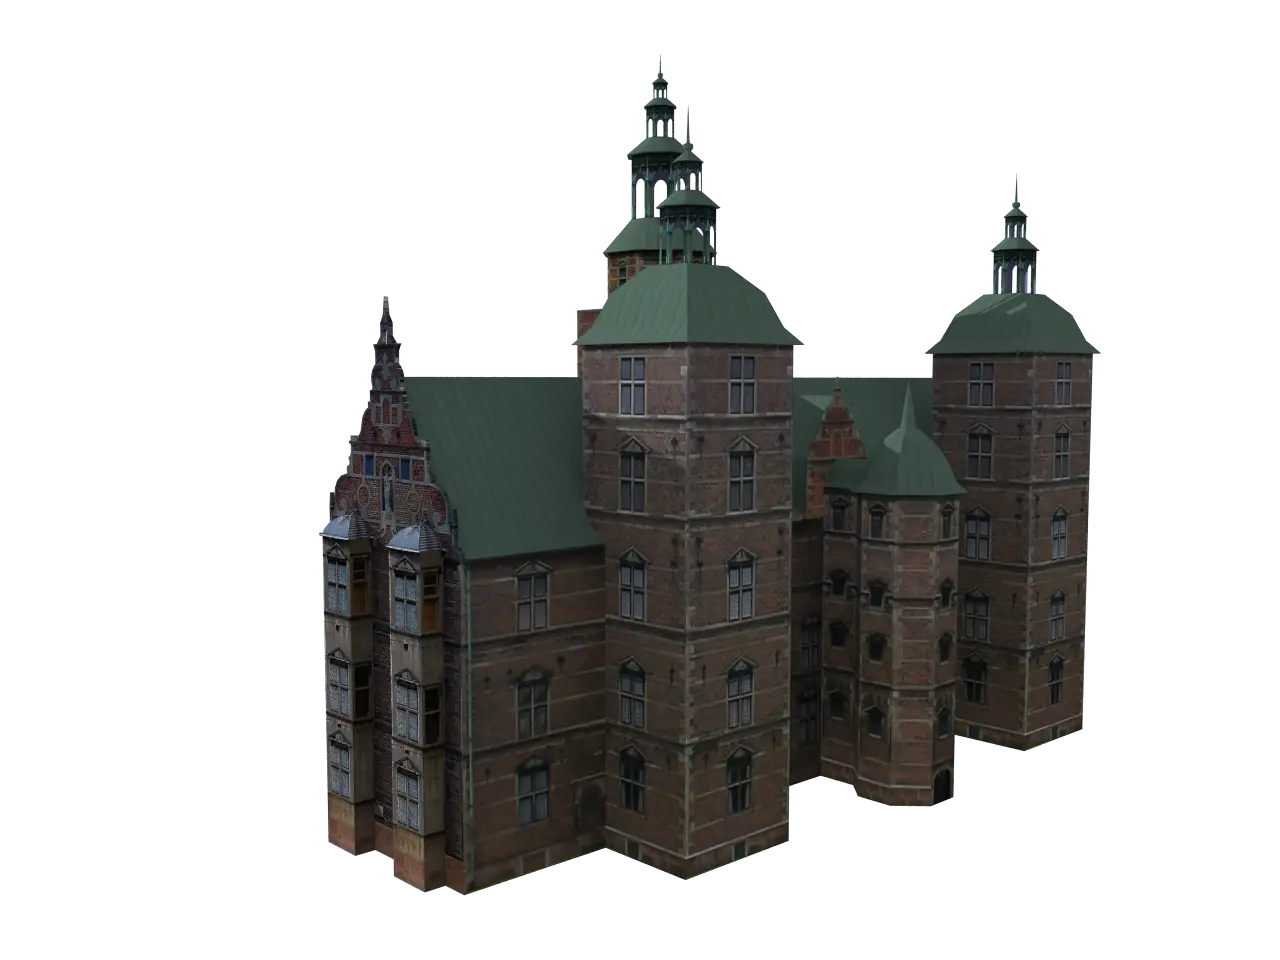
Model of a Historical Castle -

Simple Nuclear Power Plant Icon -

Black Fire Hydrant Silhouette -

Geometric White Cloud Icon -

Zigzag Down Arrow Icon for Decline Representation -

Presentation Board with Graph for Business Concepts -

School Building with Clock on Facade -

Yellow Ethernet Cable for Network Connections -

Hand Using Black Computer Mouse -

Bar Chart with Upward Arrow -
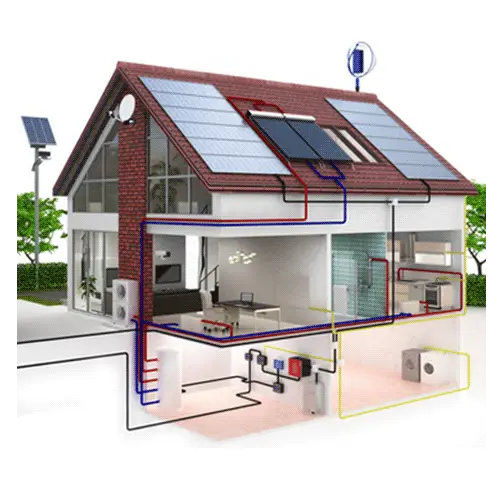
Energy Efficient House with Solar Panels -
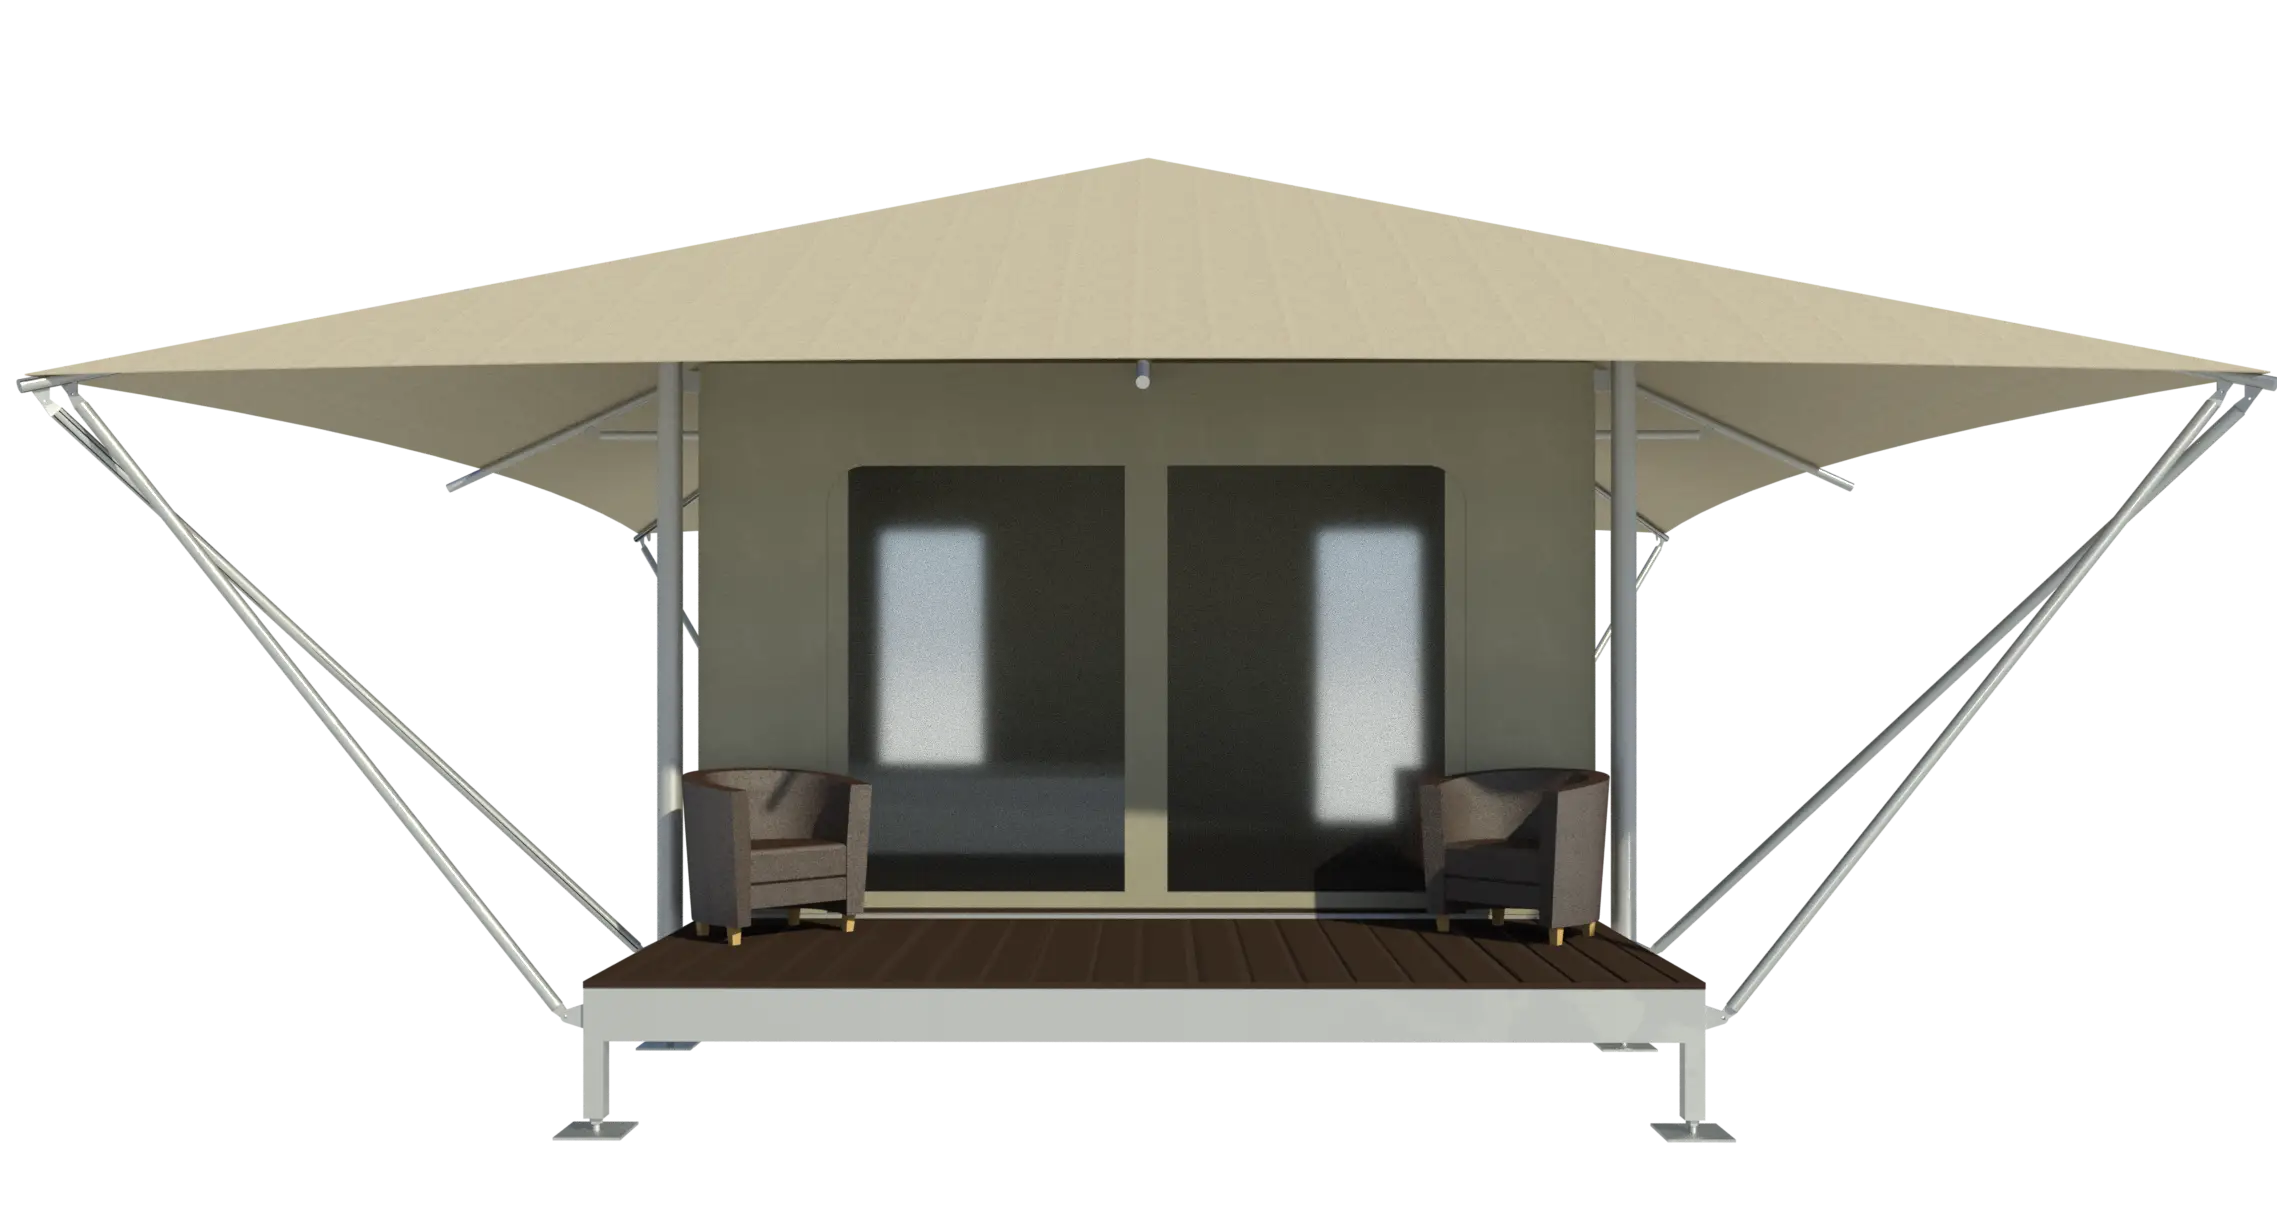
Modern Tent House Design