You Might Like
-
Windows Logo on Blue Background -
Circular Wreath of Vibrant Autumn Leaves -

Blue Microsoft Edge Logo -

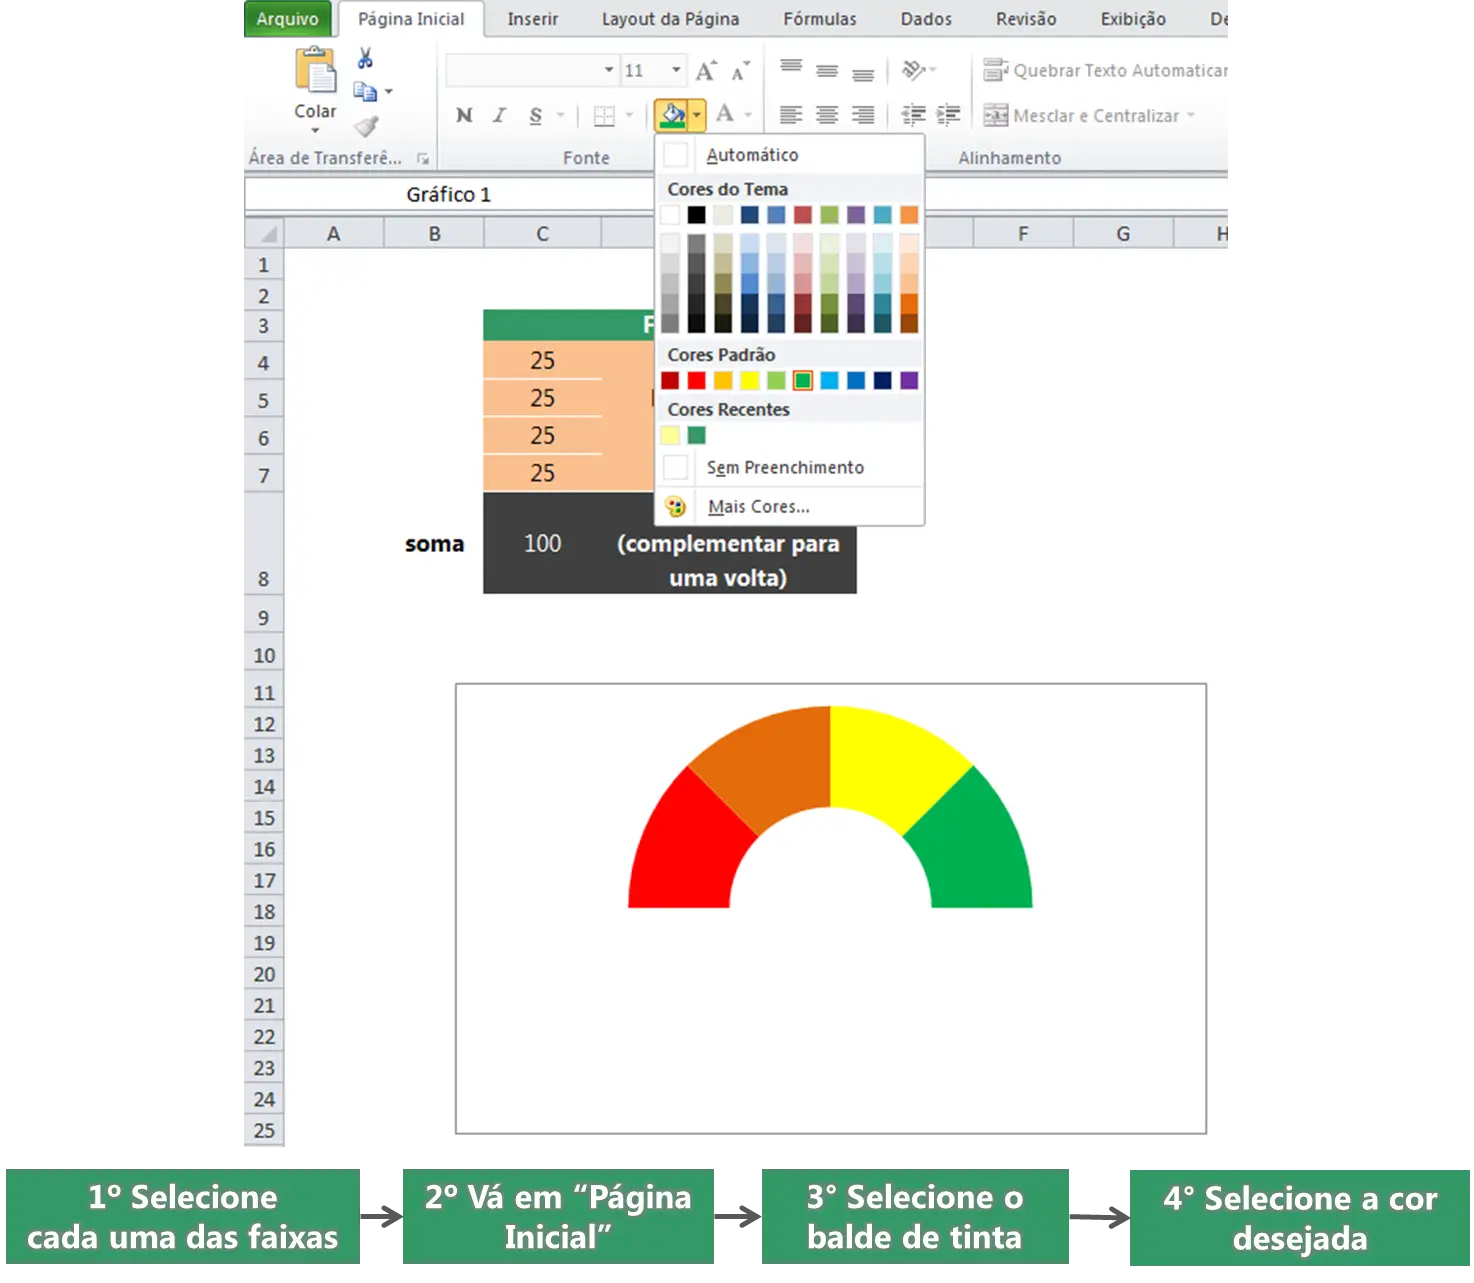
Organizational Structure Chart -
Panama National Flag -
Love Yarn Day text made of yarn -

Paint Splash Fun -
Stack of Colorful Plates -
Kenya National Flag -

Colorful Holi Festival Celebration -

Bar Chart with Upward Arrow -
Wicker Basket Filled with Fresh Fruits and Vegetables -
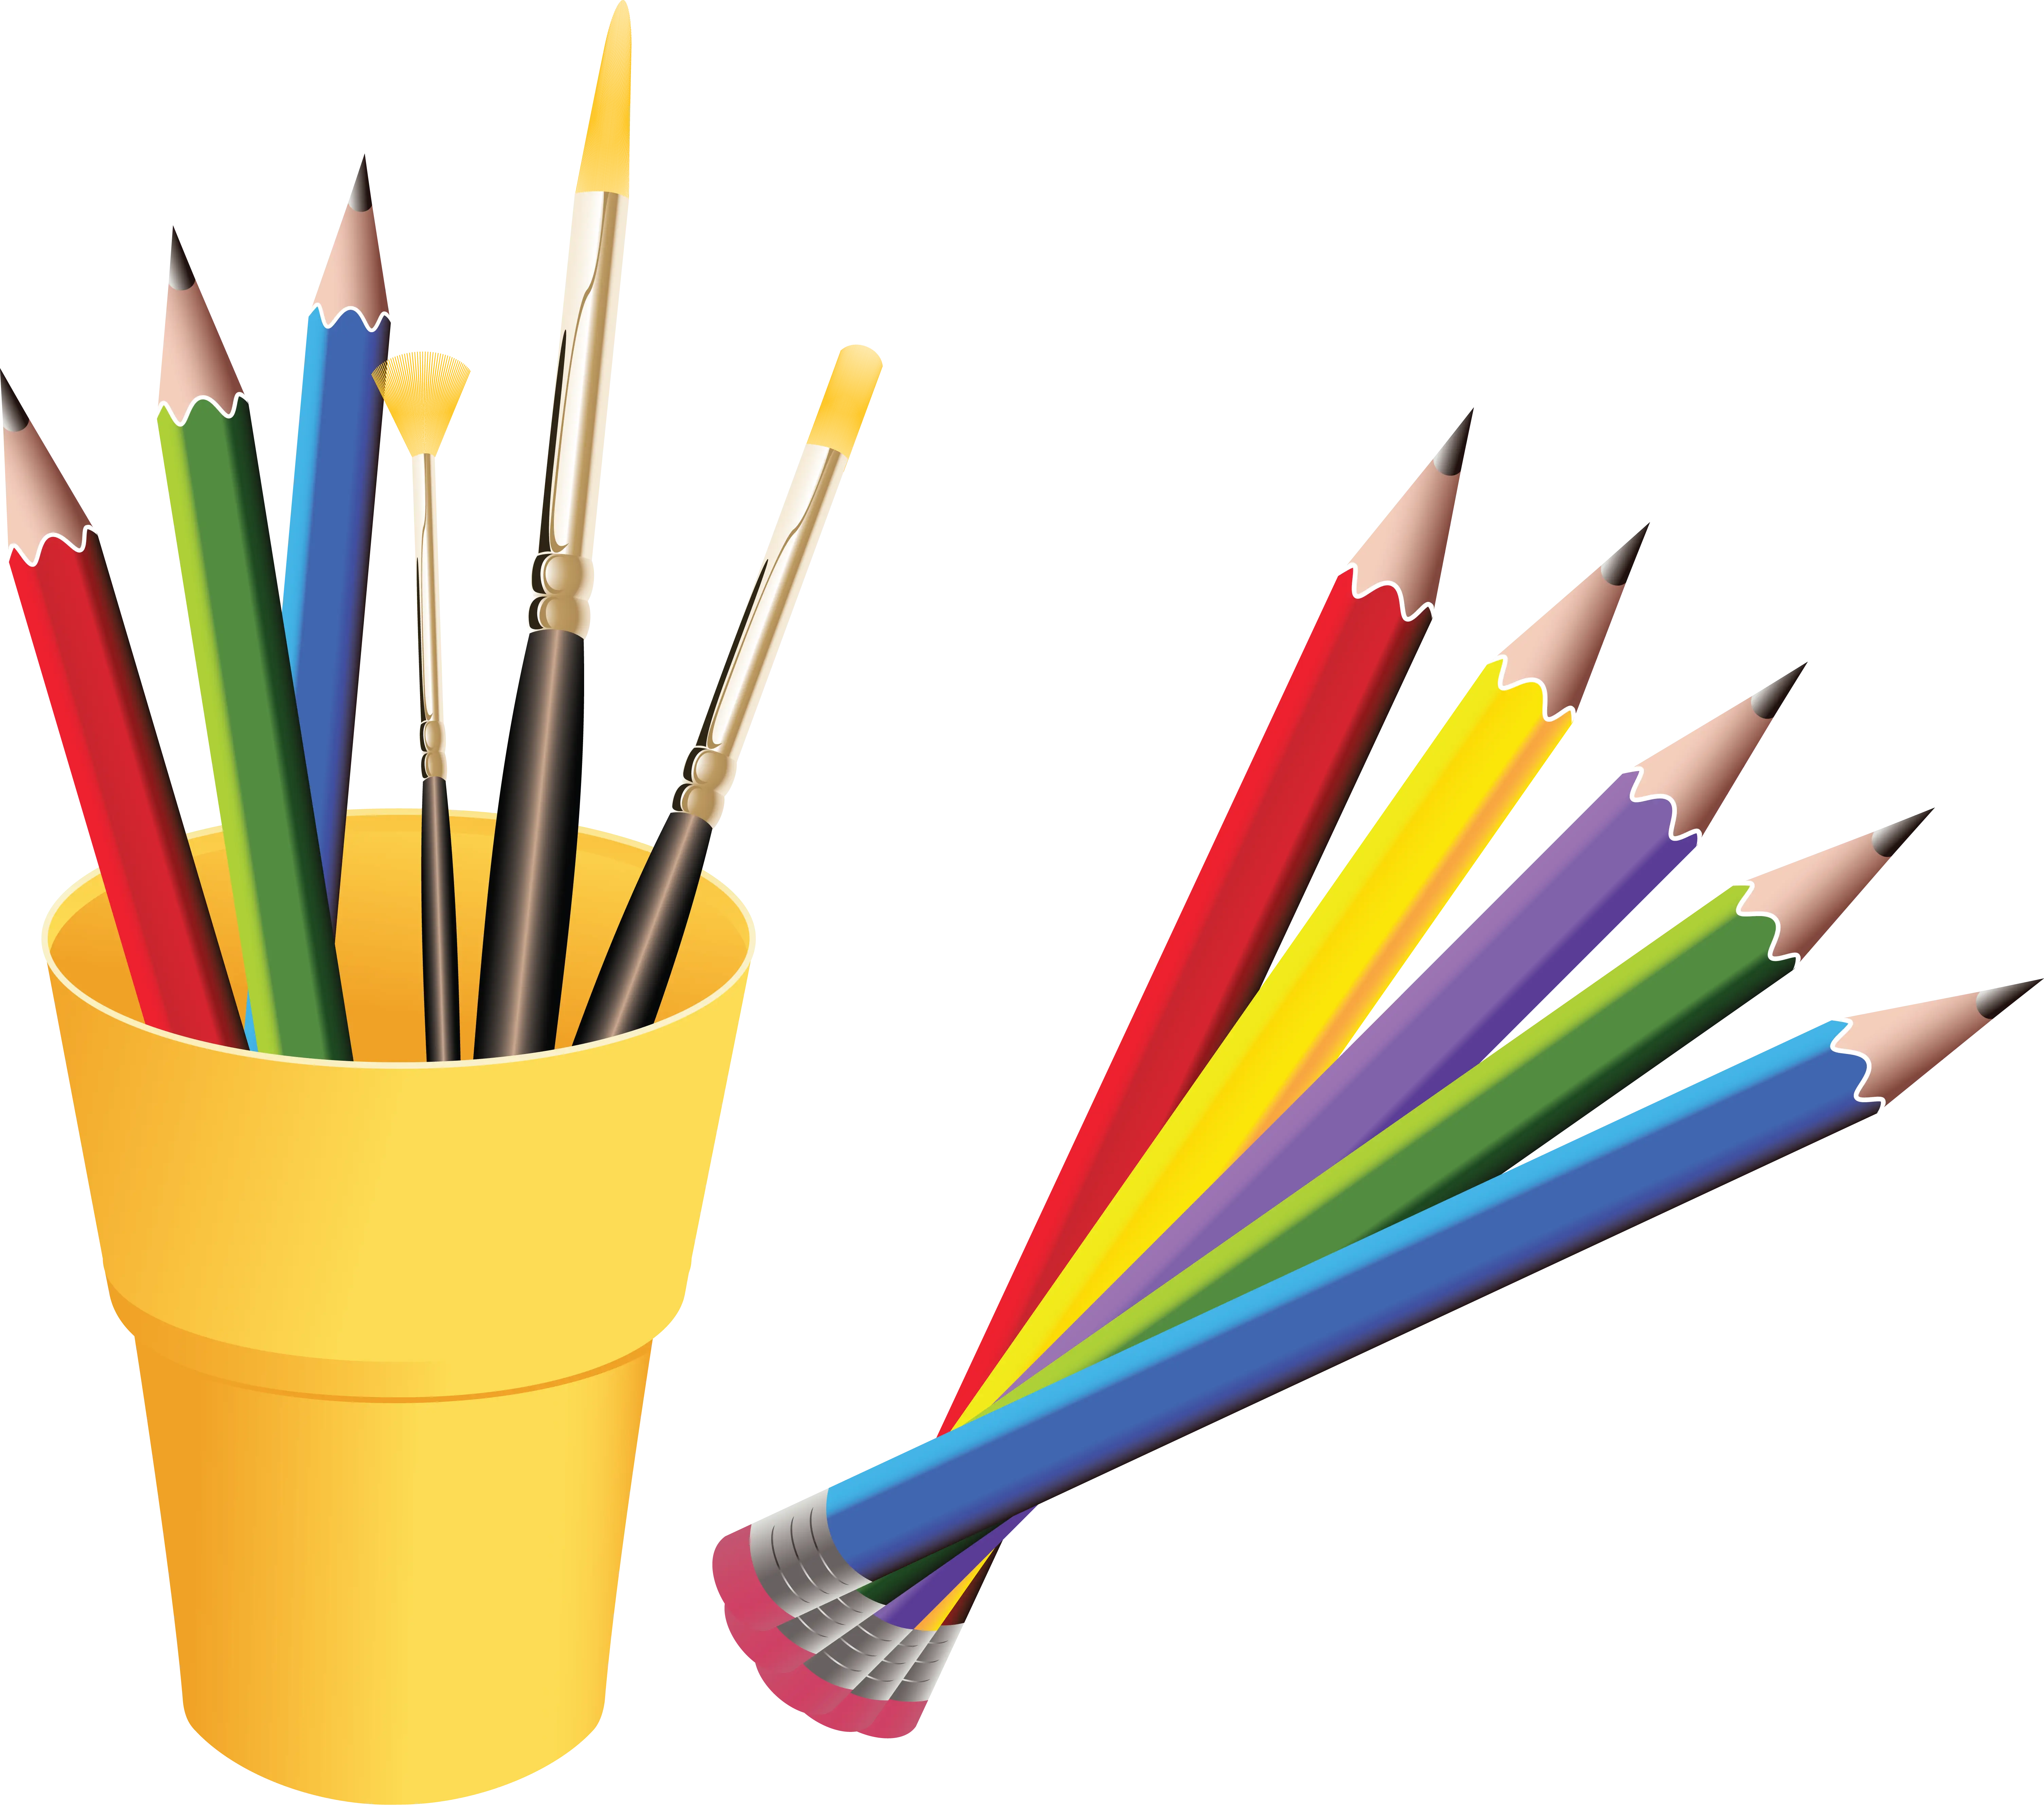
Colorful Art Supplies Illustration -
It's More Fun in the Philippines Logo -
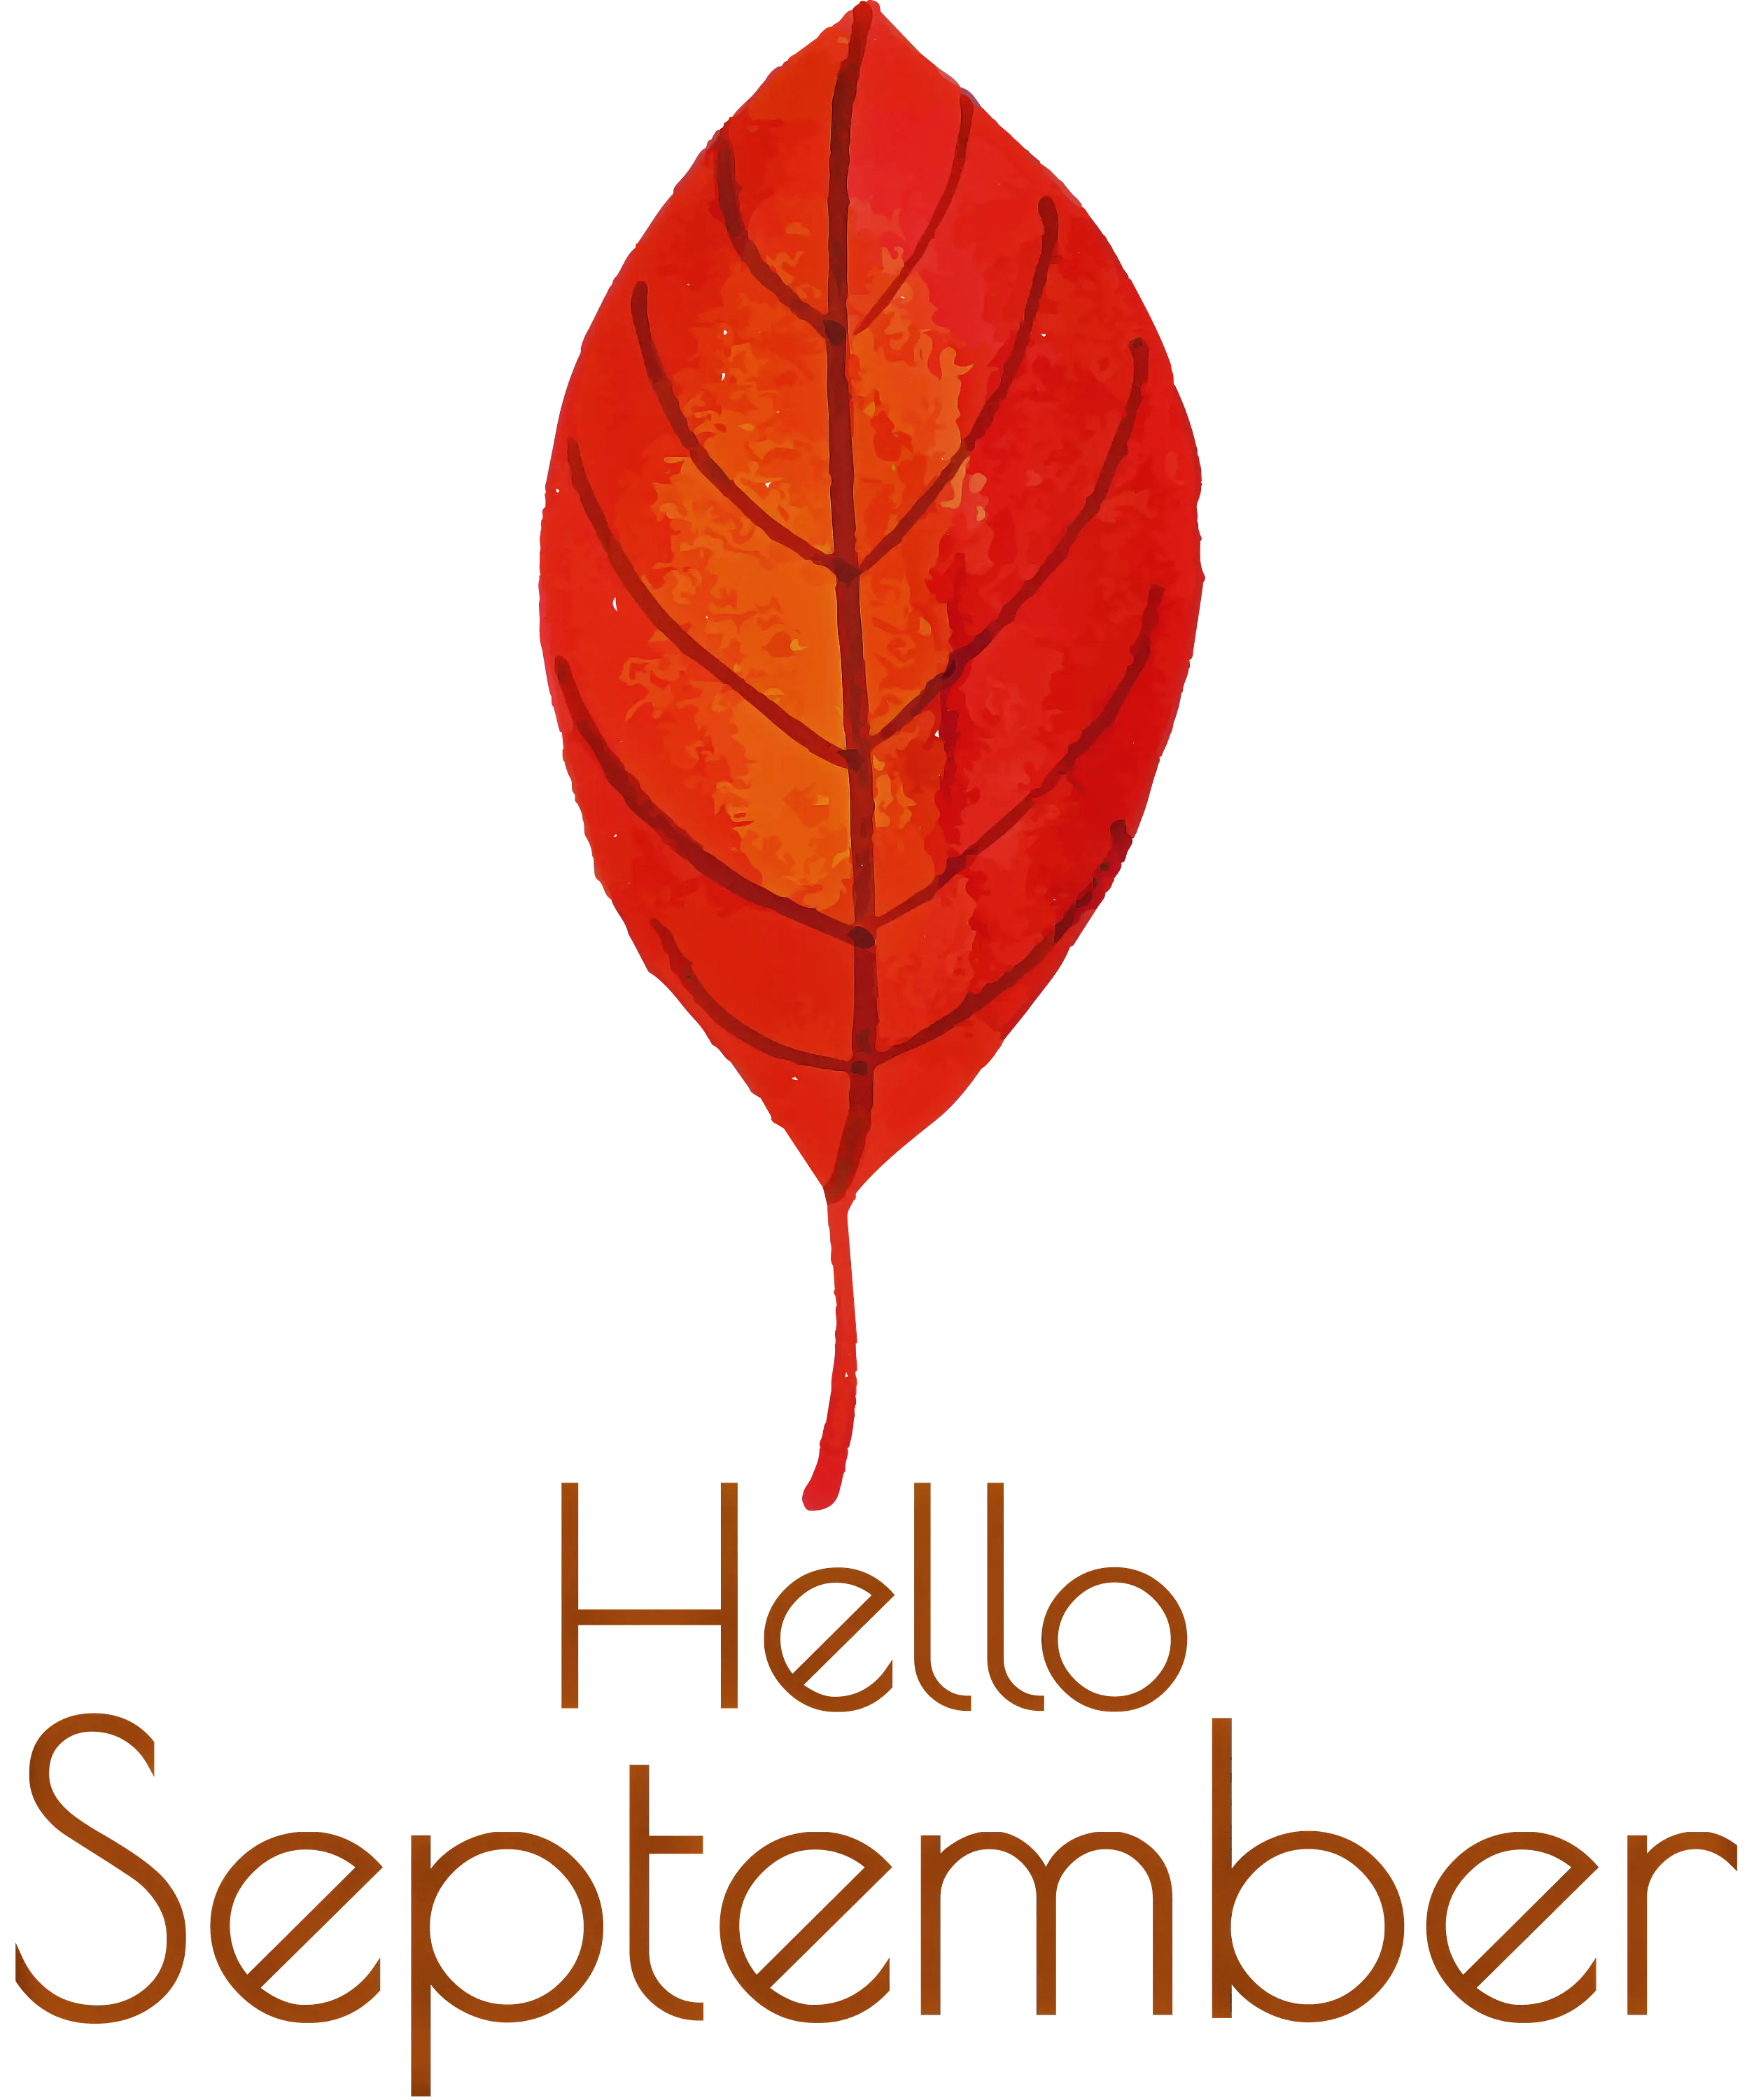
Orange Autumn Leaf with Hello September Text -
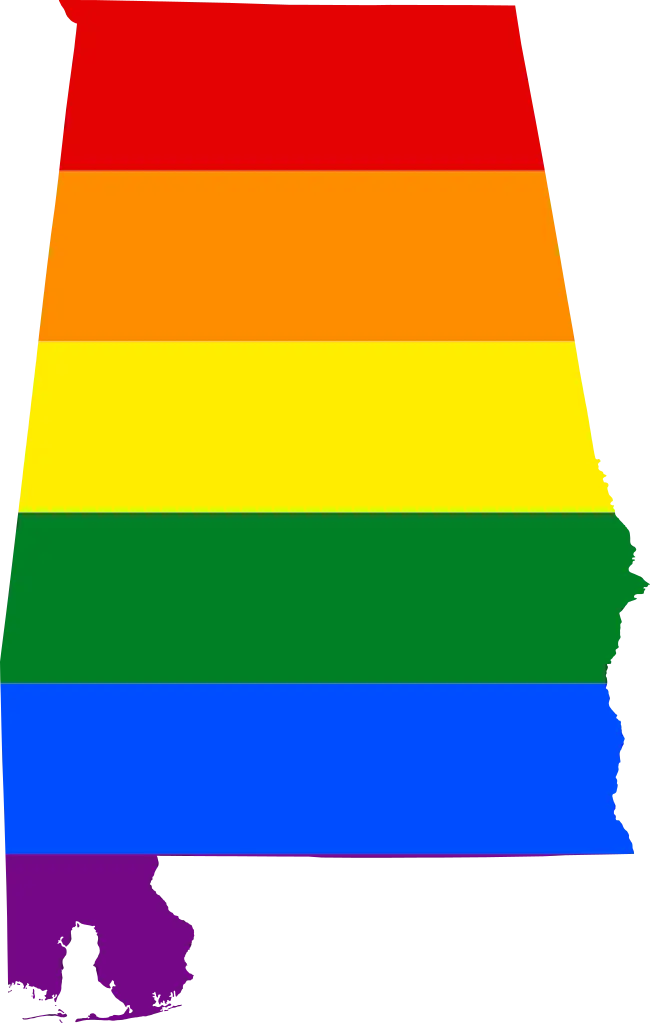
Alabama Pride Flag in Rainbow Colors -

Circle Pie Chart Icon -
Colorful Fish Illustration -
Colorful Dreamcatcher with Feathers -
Set of Colorful Spoons -
Heart-Shaped German Flag Design -
Colorful Fireworks Celebration Illustration -
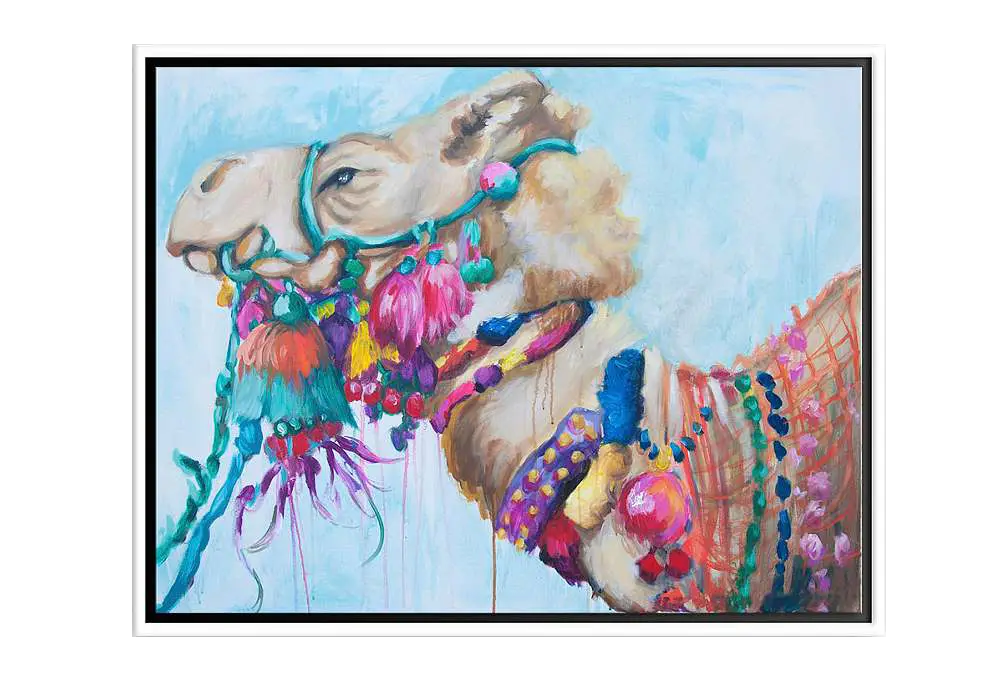
Colorful Camel with Ornaments -
Instagram Logo with Gradient Colors -

Book Icon with Blue Background -

Colorful Hot Air Balloons in the Sky -

Pie Chart Representation -
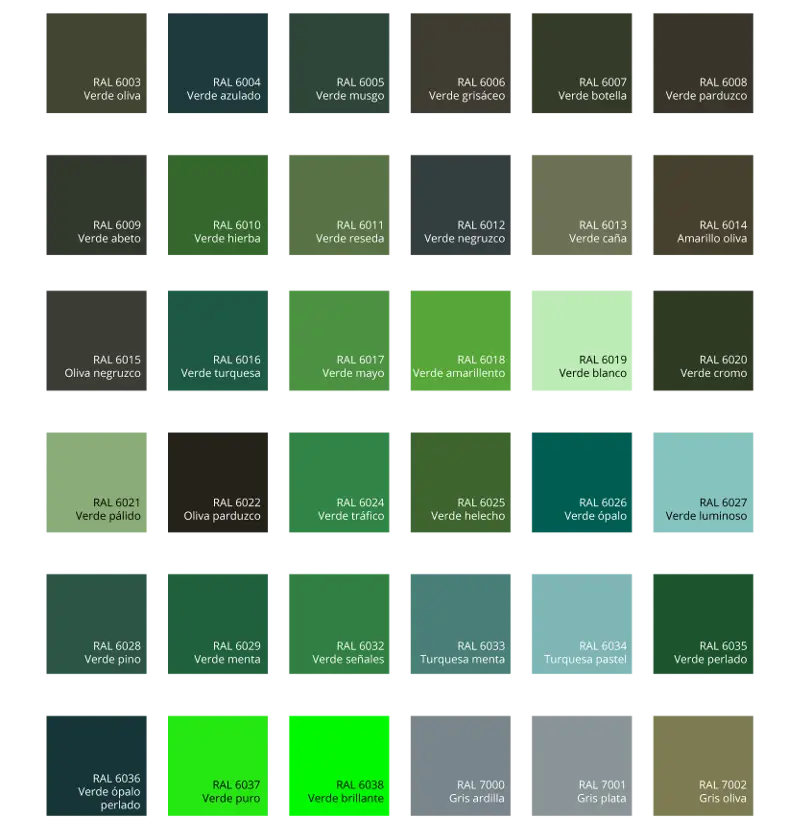
Green Color Palette Chart -

Clipboard Illustration with Financial Chart for Data Analysis -

Colorful Balloons for Celebration