You Might Like
-

Man Holding Completed Checklist Illustration -
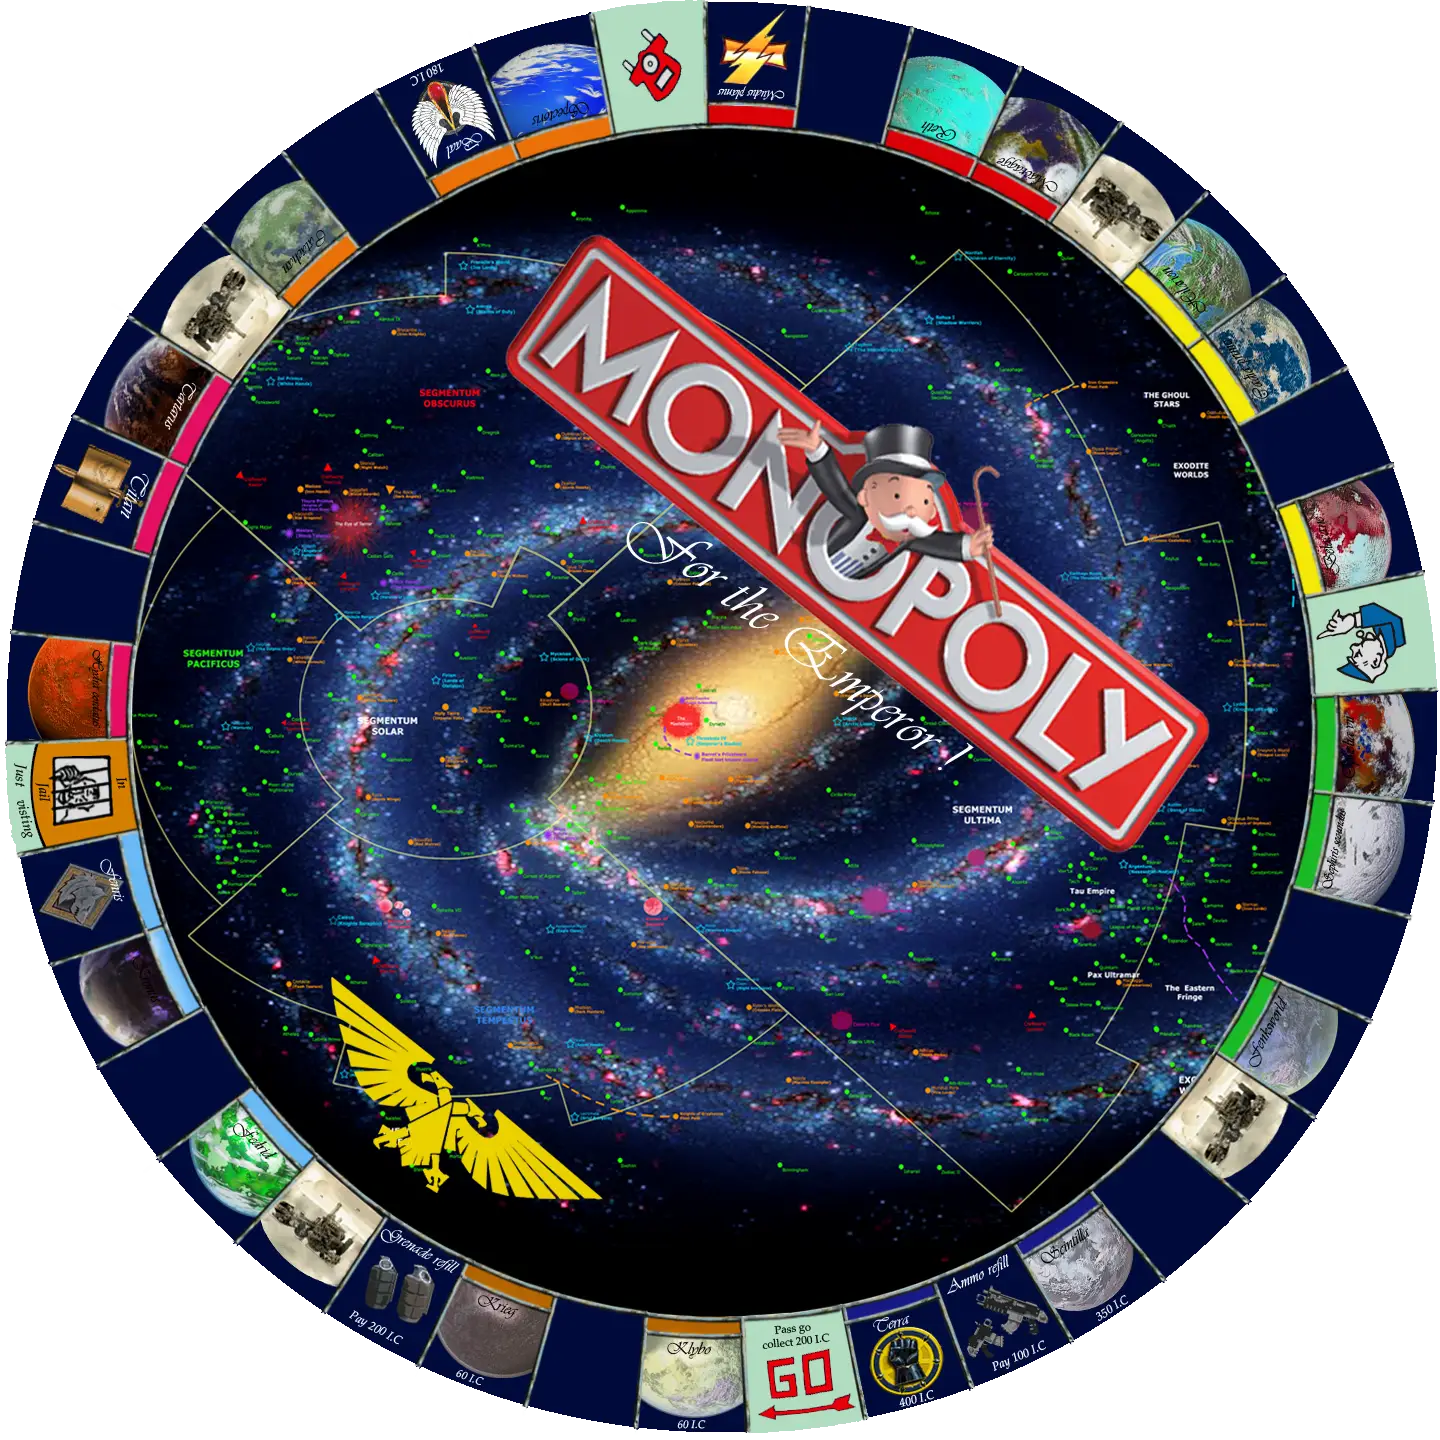
Monopoly Board Game in Space Theme -

Collaboration in Programming with Computer Illustration -

Idea Generation and Teamwork Illustration -

Team with Growth Graph Illustration -

Business Strategy Icons -

Businessmen Climbing Stairs -

Organizational Structure Chart -
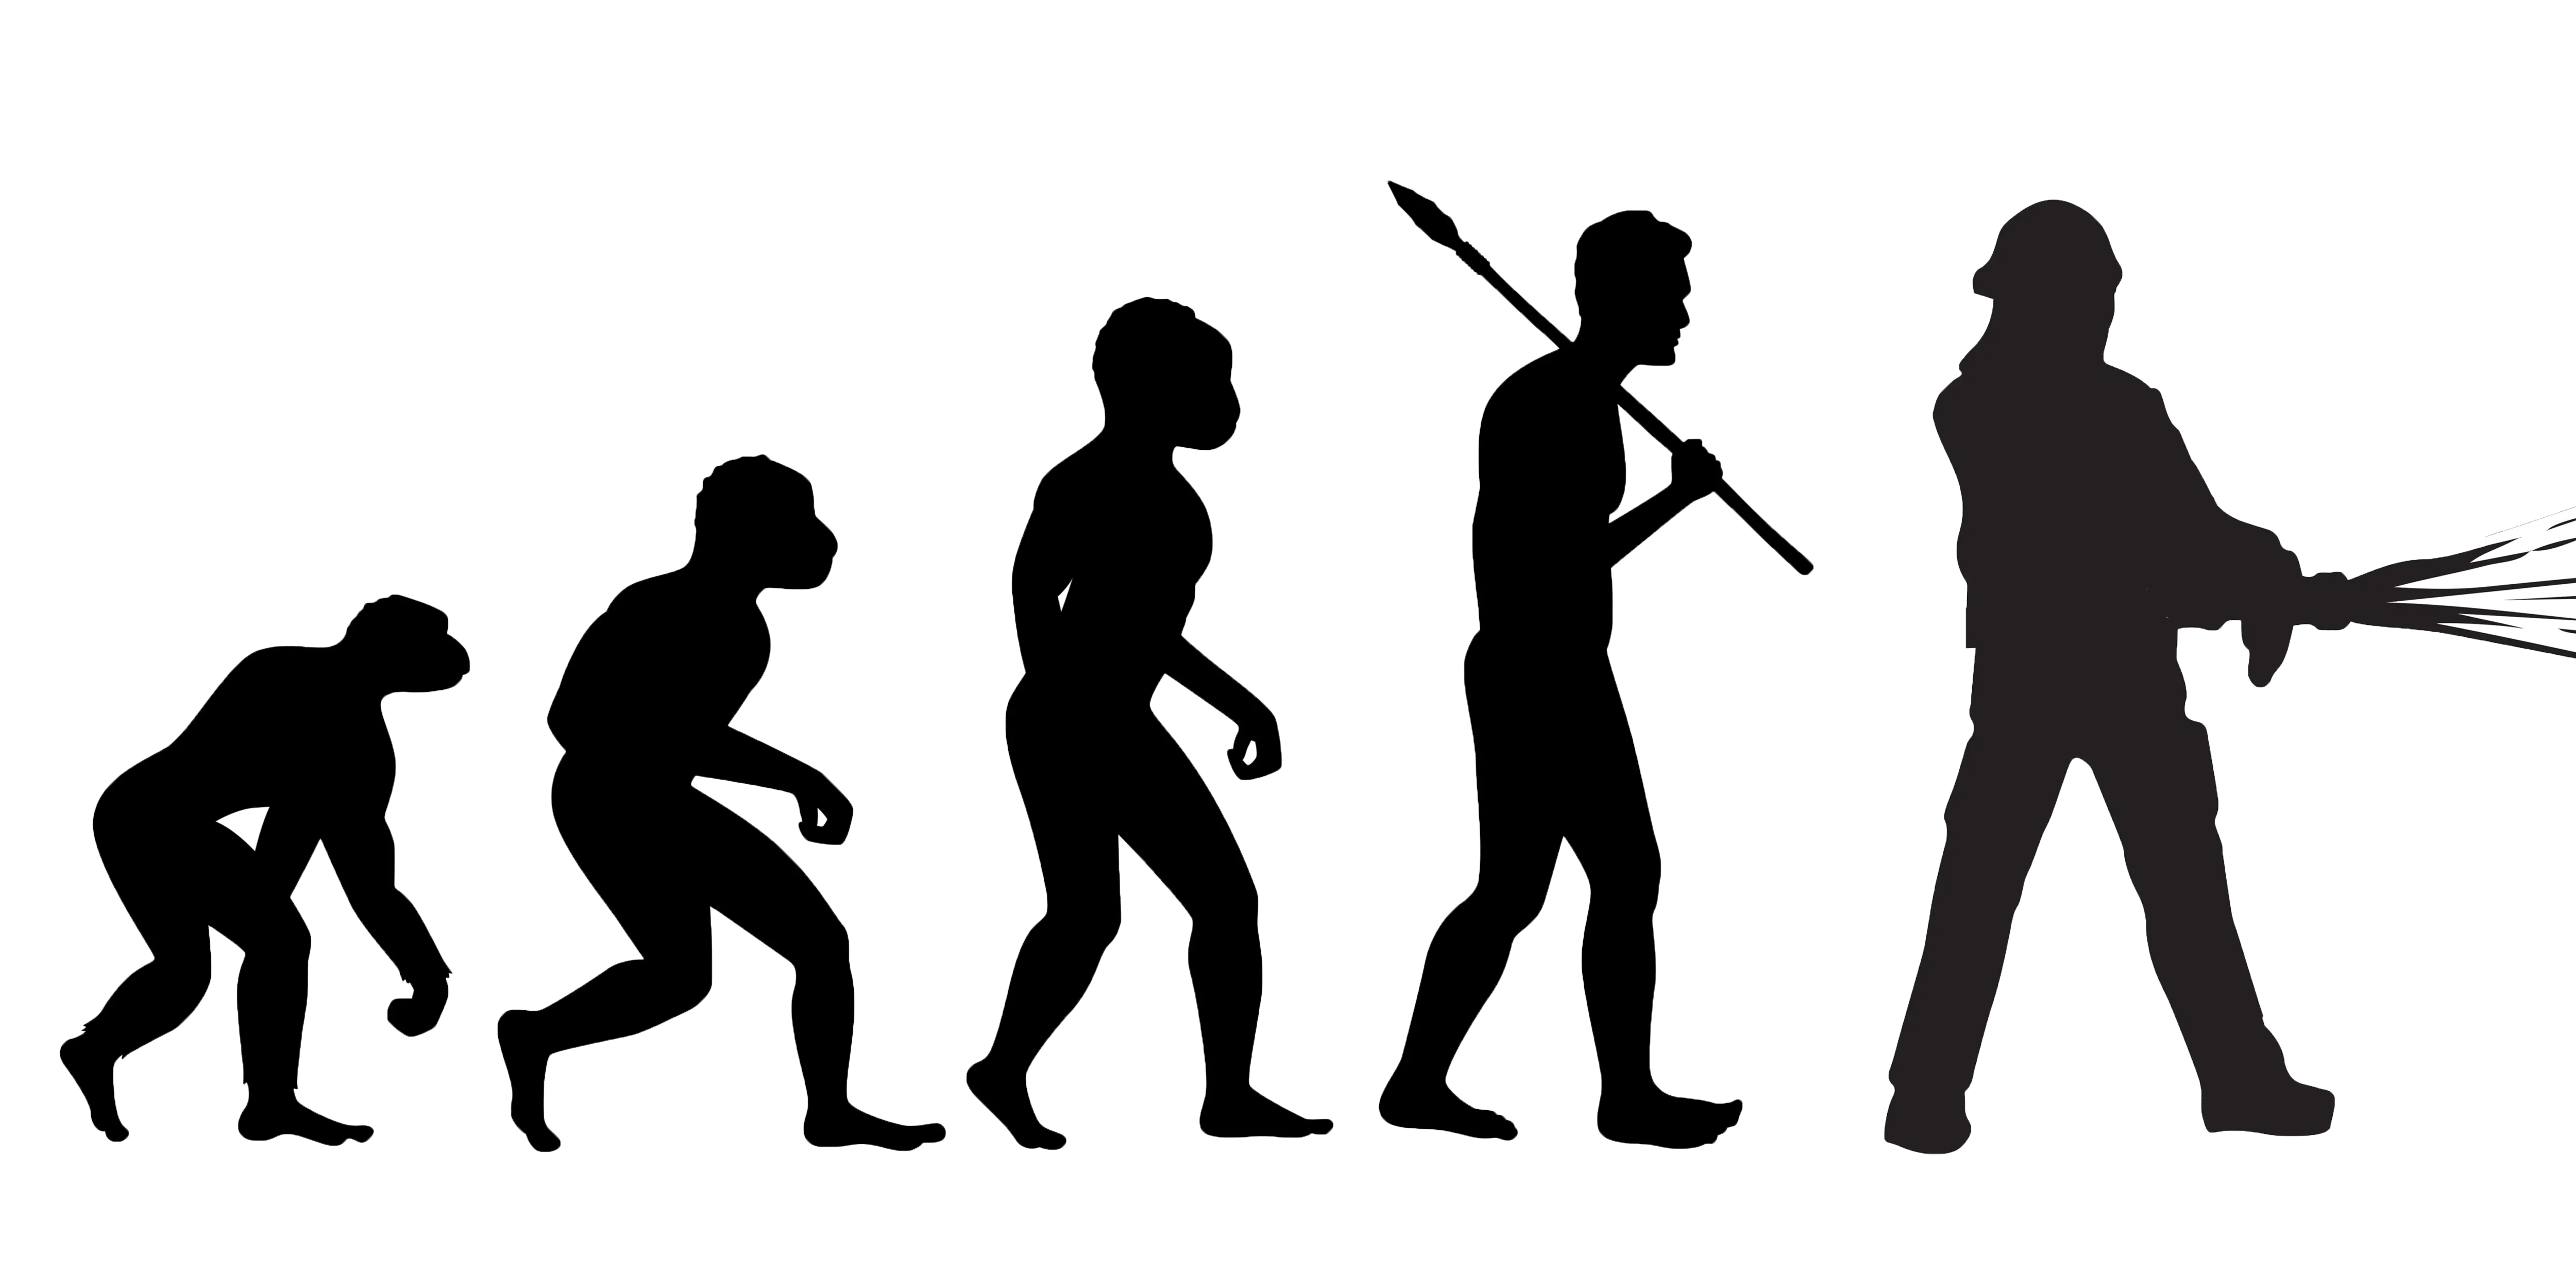
Evolution of Humanity Illustration -

Simple Checklist Icon -

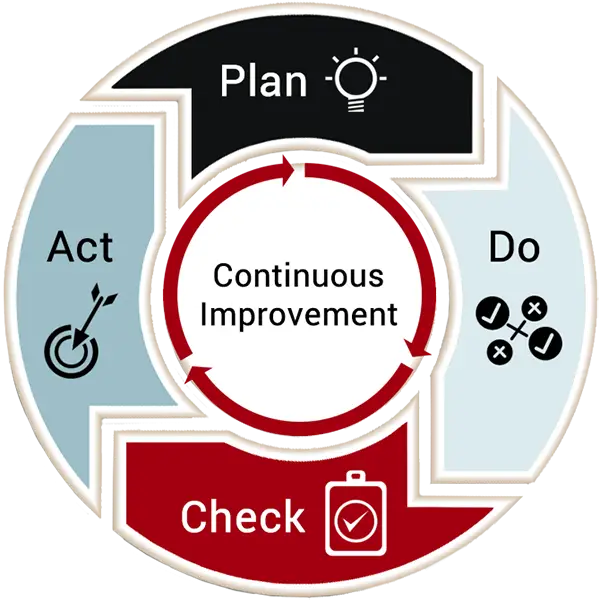
Yellow Circular Arrow Symbol for Recycling -

Presentation Board with Graph for Business Concepts -

Silhouette of Crawling Baby -

Bar Chart with Upward Arrow -

Industrial Valve System Design -

What's Your Schedule? -

Dollar Sign with Circular Arrows -
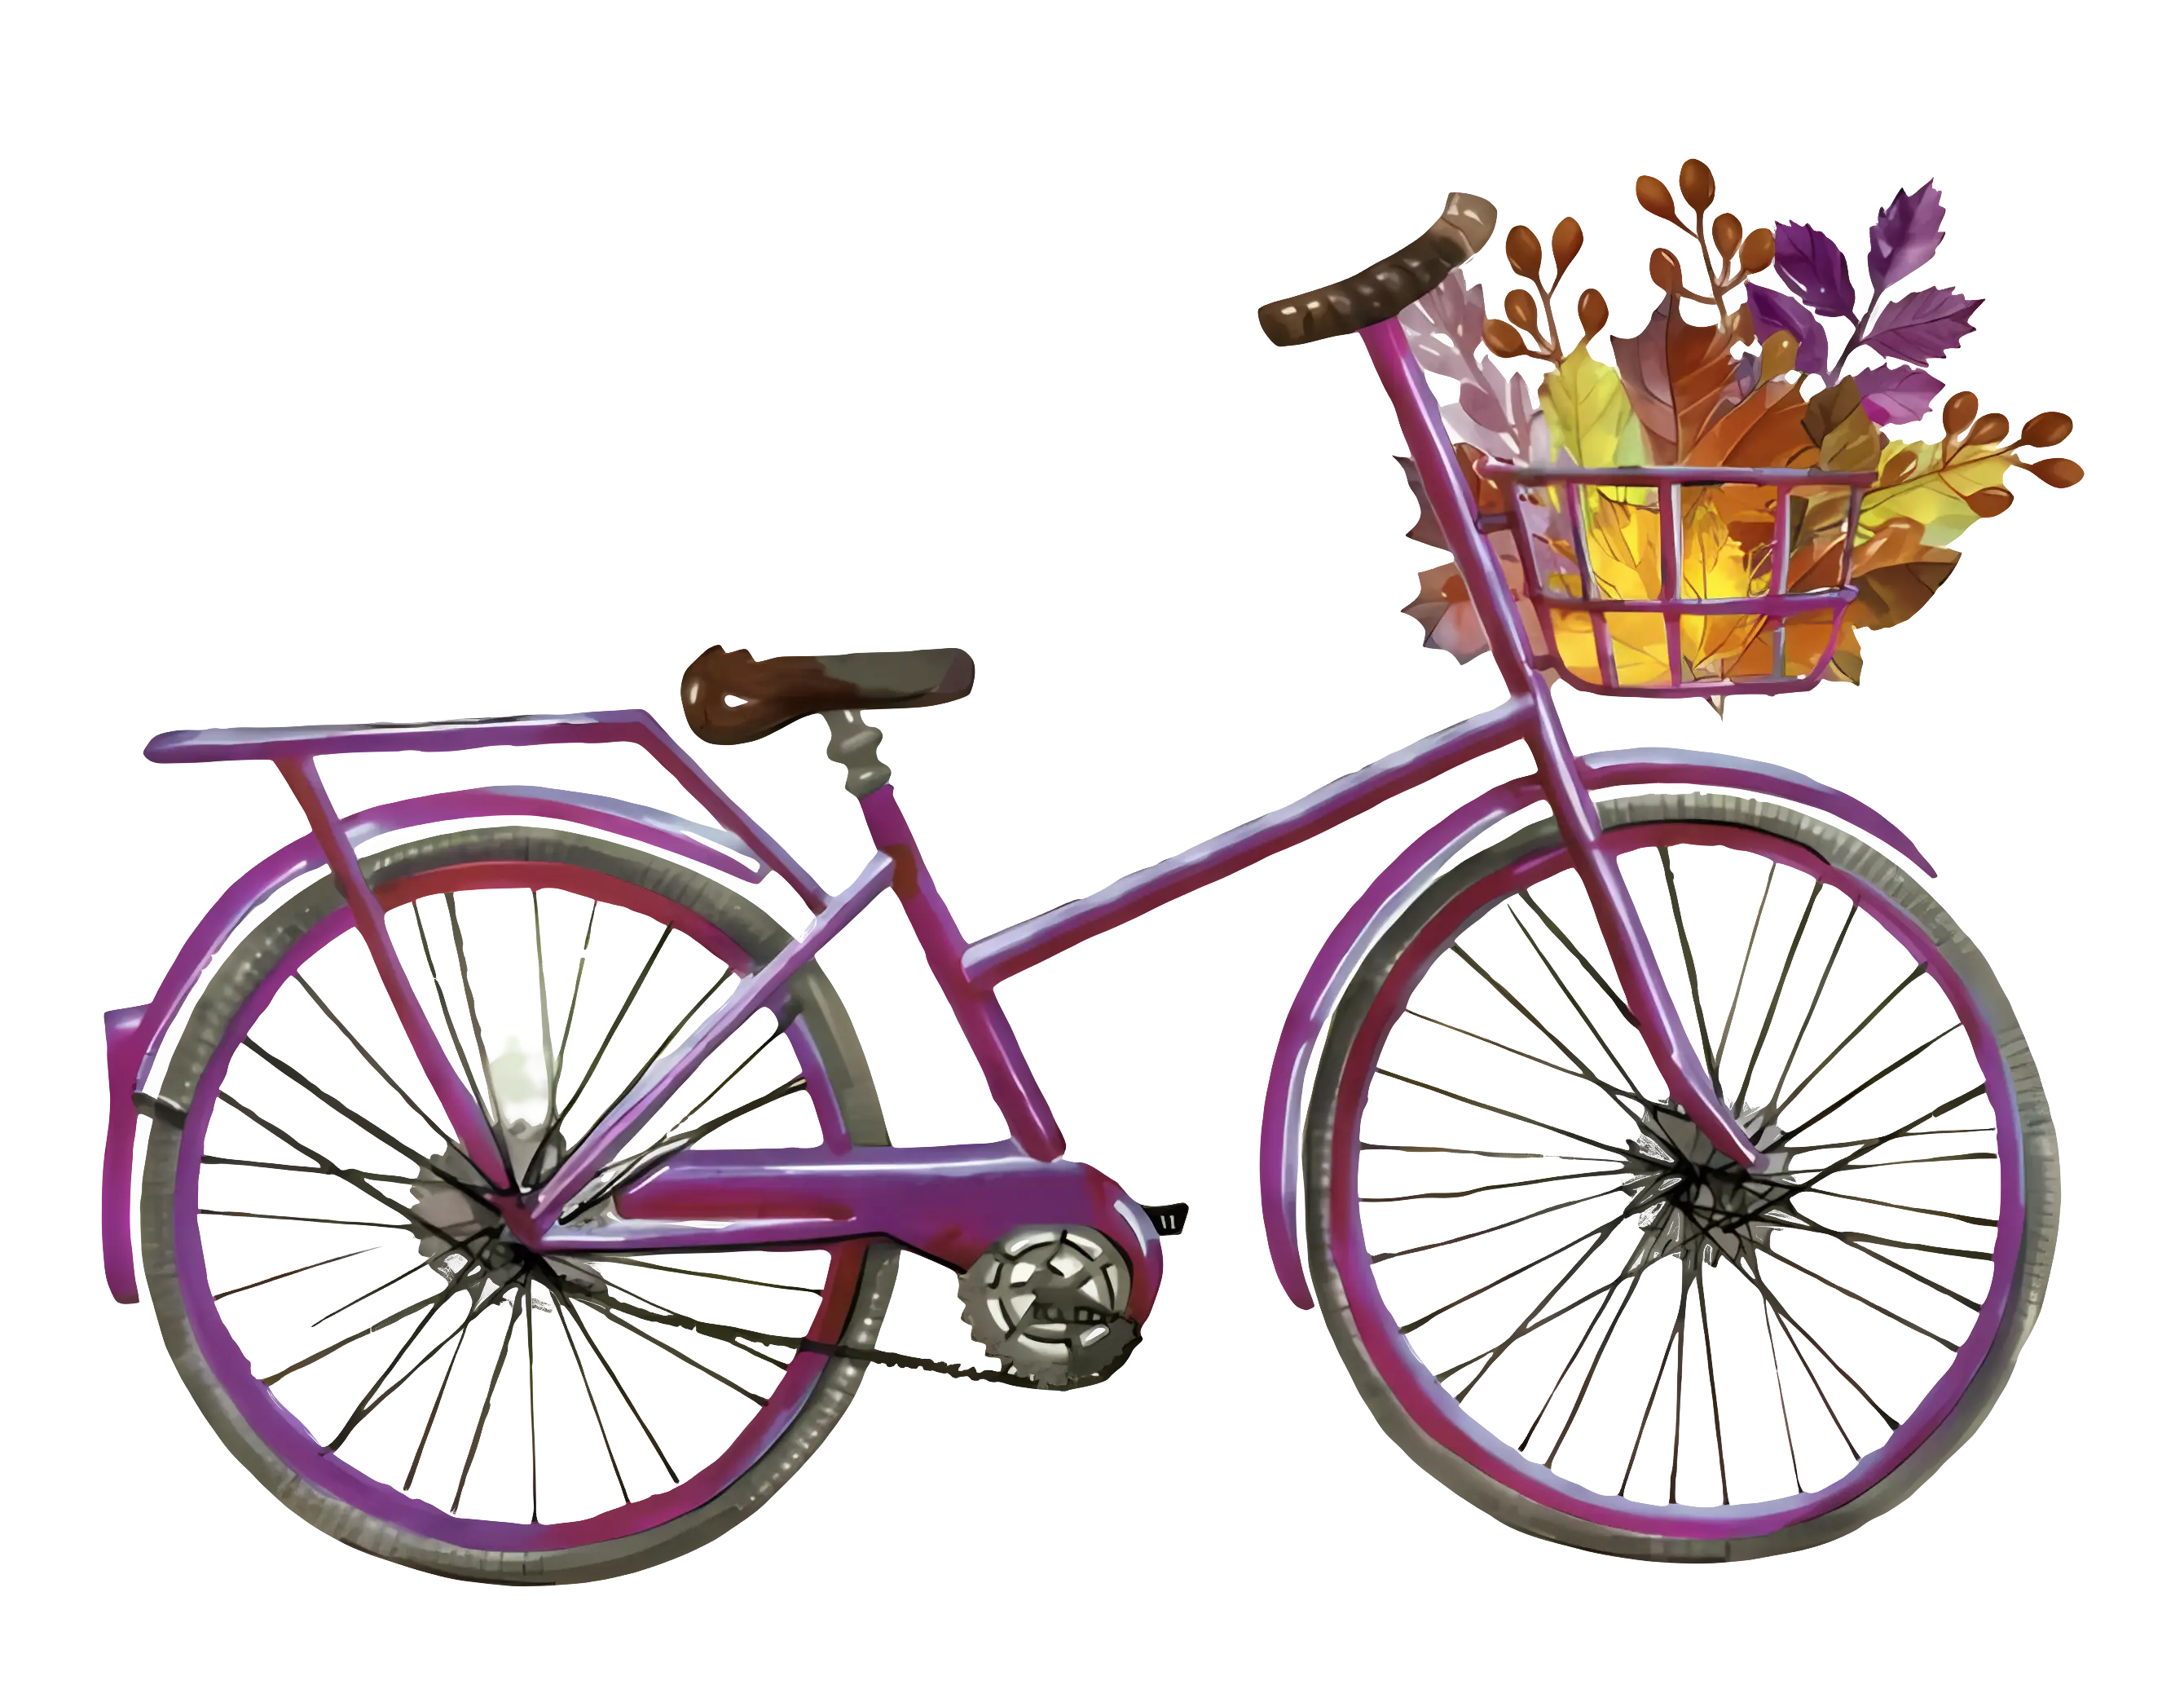
Purple Bicycle with Autumn Leaves in Basket -

Red Car with Stylish Design -
National Minority Supplier Development Council Logo -

Illustration of Growth Chart with Upward Arrow -

Java Logo with Steaming Cup -
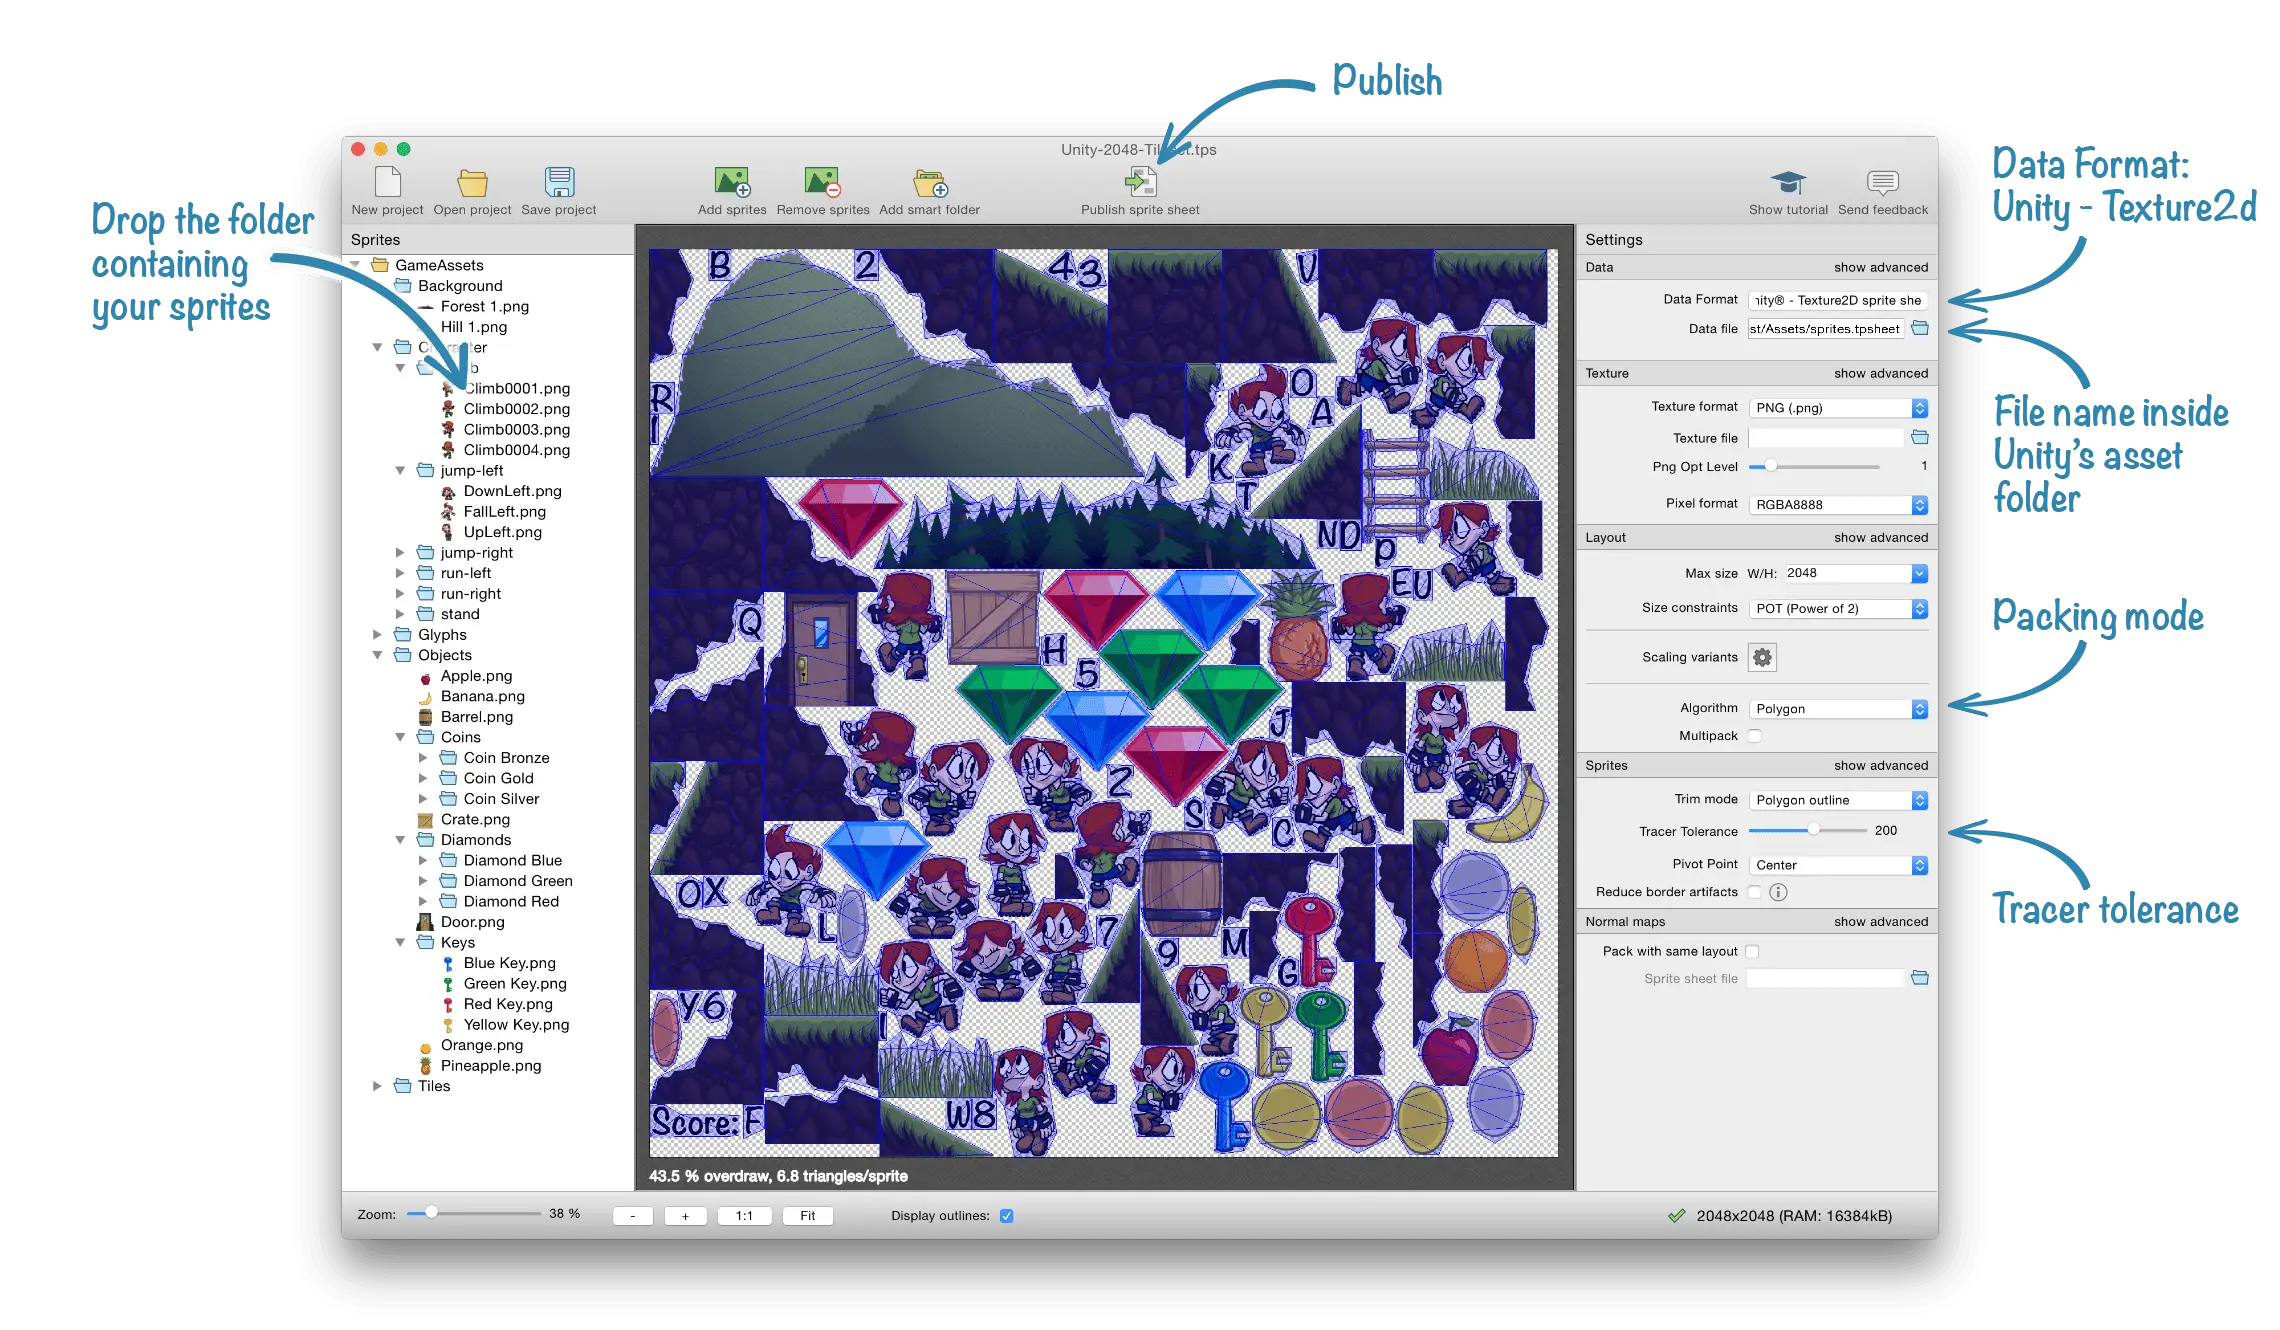
Game Development Interface with Assets -

Business People with Circular Chart -
Circular Arrows Representing Cycle or Loop -
Work in Progress Sign -
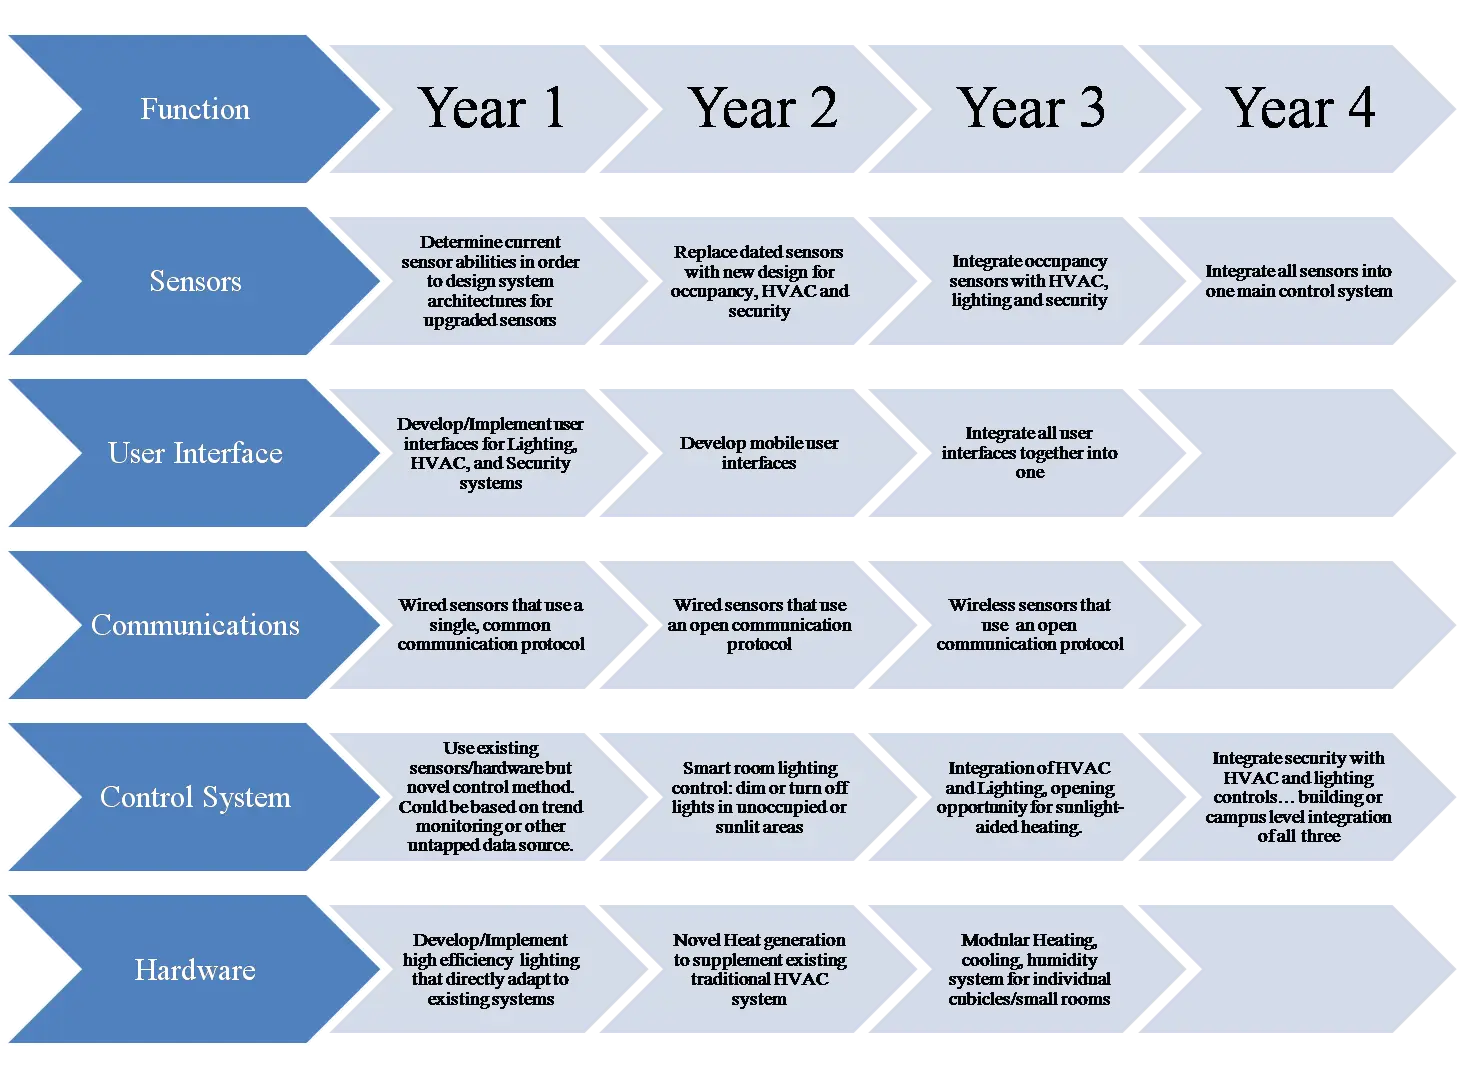
Development Roadmap for Project Planning -

Notebook and Phone with Pen and Sticky Notes -
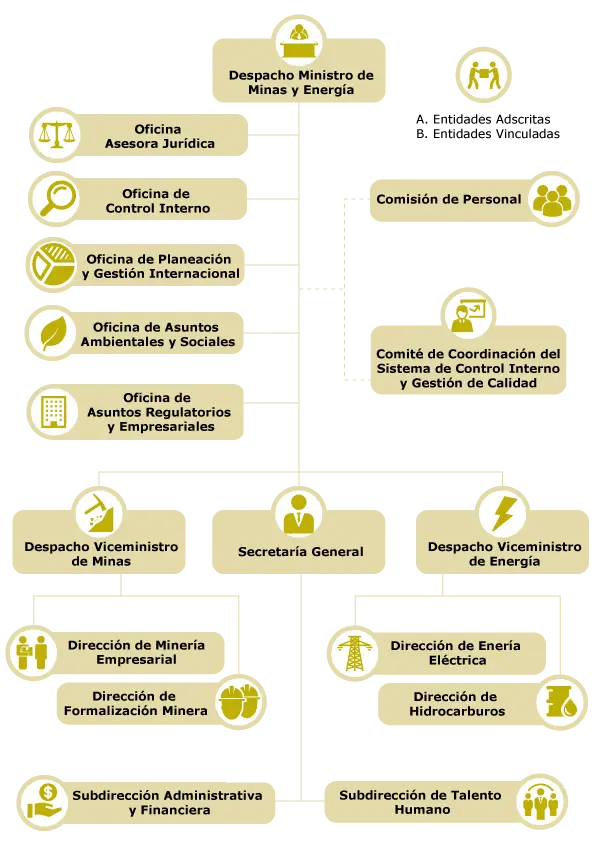
Ministry of Mines and Energy Organizational Chart -

Checklist and Pencil Icon