
You Might Like
-

Team with Growth Graph Illustration -
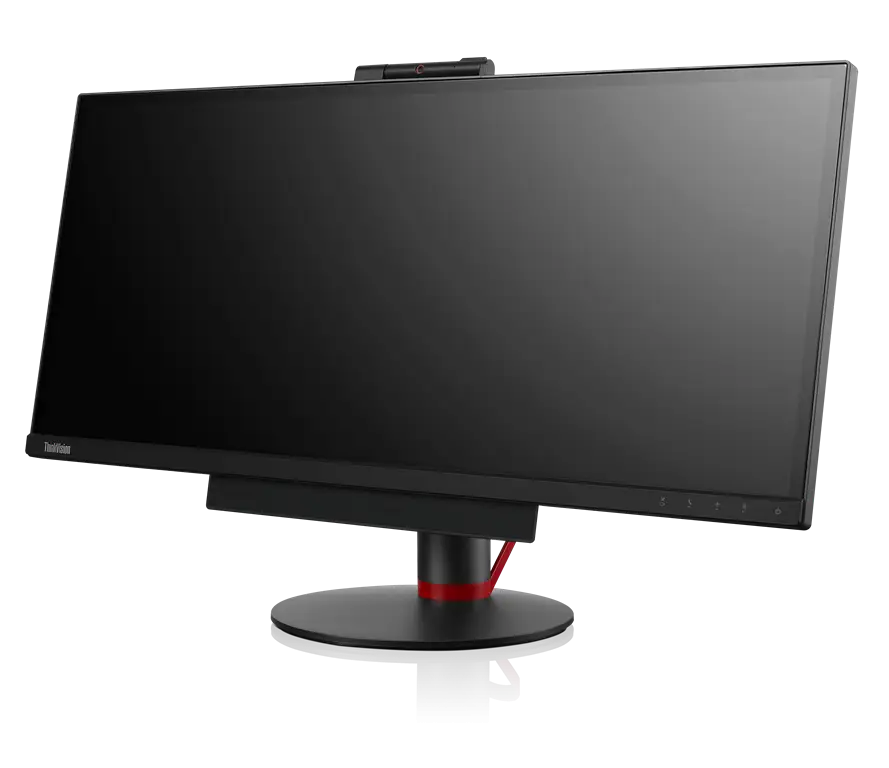
Modern Ultrawide Computer Monitor Display -

Business Strategy Icons -

Secure Laptop with Padlock Icon -

Various Devices Displaying Software -

Icon of KPI Dashboard with Graph and Person -

Zigzag Down Arrow Icon for Decline Representation -

Presentation Board with Graph for Business Concepts -

Yellow Ethernet Cable for Network Connections -

Bar Chart with Upward Arrow -
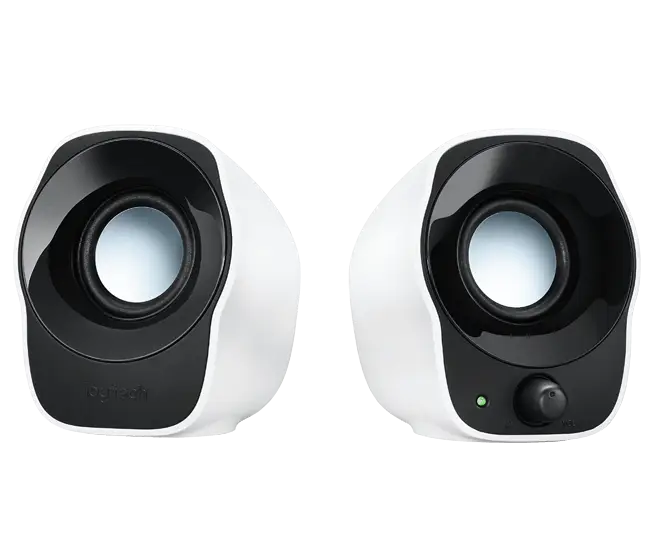
Compact Speakers for Clear Audio Experience -

Infographic Pencil with Data Elements -

Search Growth Icon -

Illustration of Growth Chart with Upward Arrow -
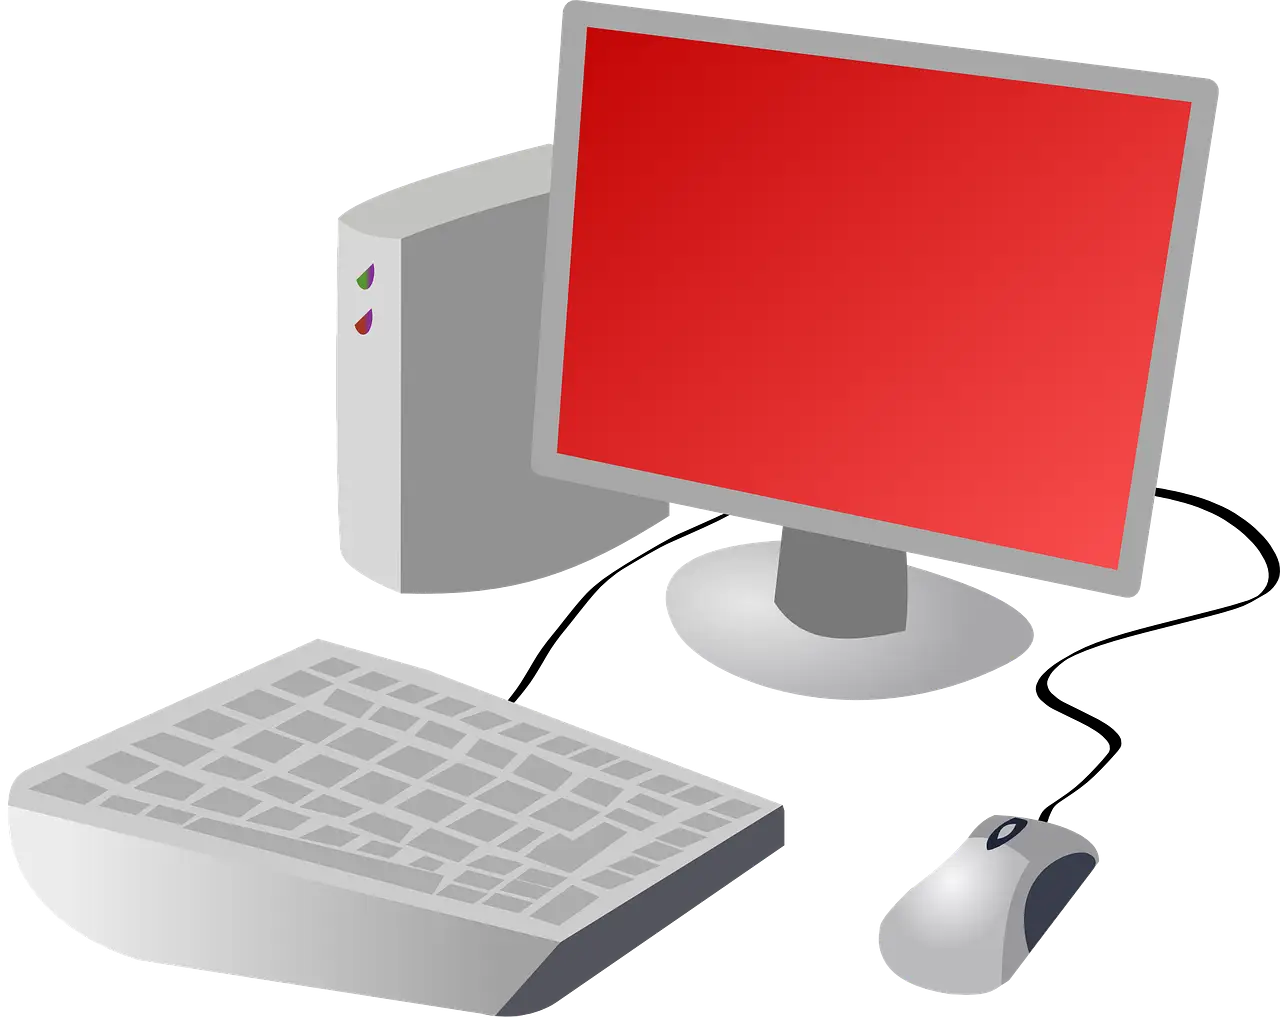
Desktop Computer Set with Red Screen -

Wired Computer Mouse -
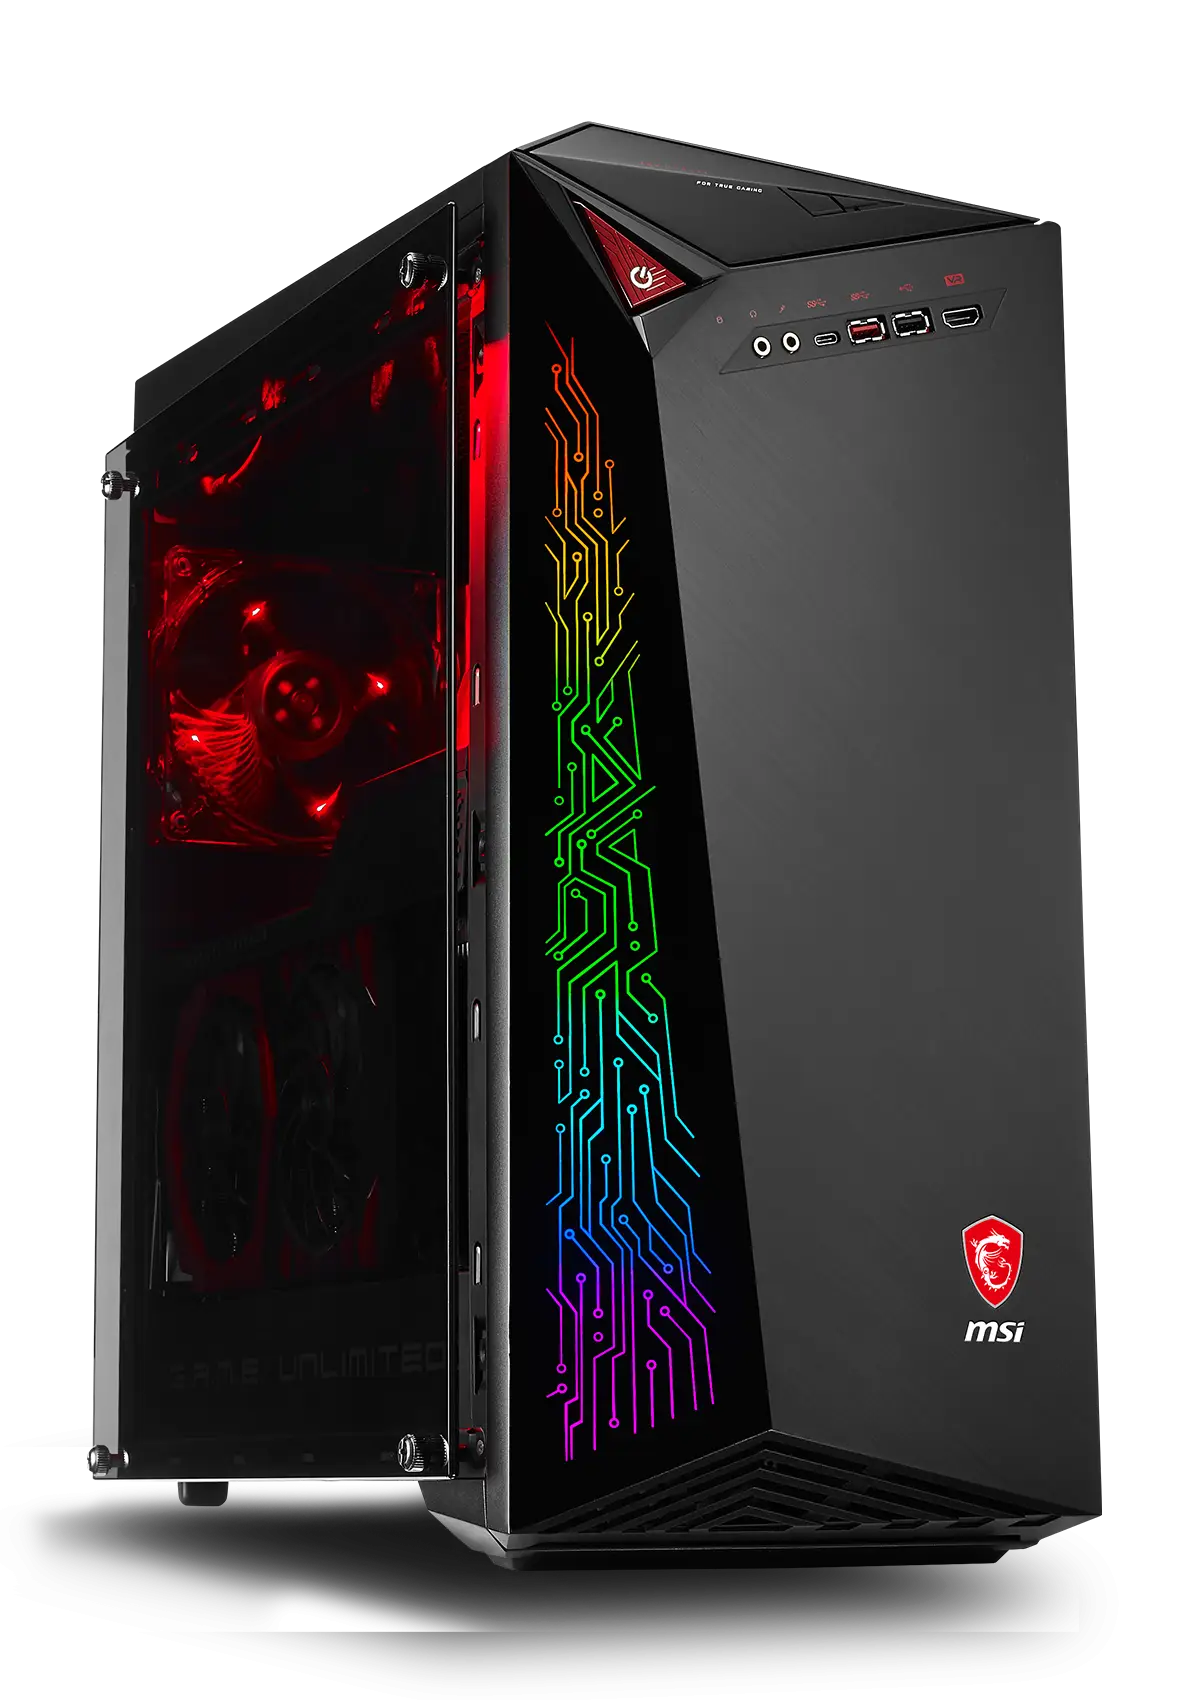
Gaming Desktop Computer with Vibrant RGB Lighting -
Green RAM Memory Module -

SEO Concept with Magnifying Glass and Computer -

Woman Sitting Properly at Desk Using Computer -

Blue Declining Bar Graph with Arrow -

Business Icons Set for Digital Workflows -

Circle Pie Chart Icon -

Bull Market Symbol -

Desktop Computer with Tower Illustration -

Document Processing Cycle -

Medical Cloud Symbol -
Modern Desktop Computer with Vibrant Display -

Black Laptop Technology Illustration -

Declining Chart Illustration