
You Might Like
-

Black Smartphone Icon Design -

Team with Growth Graph Illustration -
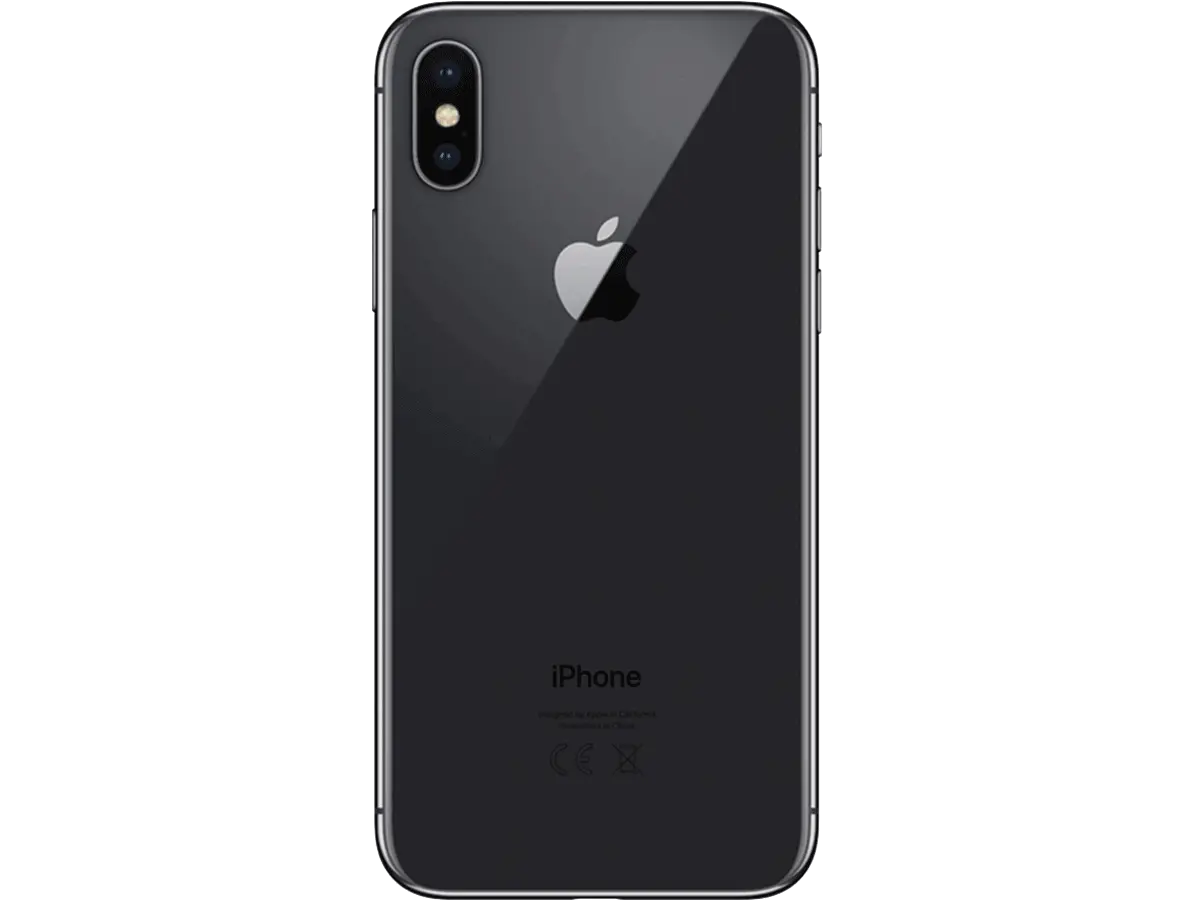
Black Smartphone Back View Design -
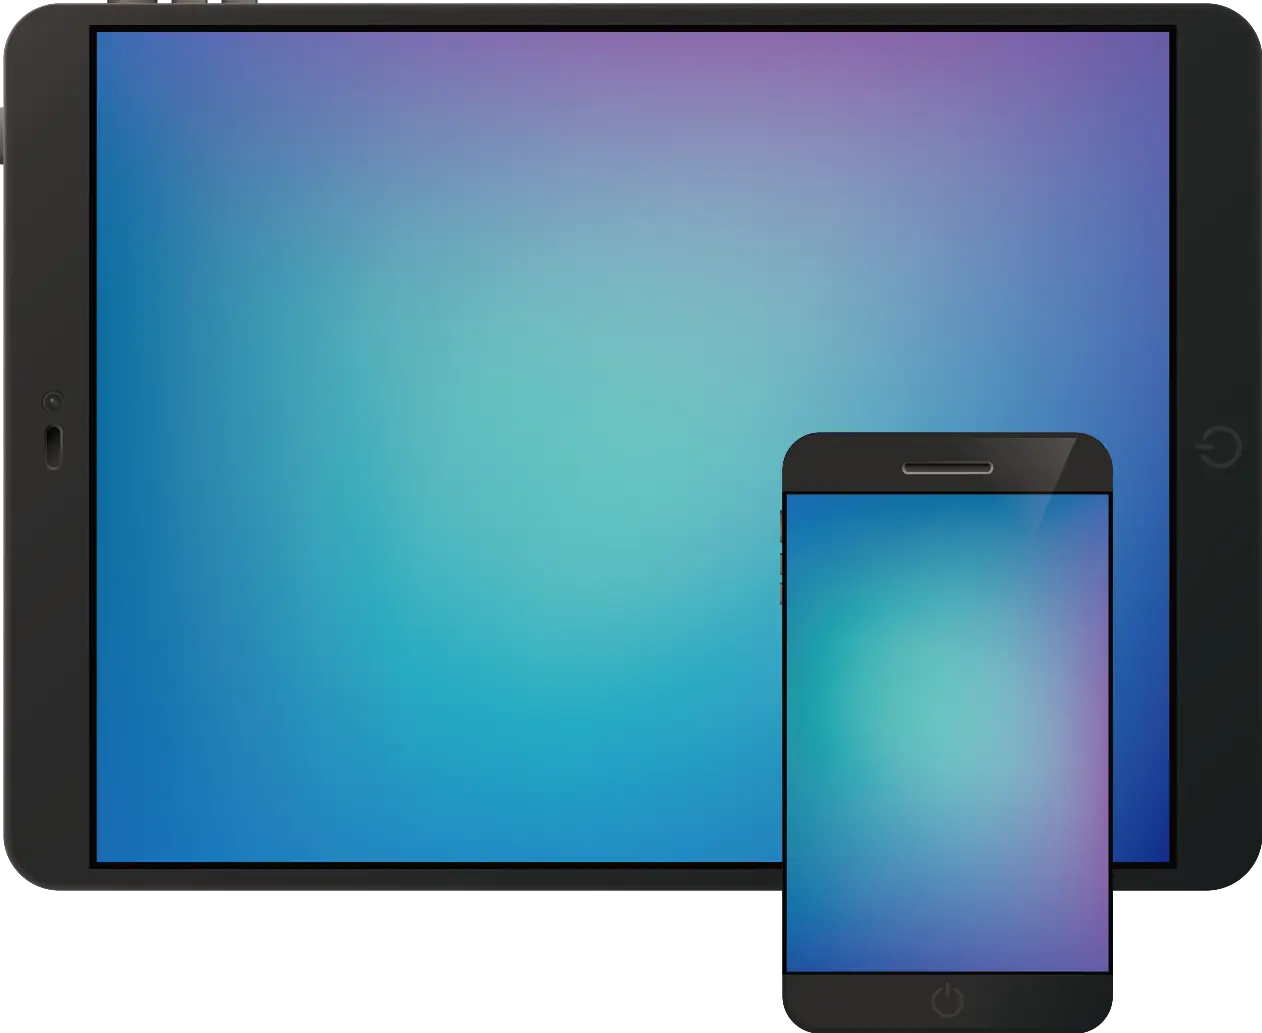
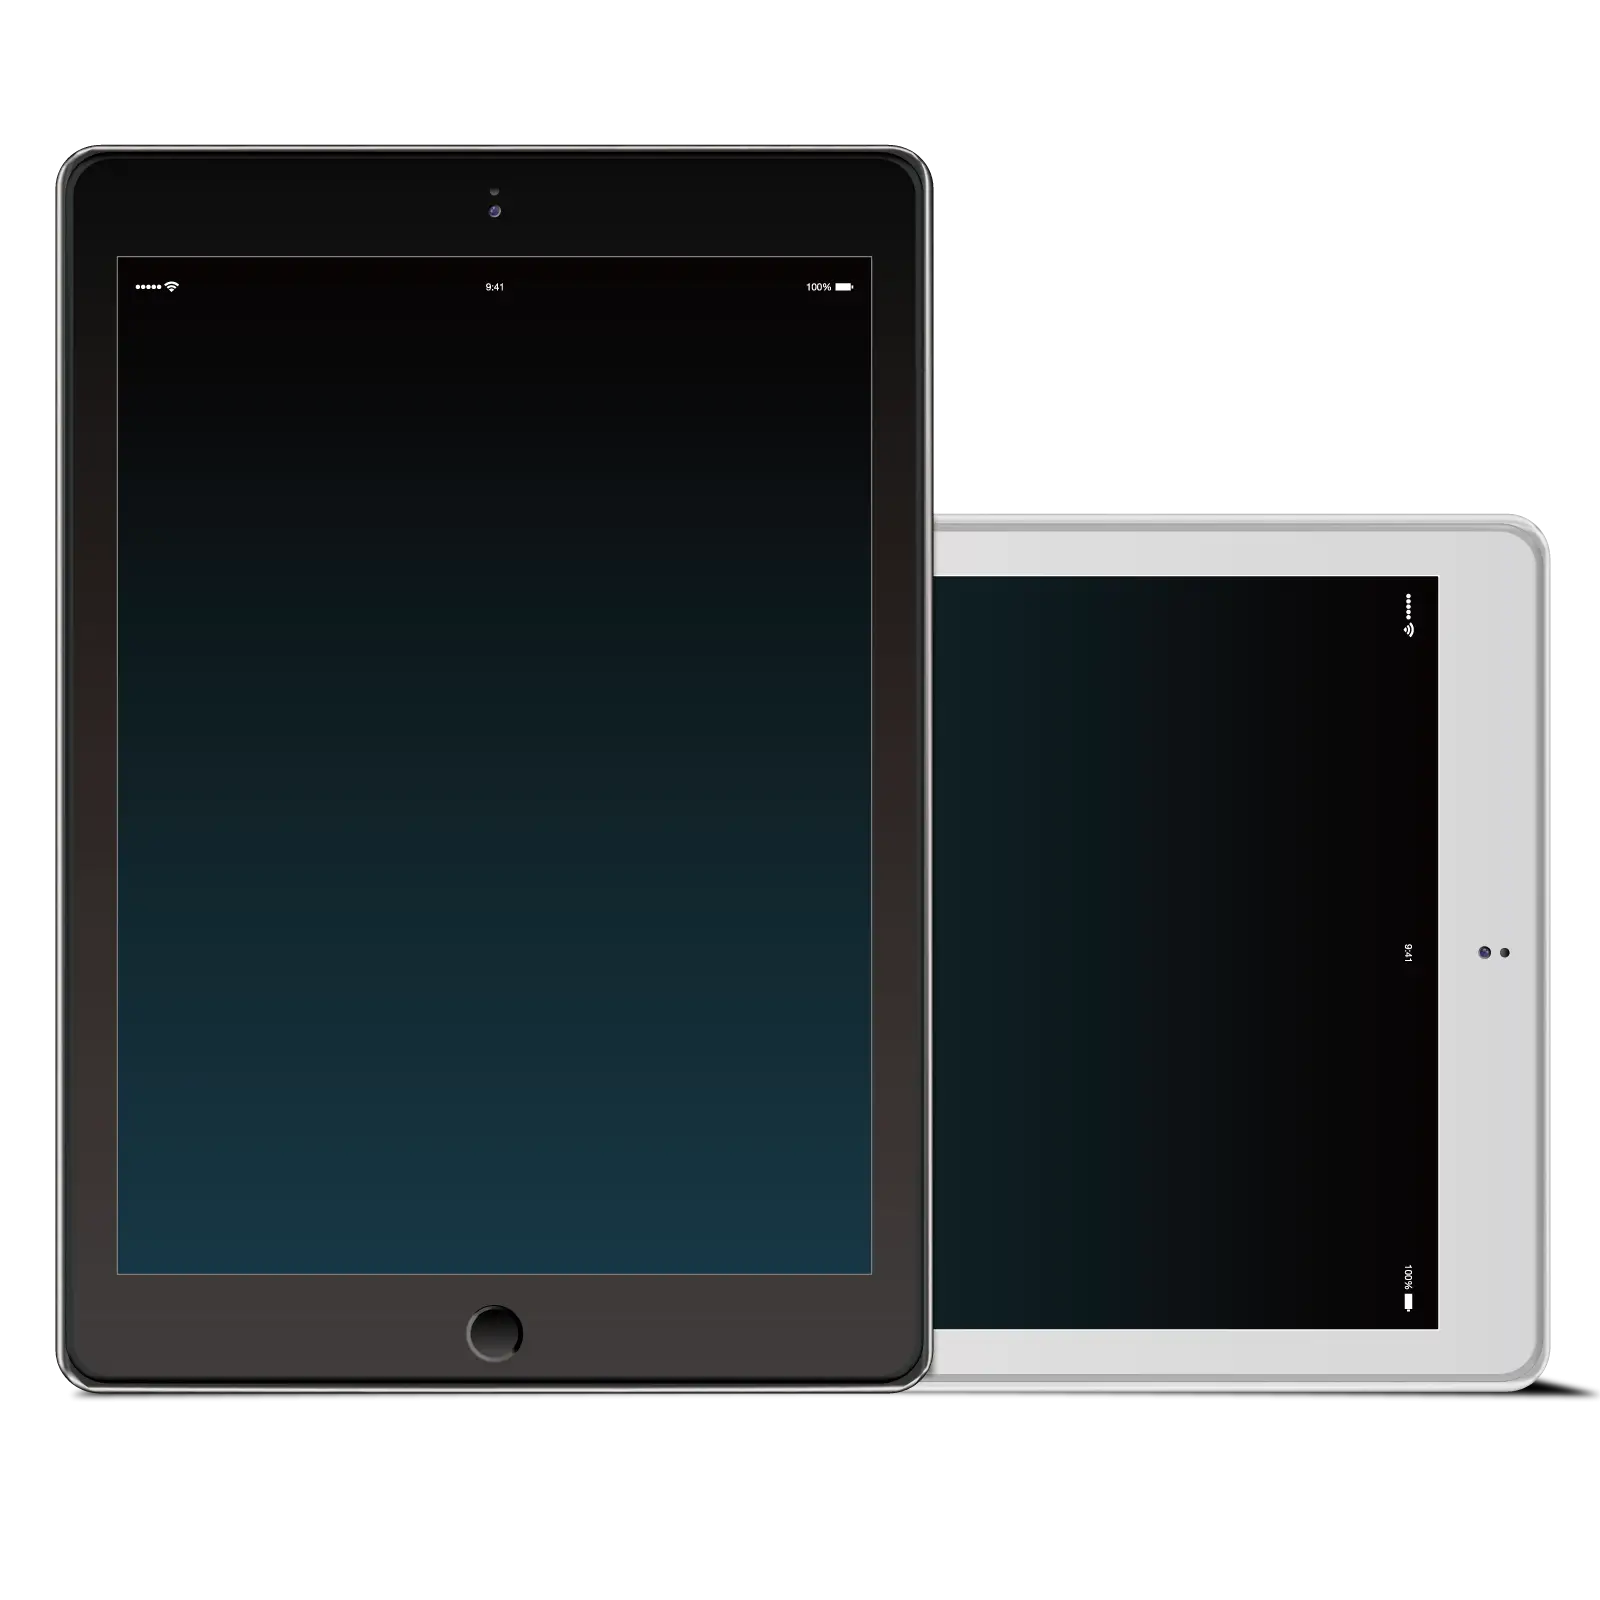
Tablet and Smartphone Technology -

Business Strategy Icons -

Purple Phone Call Icon with Notification -

Isometric Illustration of a Modern Kitchen Layout -

Hamburger Menu Icon for Navigation -

Businessman in a Suit Checking Phone -

Various Devices Displaying Software -

Elegant Dining Room Interior with Modern Furnishing -
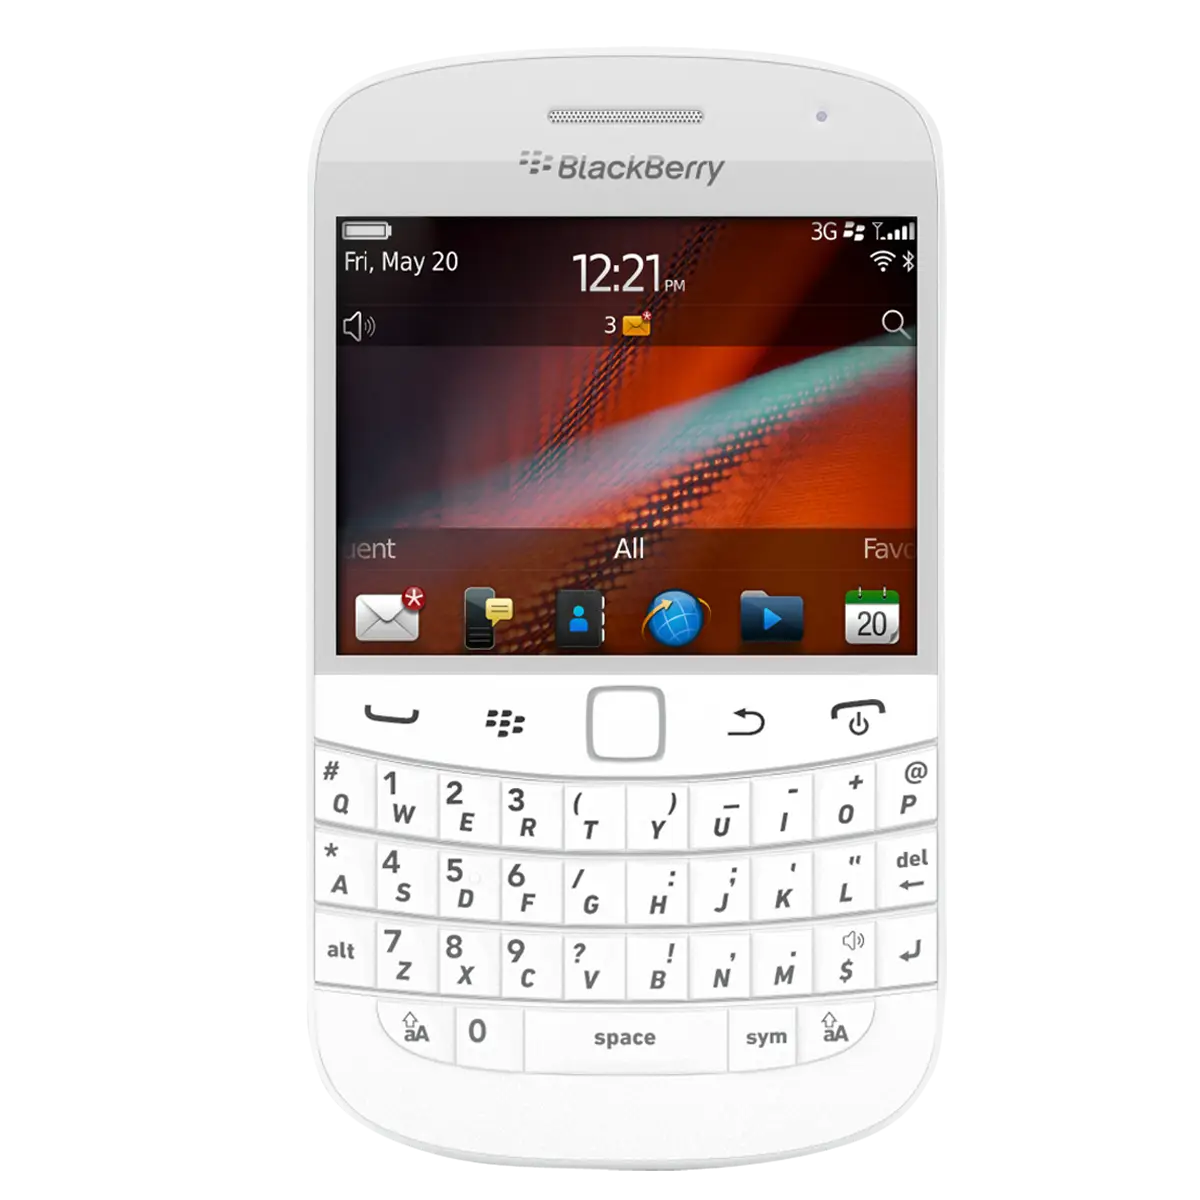
White BlackBerry Phone with Keyboard -

Icon of KPI Dashboard with Graph and Person -
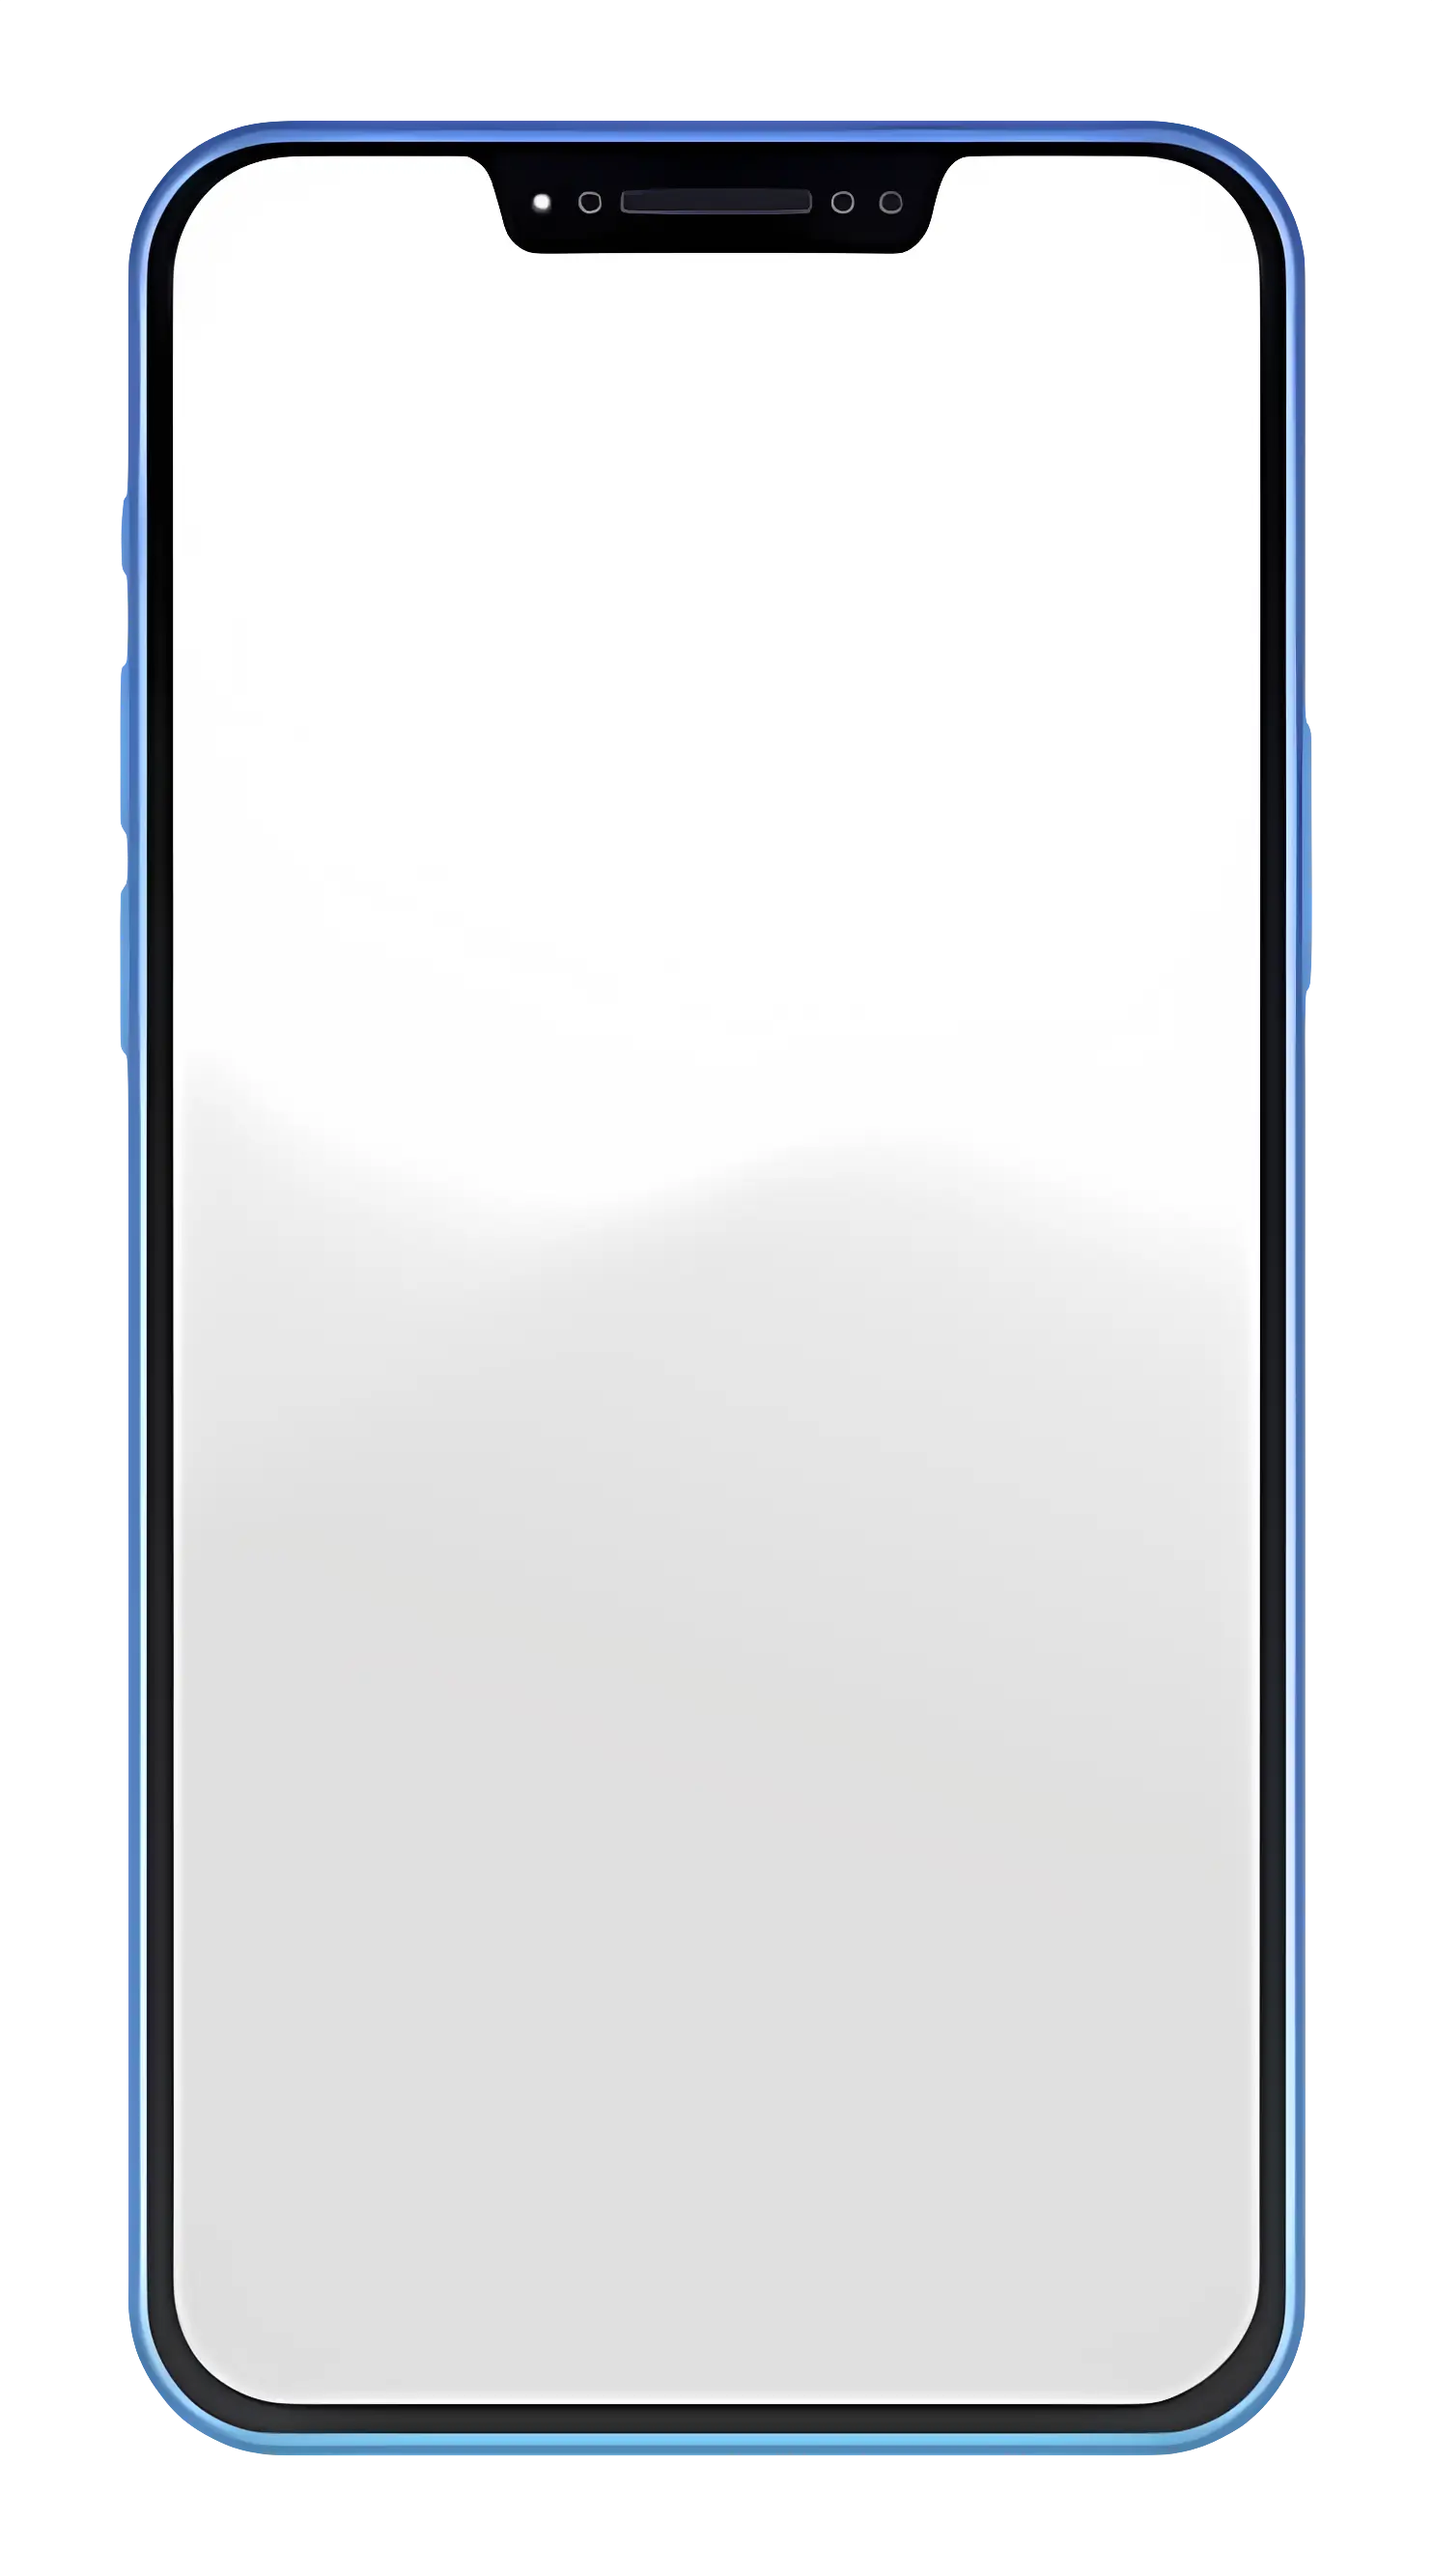
Modern Smartphone with Blank Screen -

Smartphone Outline Icon Illustration -

Zigzag Down Arrow Icon for Decline Representation -

Presentation Board with Graph for Business Concepts -
Black Smartphone Frame with Screen Template -

Yellow Ethernet Cable for Network Connections -

Bar Chart with Upward Arrow -

Infographic Pencil with Data Elements -
Black and White Tablet Device Icon -

Search Growth Icon -

Illustration of Growth Chart with Upward Arrow -

3G Signal Wireless Icon -

SEO Concept with Magnifying Glass and Computer -

Green Signal Bars Icon -
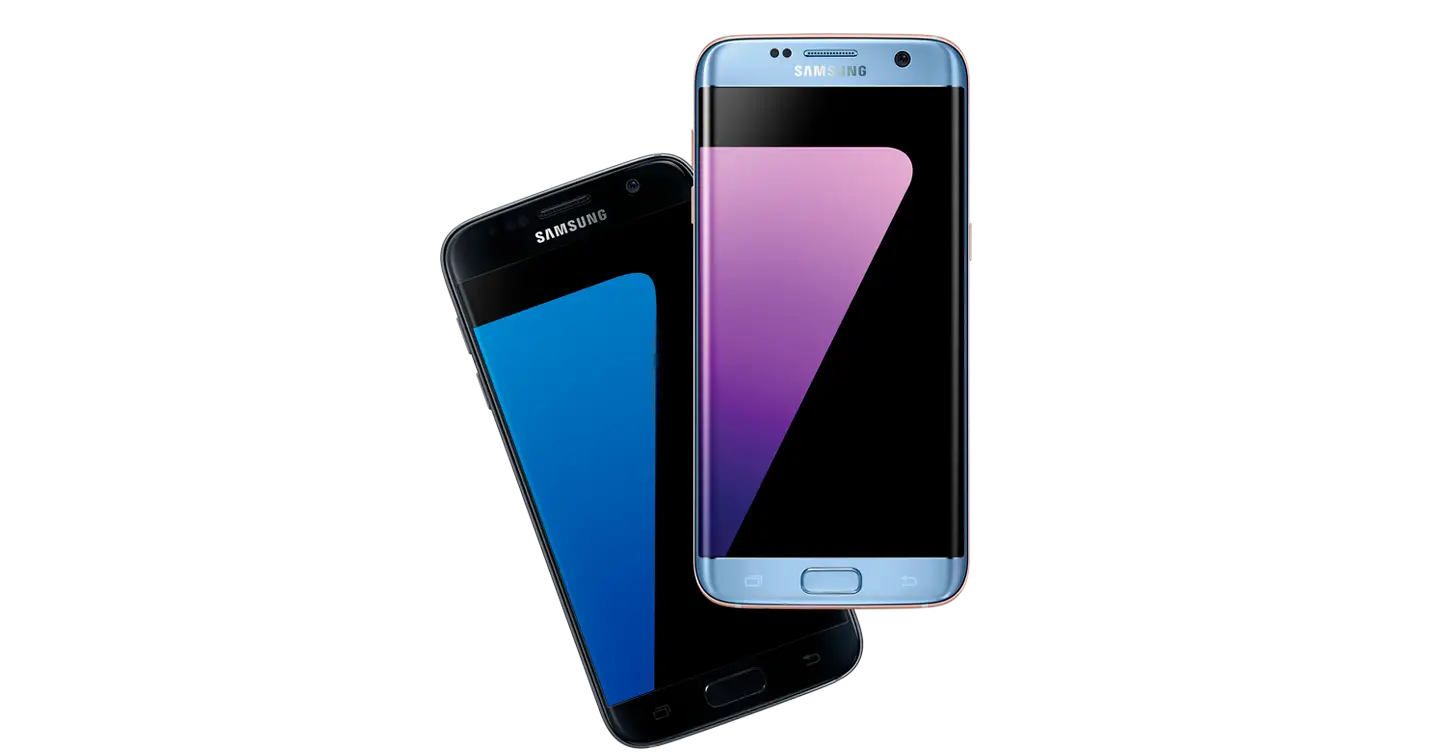
Samsung Smartphones in Black and Blue -

Blue Declining Bar Graph with Arrow -

Business Icons Set for Digital Workflows