
You Might Like
-

Collaboration in Programming with Computer Illustration -
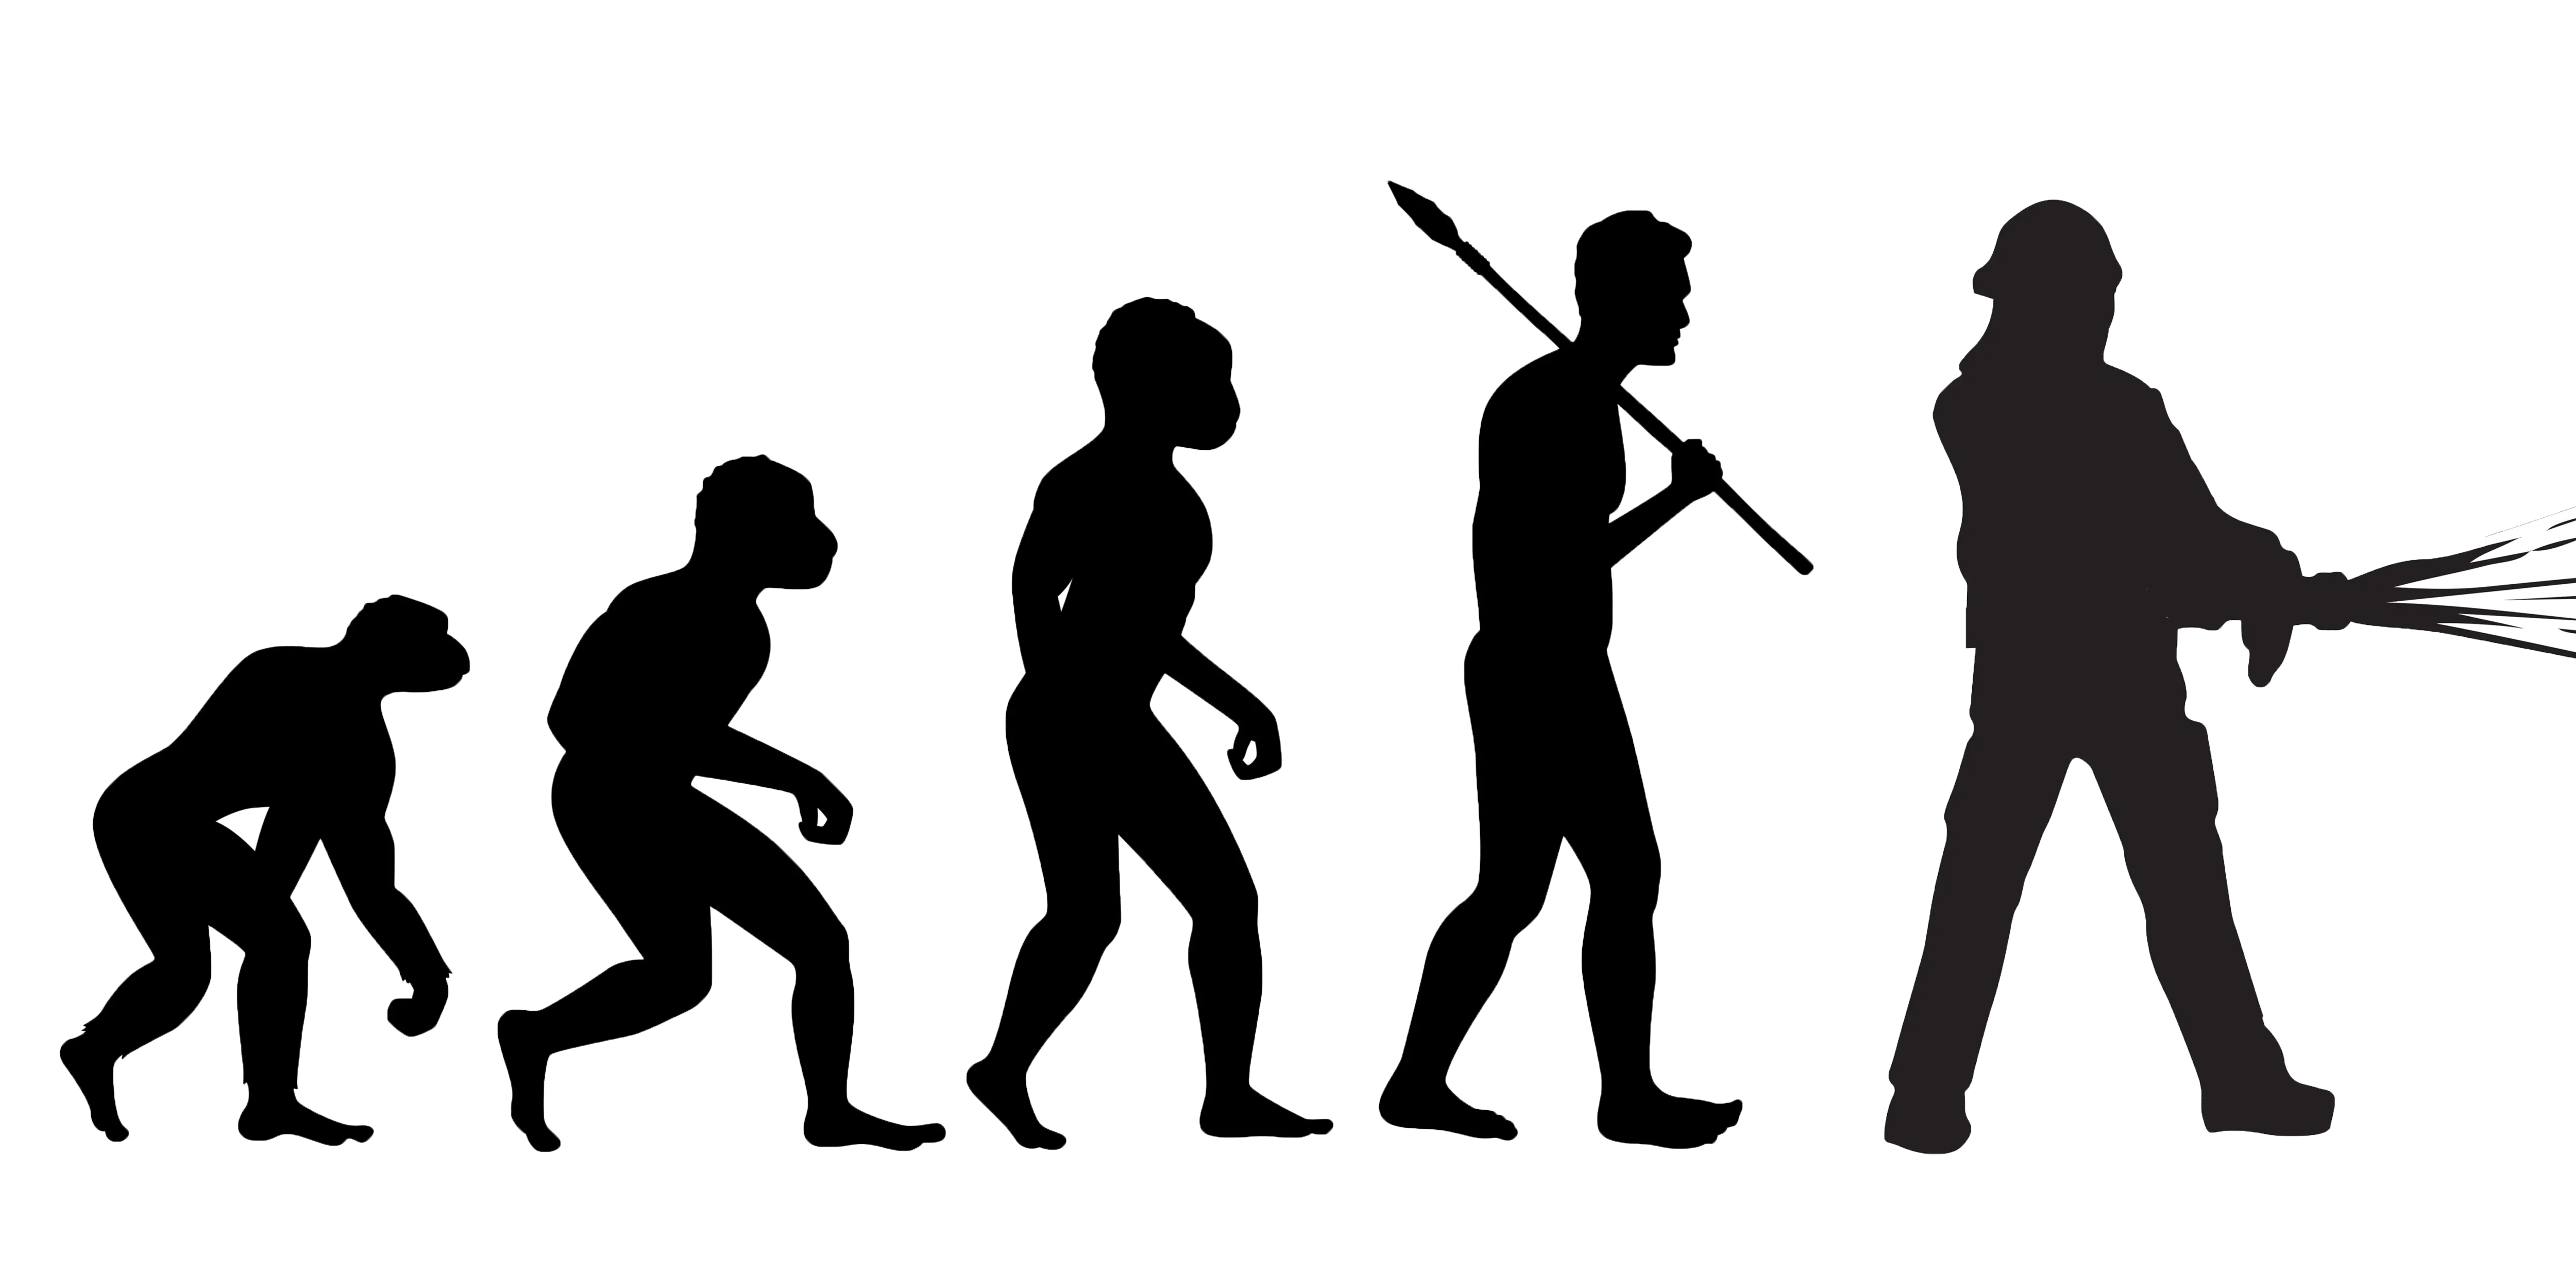
Evolution of Humanity Illustration -

Baseball Player Swinging Bat -

Splashing Water Circle Illustration -

Forever 21 Brand Logo -

Mathematical Geometry and Graph Concepts -

Zigzag Down Arrow Icon for Decline Representation -

Silhouette of Crawling Baby -

Bar Chart with Upward Arrow -

Infographic Pencil with Data Elements -

Graph Plot with Blue Curve Illustration -
National Minority Supplier Development Council Logo -

Search Growth Icon -

Java Logo with Steaming Cup -
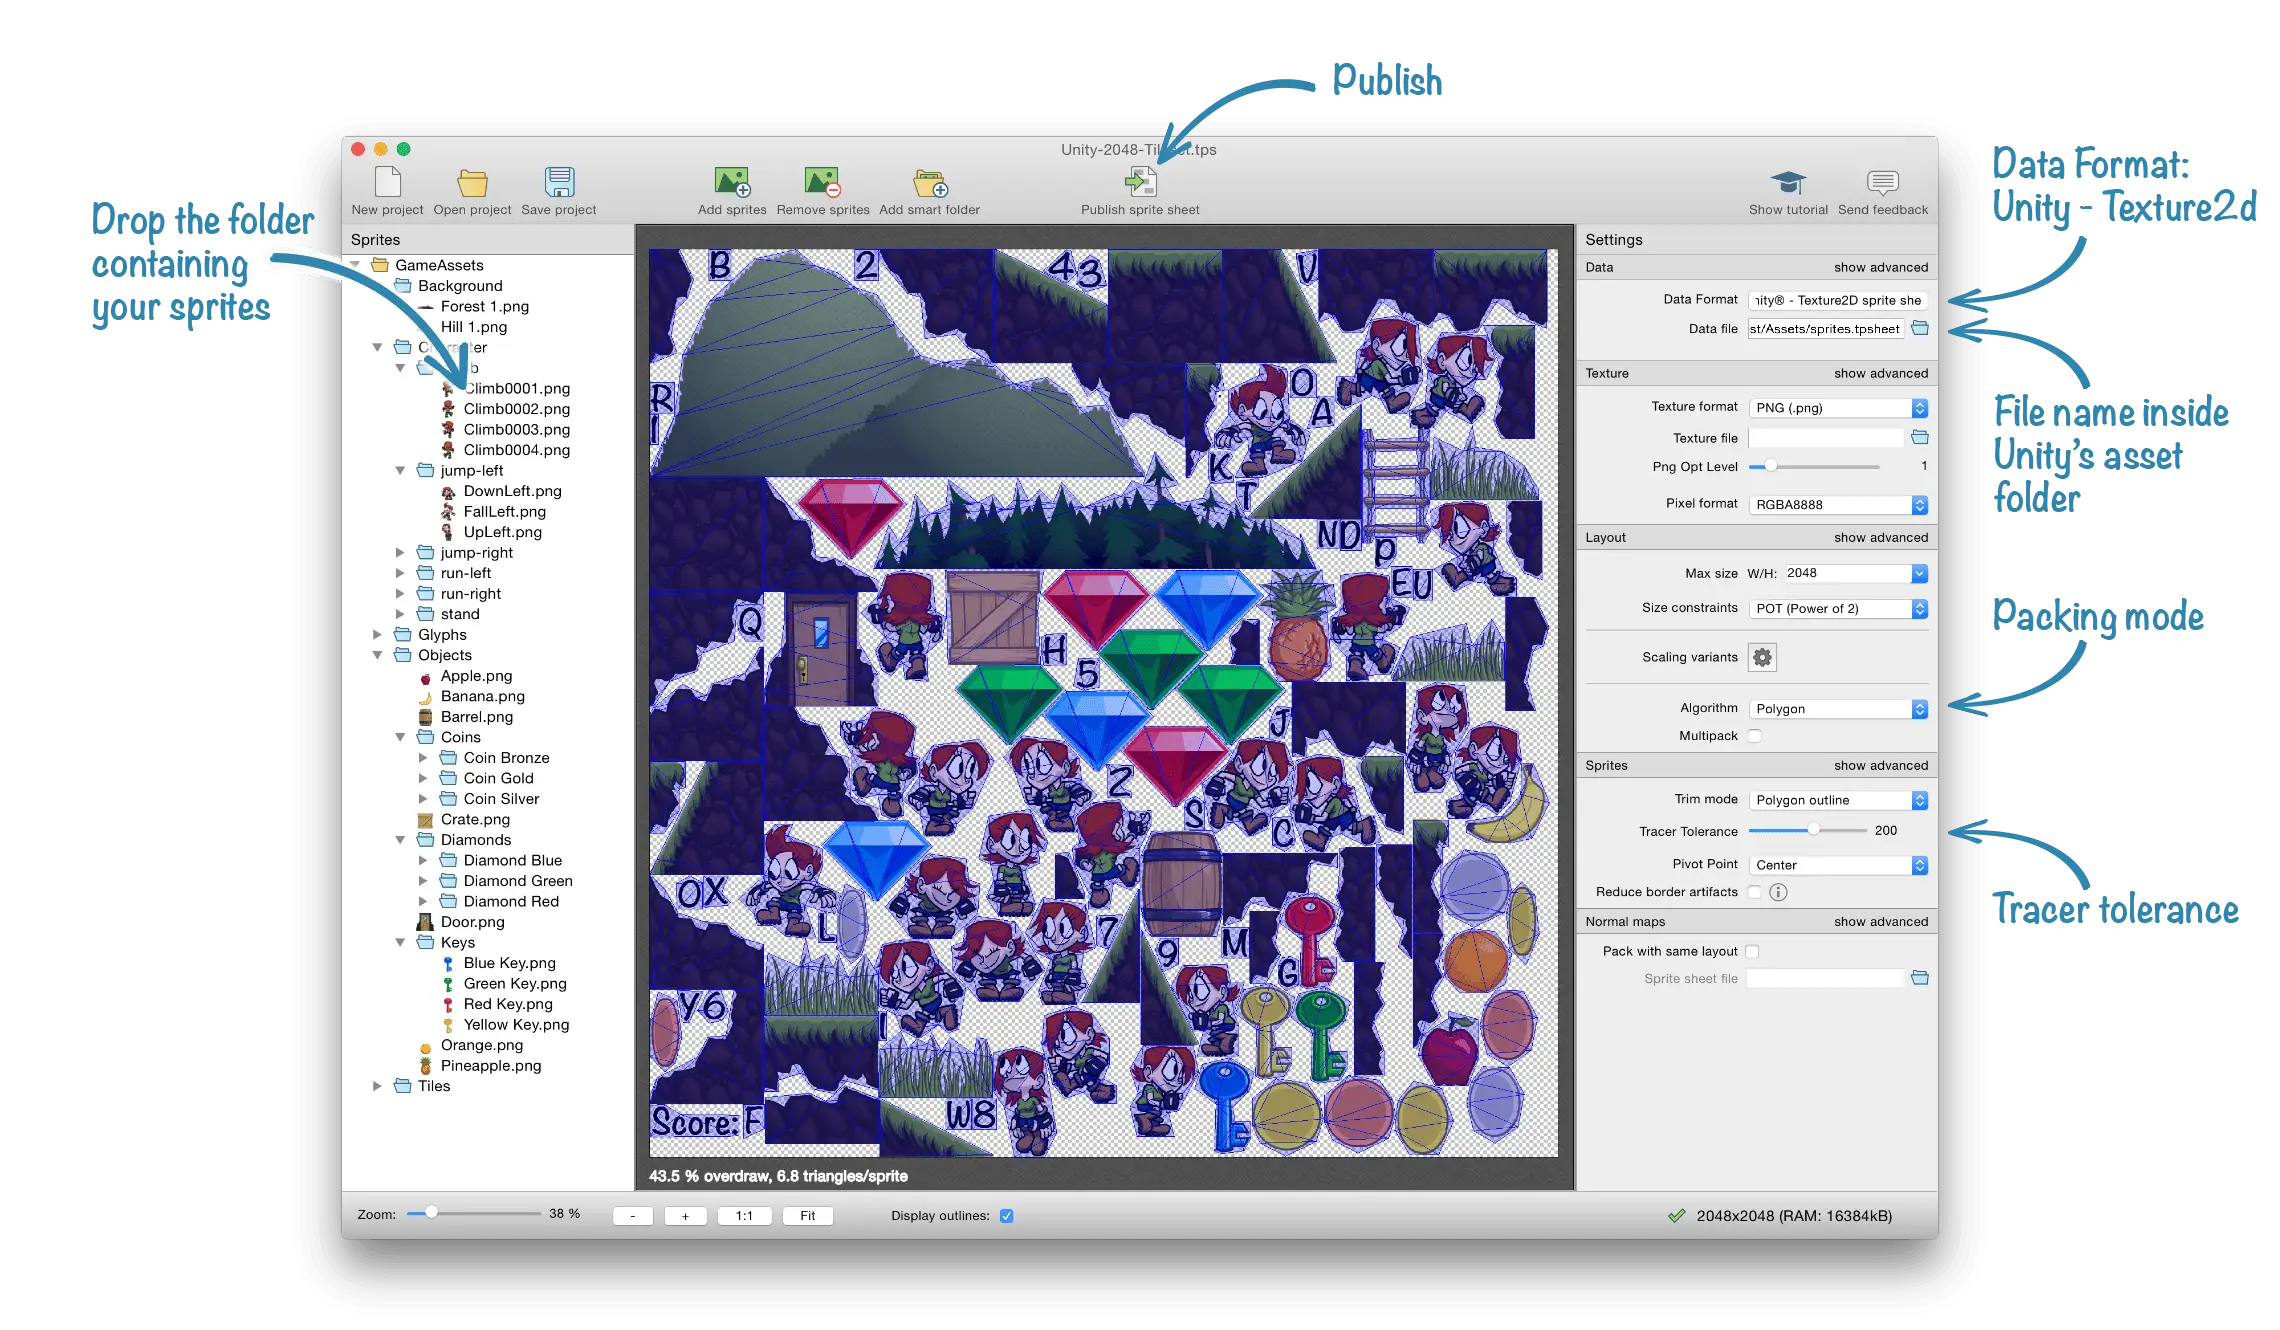
Game Development Interface with Assets -
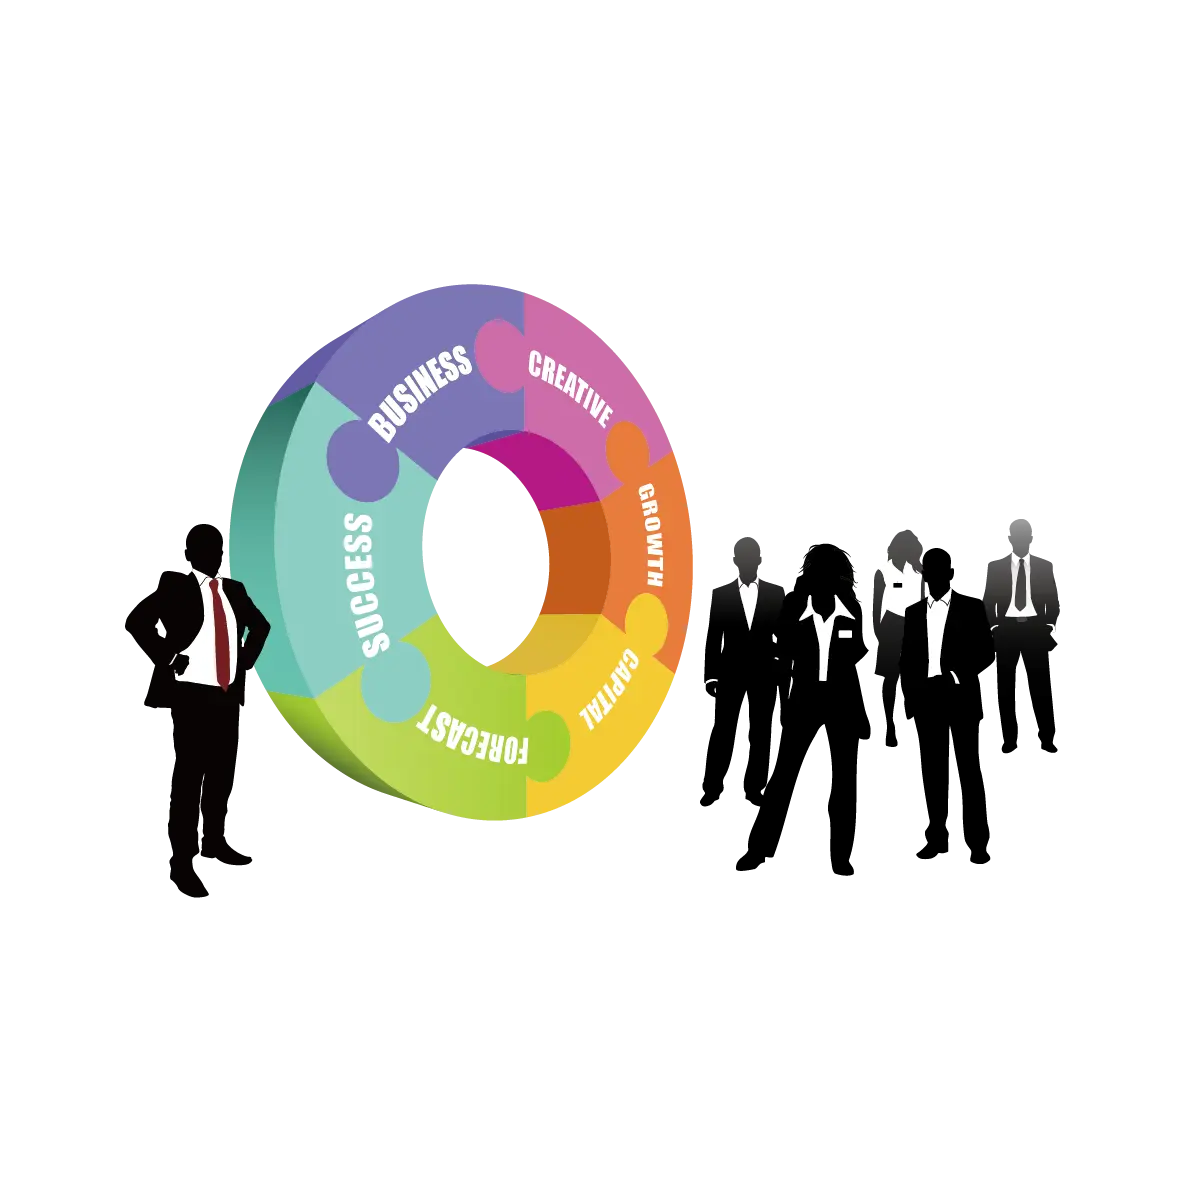
Business People with Circular Chart -
Work in Progress Sign -
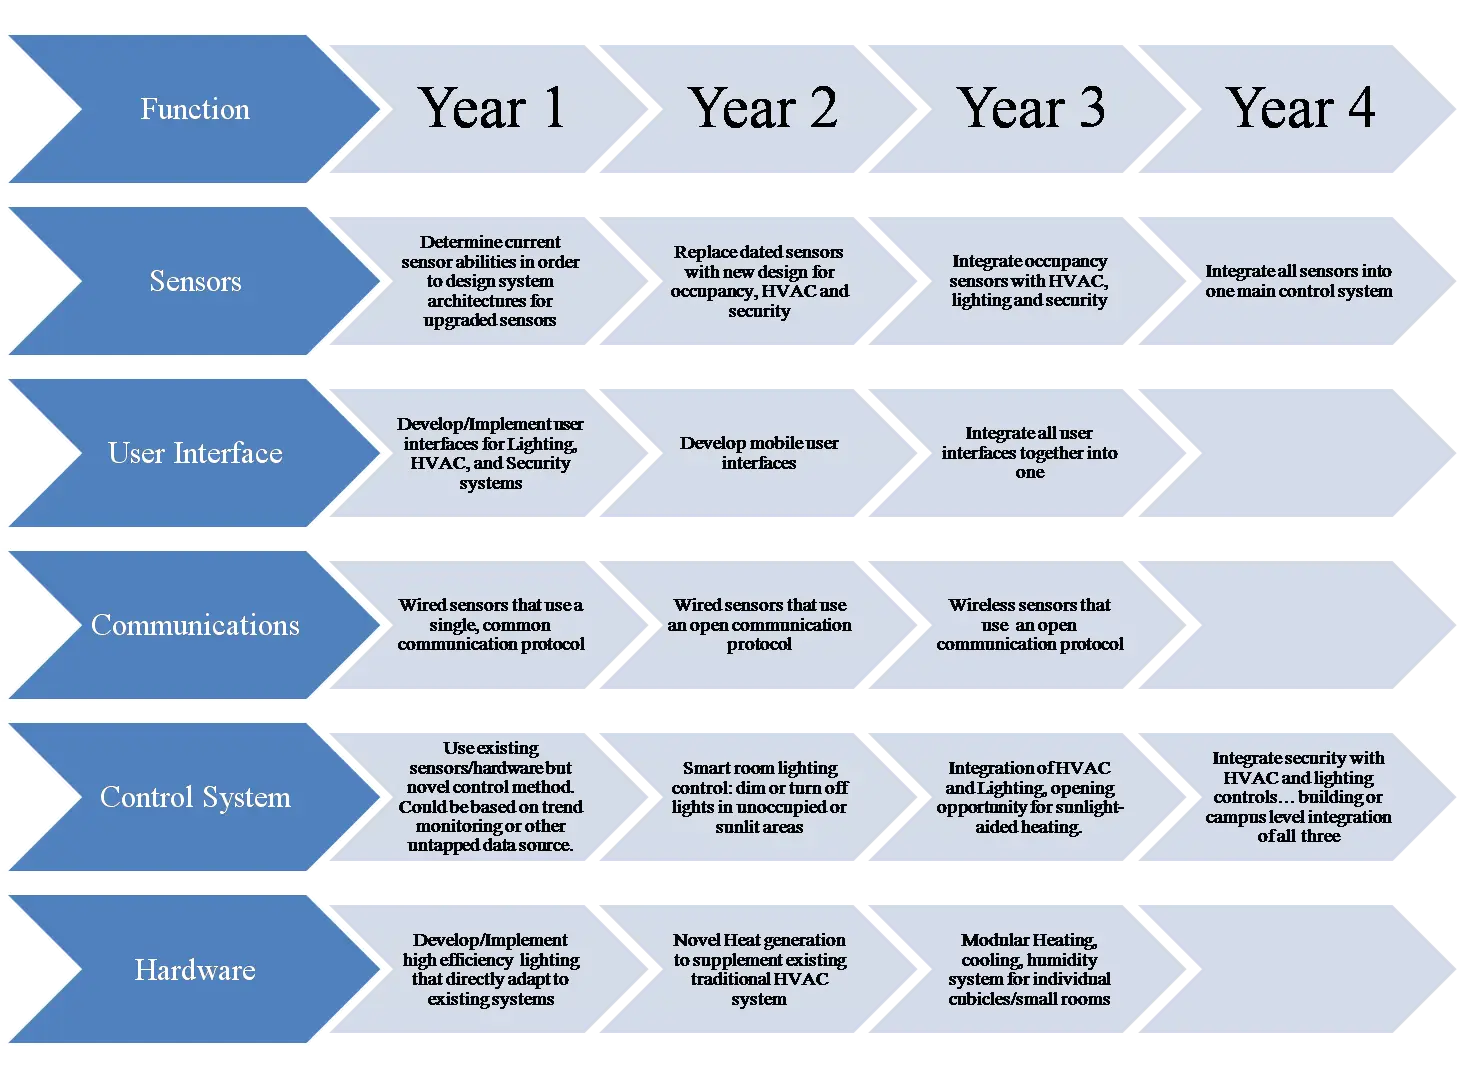
Development Roadmap for Project Planning -

3D Coordinate System Illustration -

Blue Declining Bar Graph with Arrow -

Circle Pie Chart Icon -

Python Logo for Programming Enthusiasts -

Mathematical Formula Equation -

Green Box with Arrows and Fire -

Traditional Abacus for Calculation and Learning -

Declining Chart Illustration -
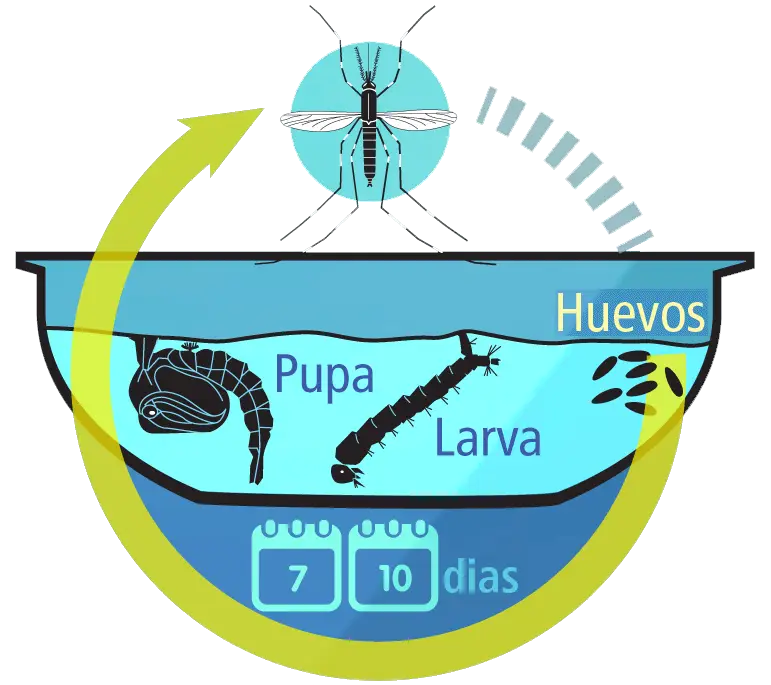
Mosquito Life Cycle Diagram -

Emerging Auckland Logo -

Triangle Diagram for Geometric Representation -

Magnifying Glass with Graph Illustration