
You Might Like
-
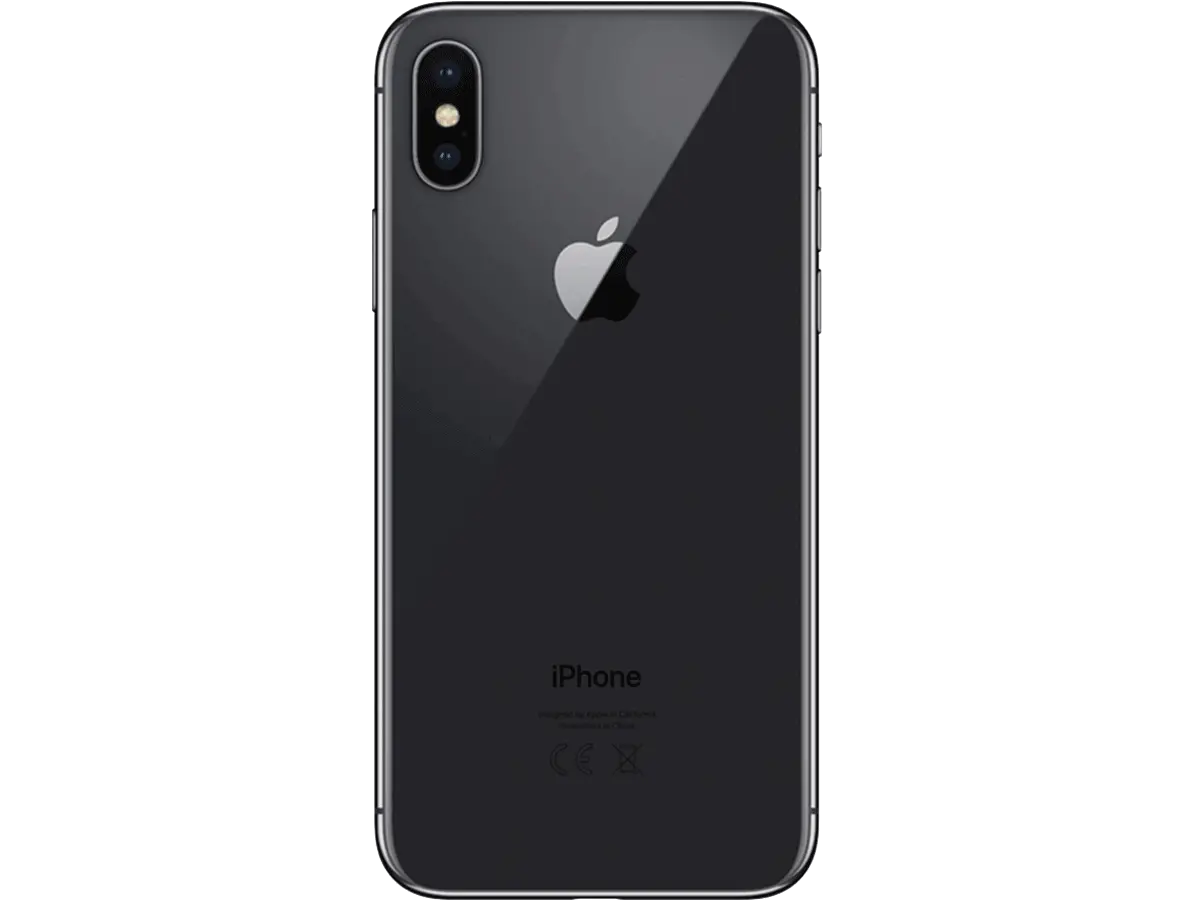
Black Smartphone Back View Design -
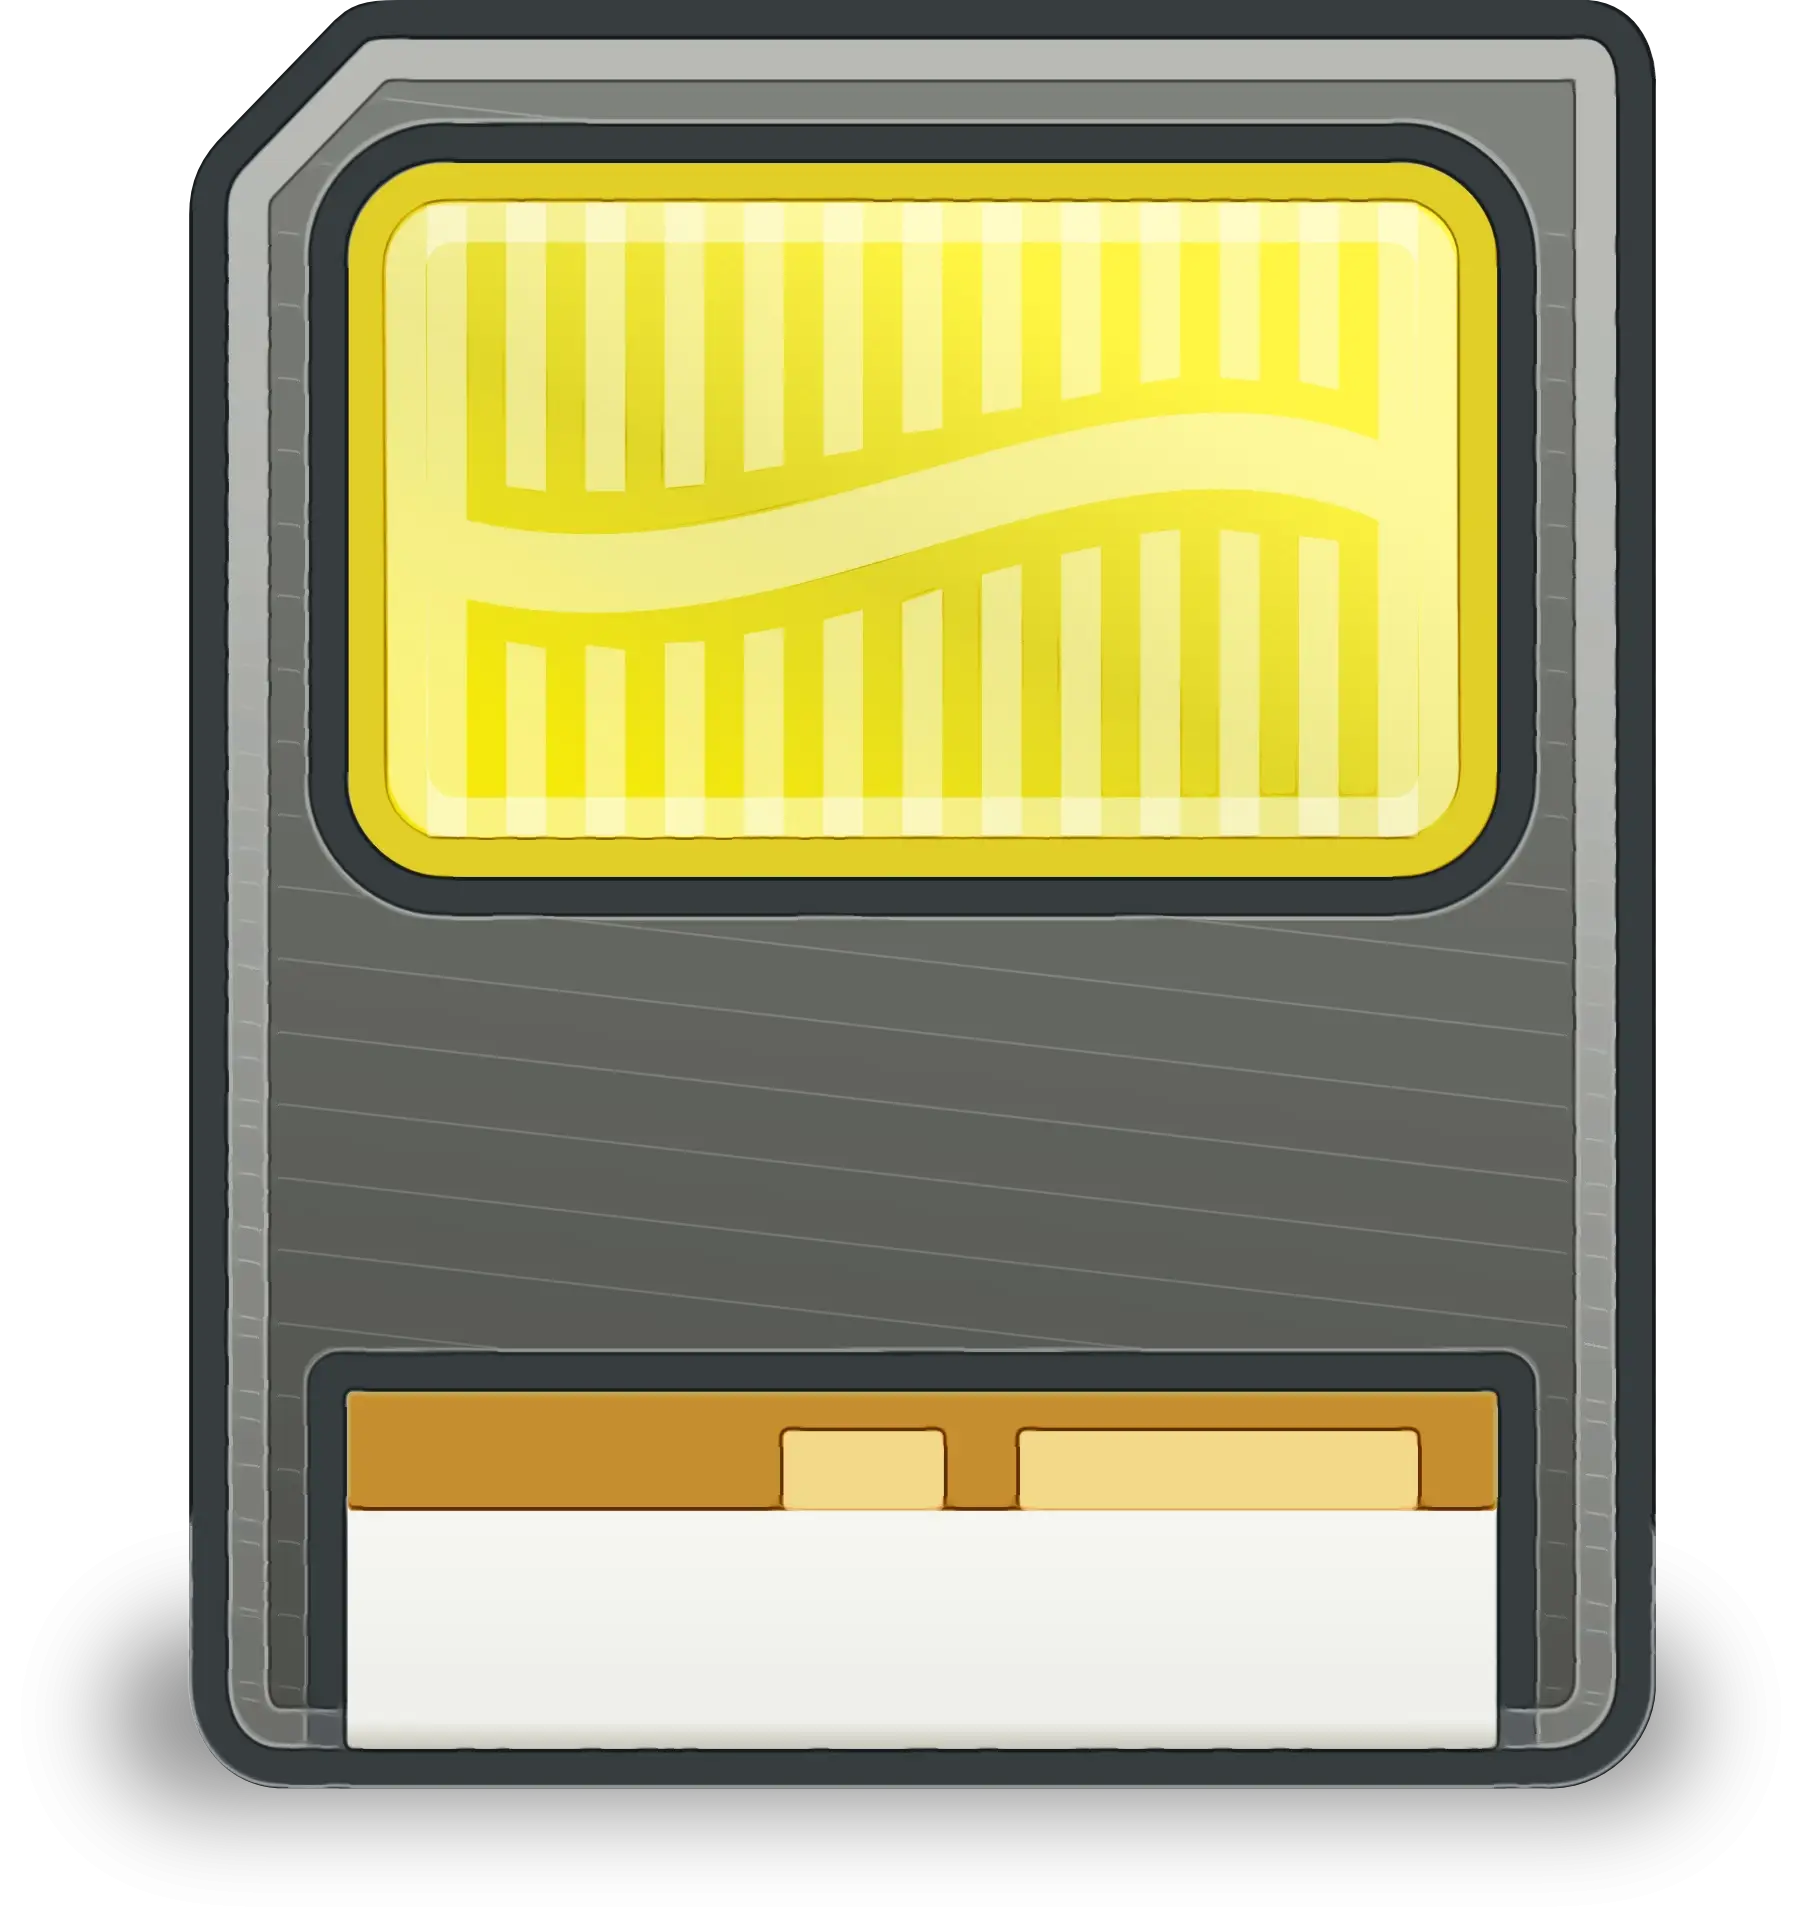
Illustration of a Memory Card -

Power Button Icon in Bold Black -
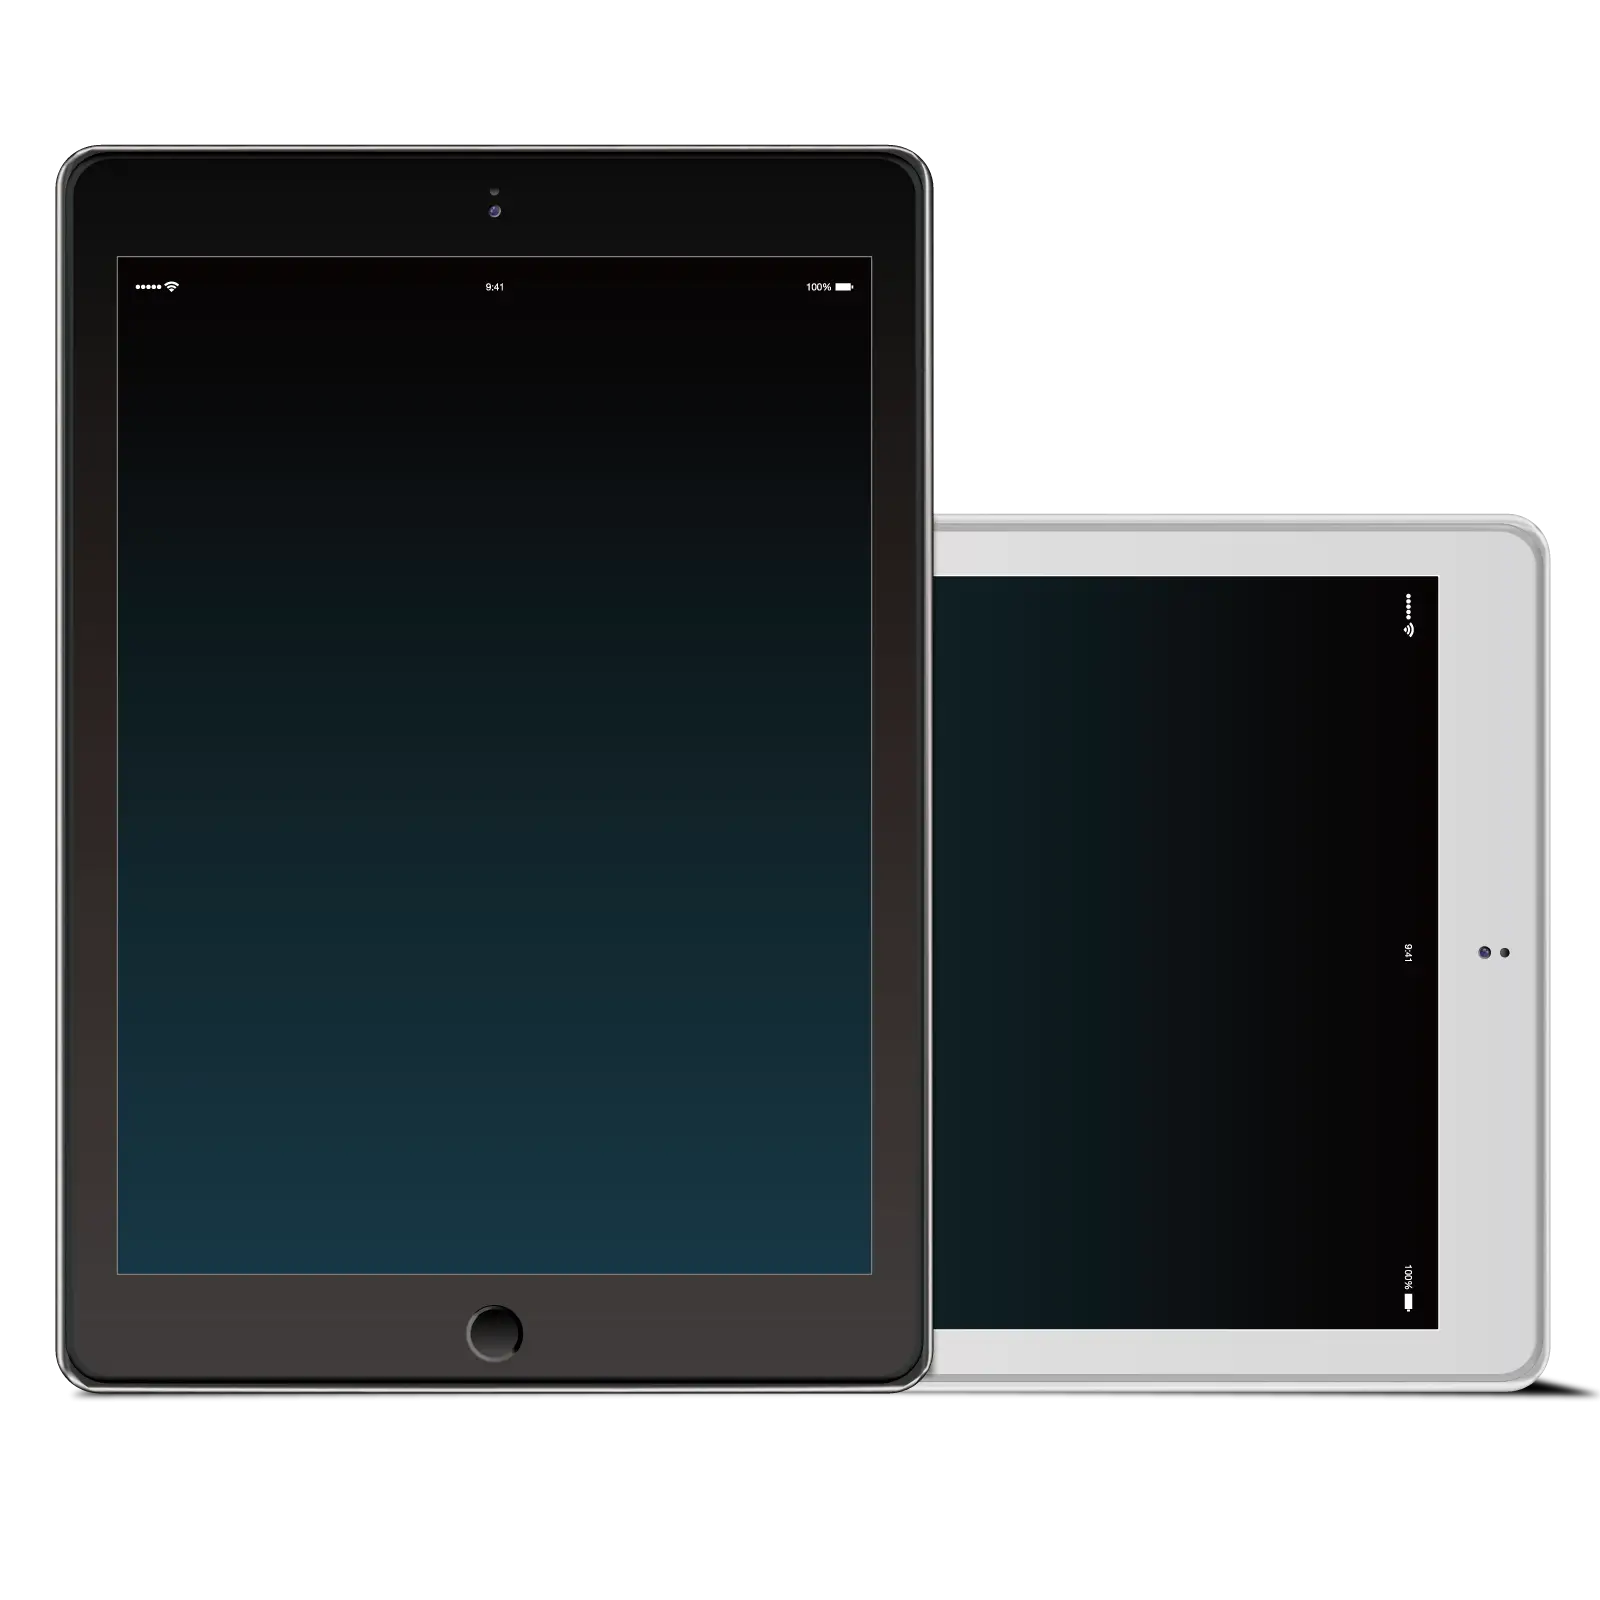
White Digital Tablet with Sleek Design -

Zigzag Down Arrow Icon for Decline Representation -
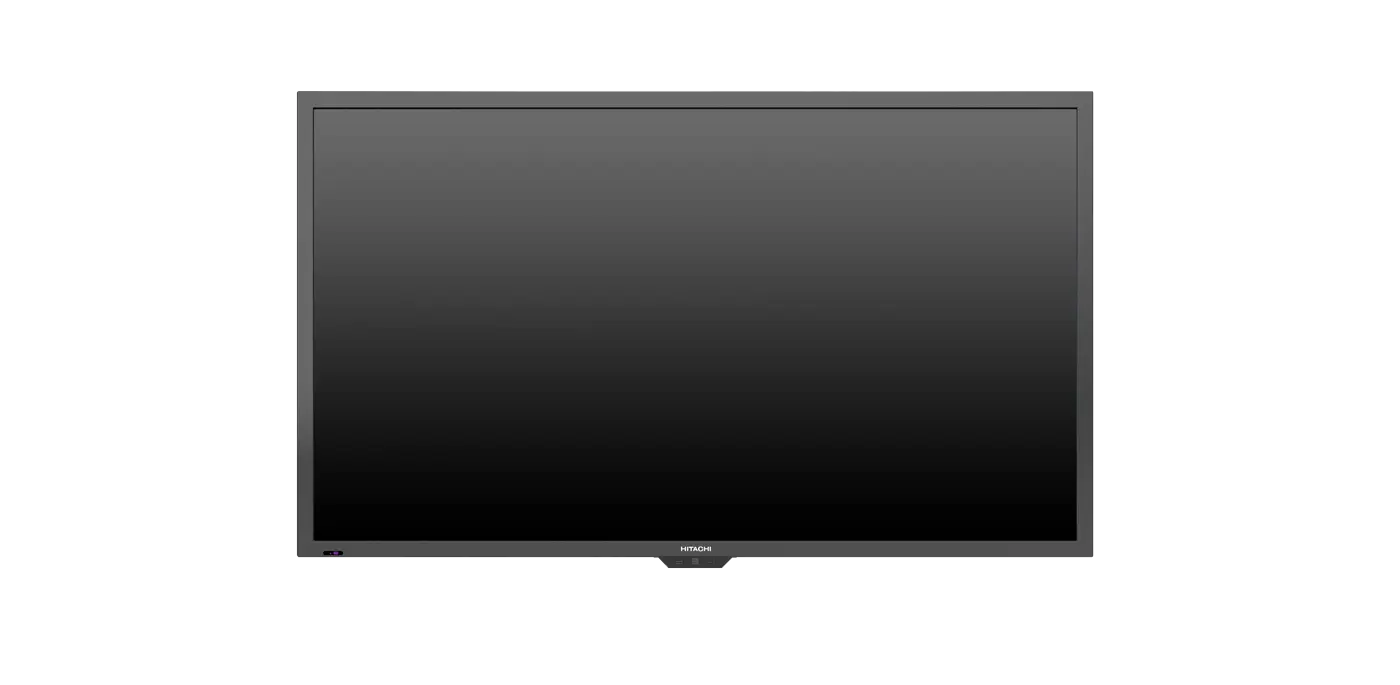
Sleek Black Flat Screen Television -

Hand Using Black Computer Mouse -
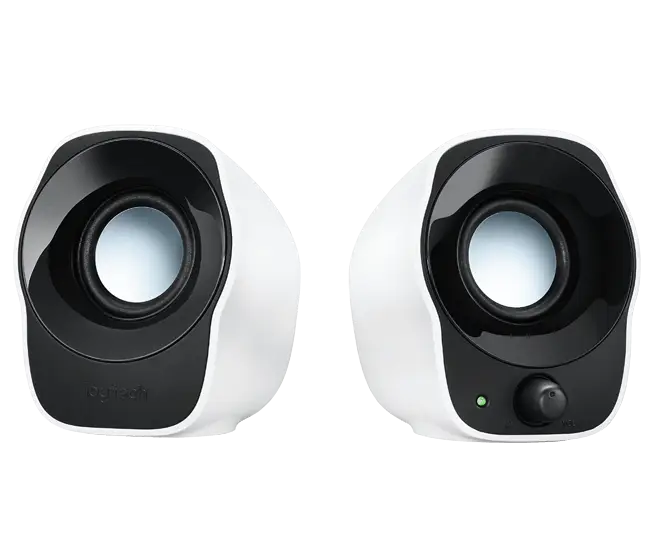
Compact Speakers for Clear Audio Experience -
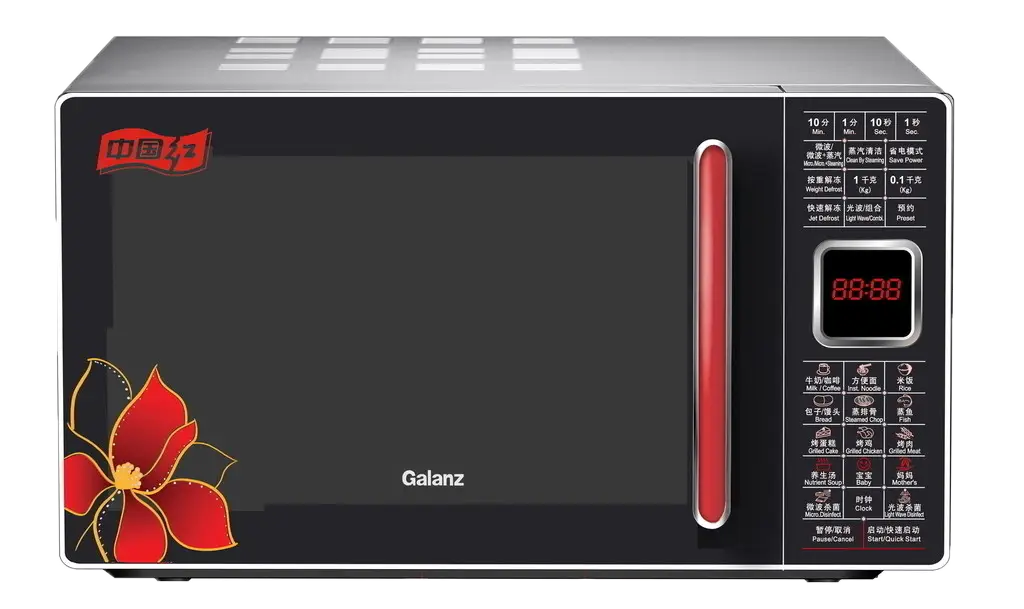
Modern Microwave Oven -
Black and White Tablet Device Icon -
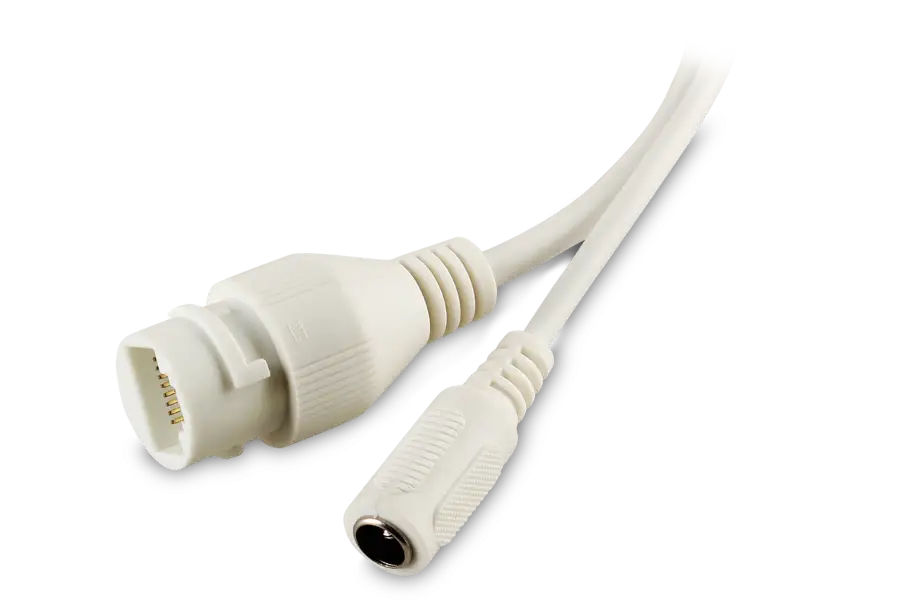
White Cable Connector for Technology Devices -
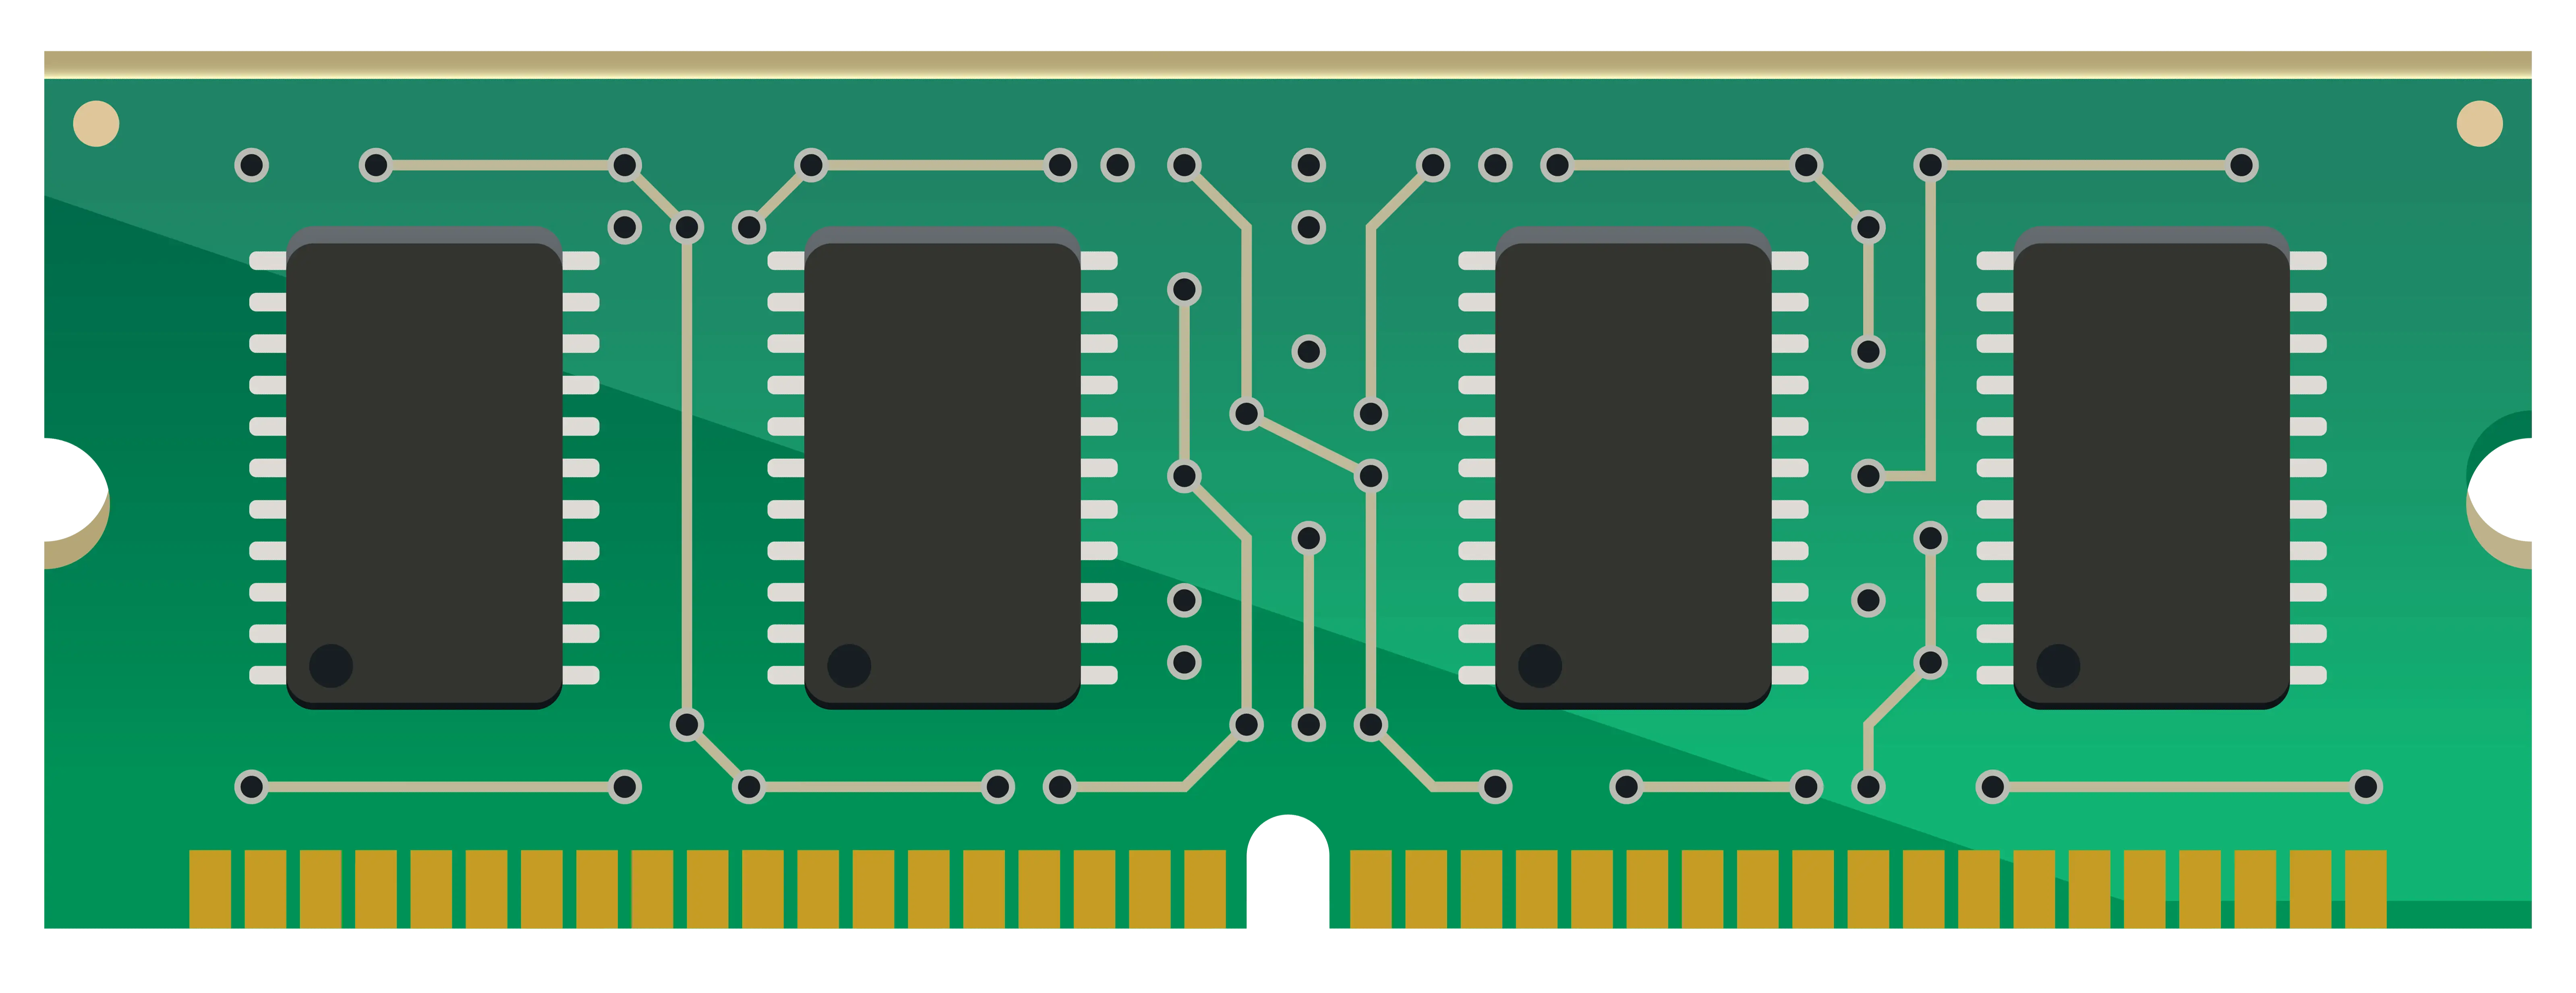
Green RAM Memory Module -

Assorted Office Supplies and Gadgets -
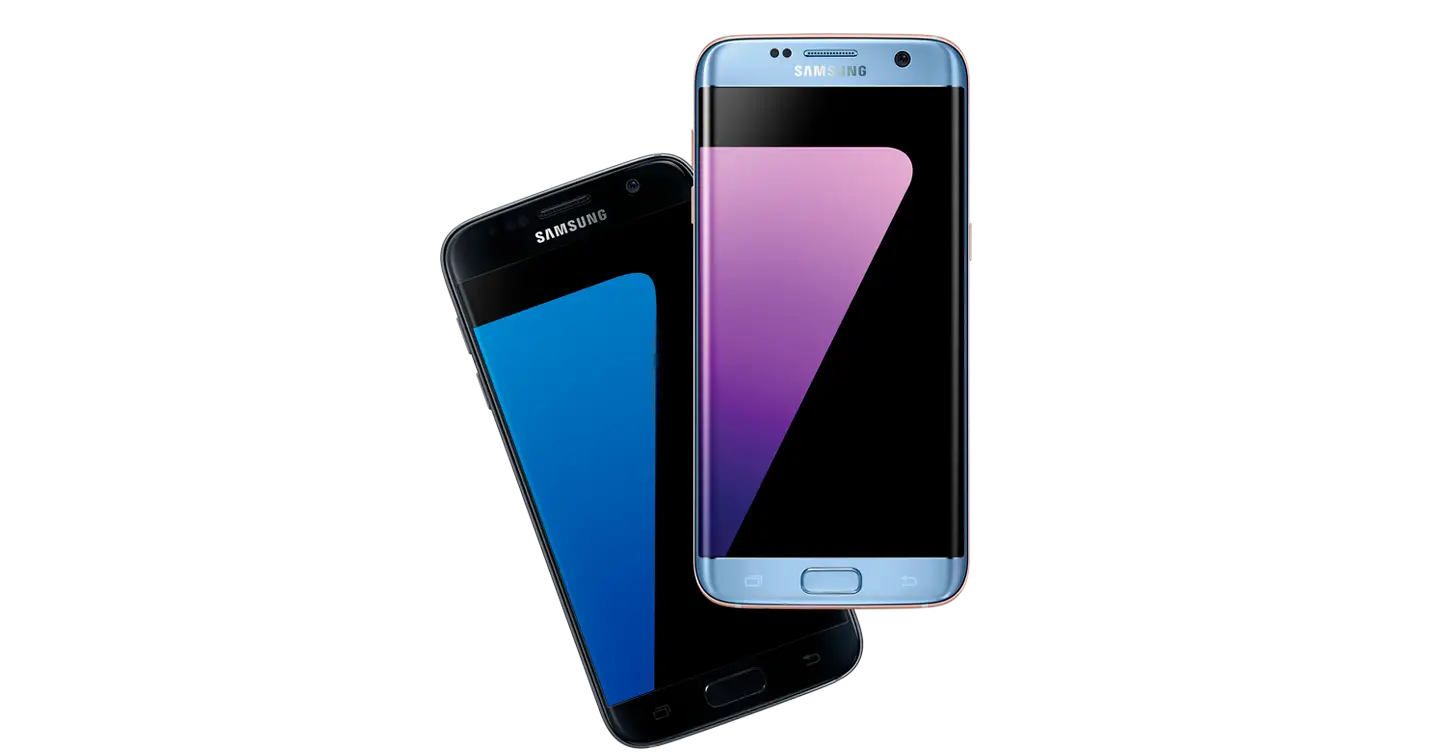
Samsung Smartphones in Black and Blue -

Blue Declining Bar Graph with Arrow -

Circle Pie Chart Icon -
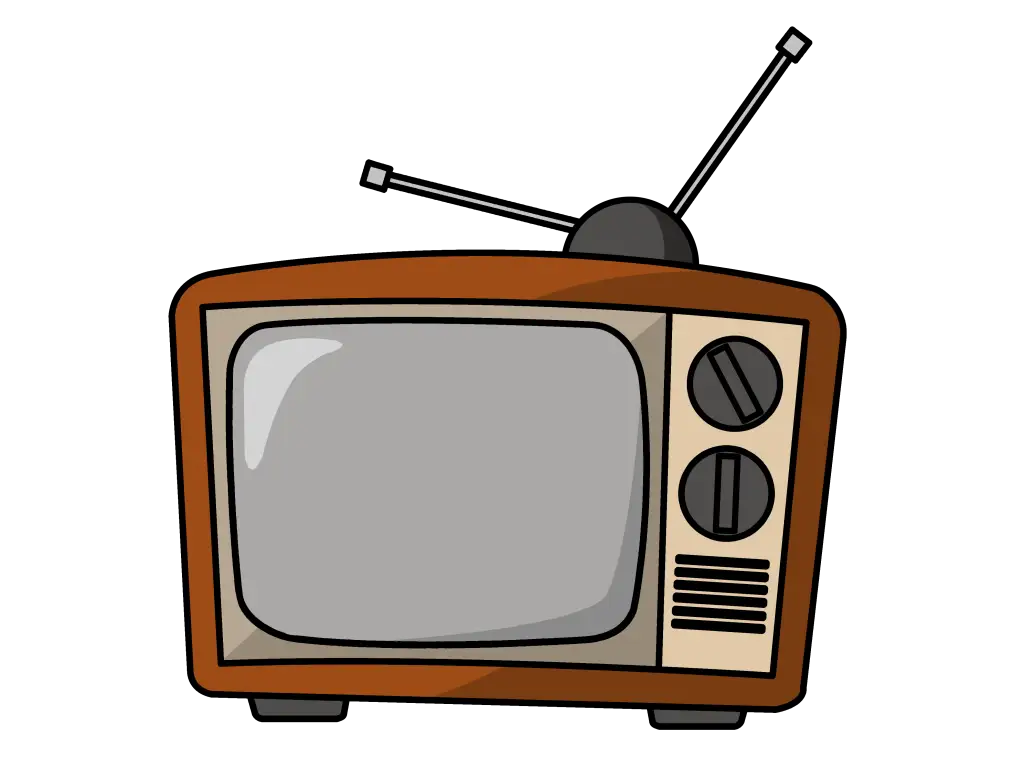
Vintage Television with Antenna Illustration -
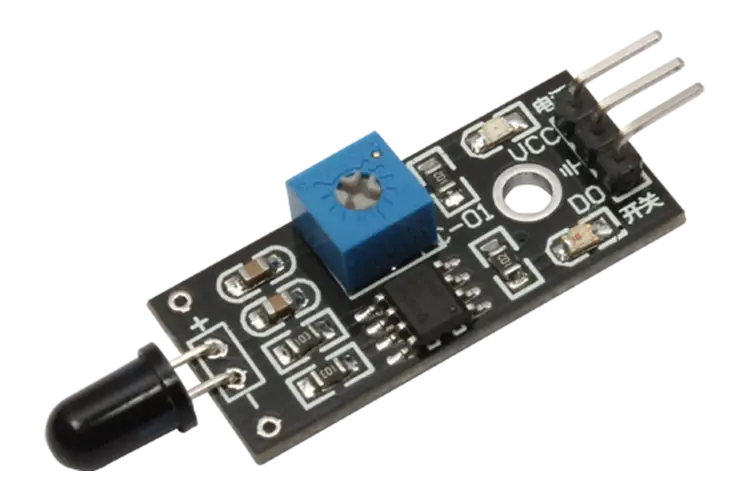
Infrared Sensor Module Design -
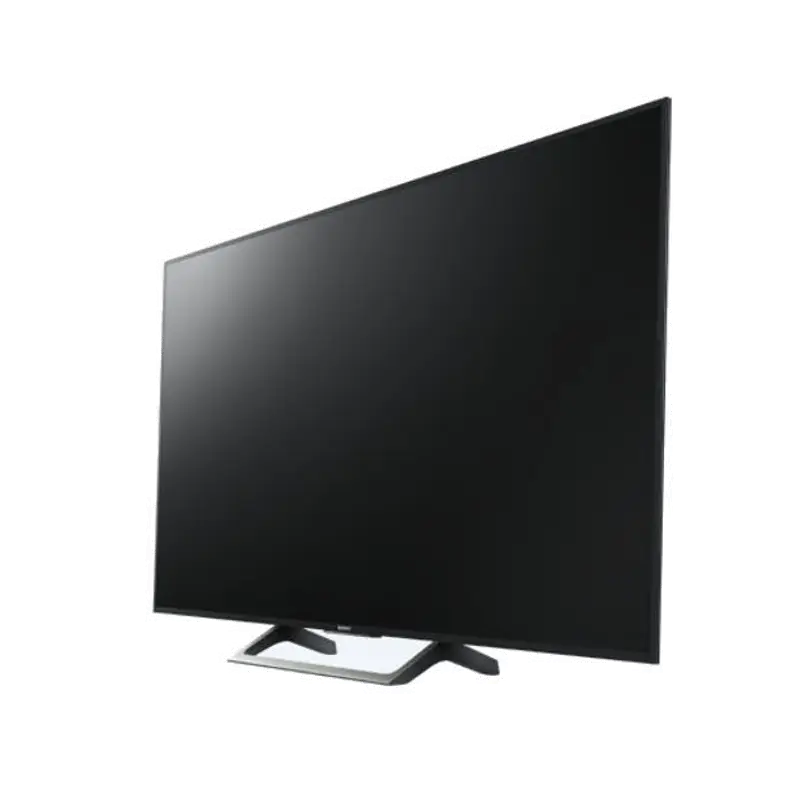
Modern Flat-Screen Television Design -
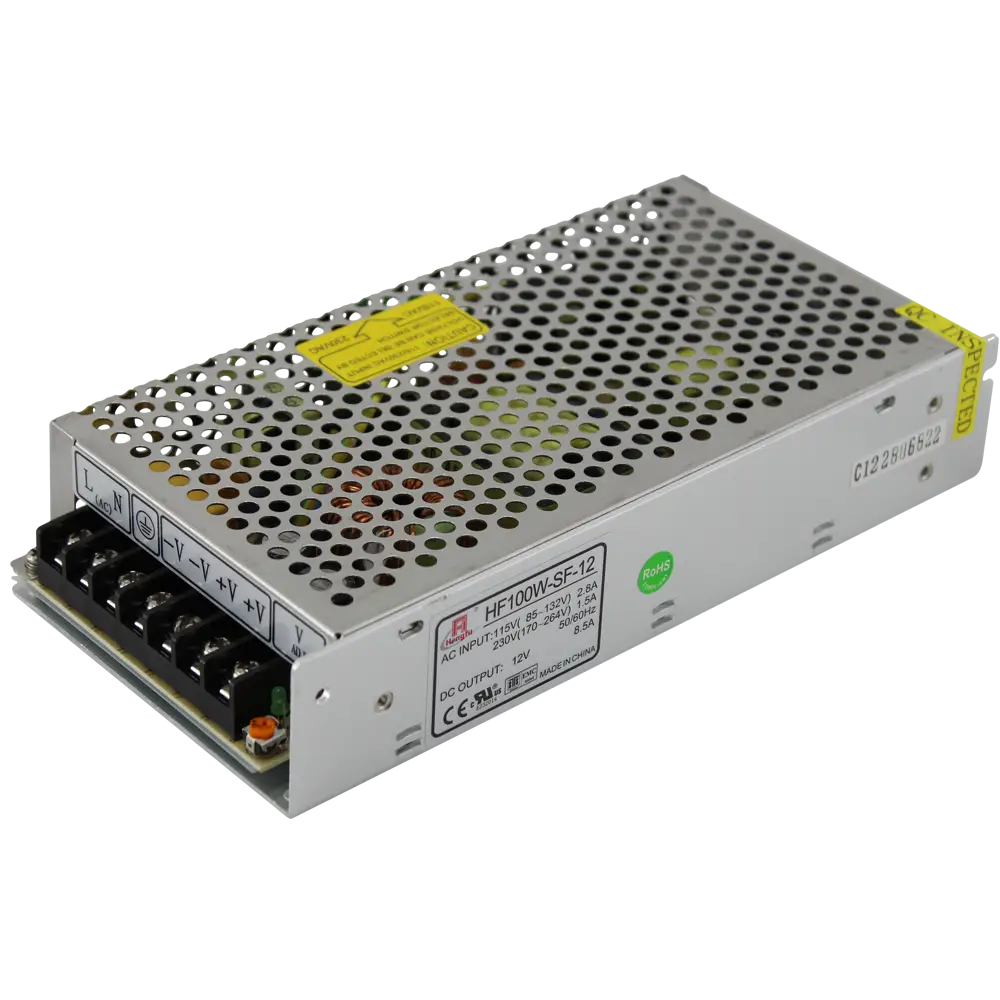
Metal Power Supply Unit for Electronics -

Declining Chart Illustration -
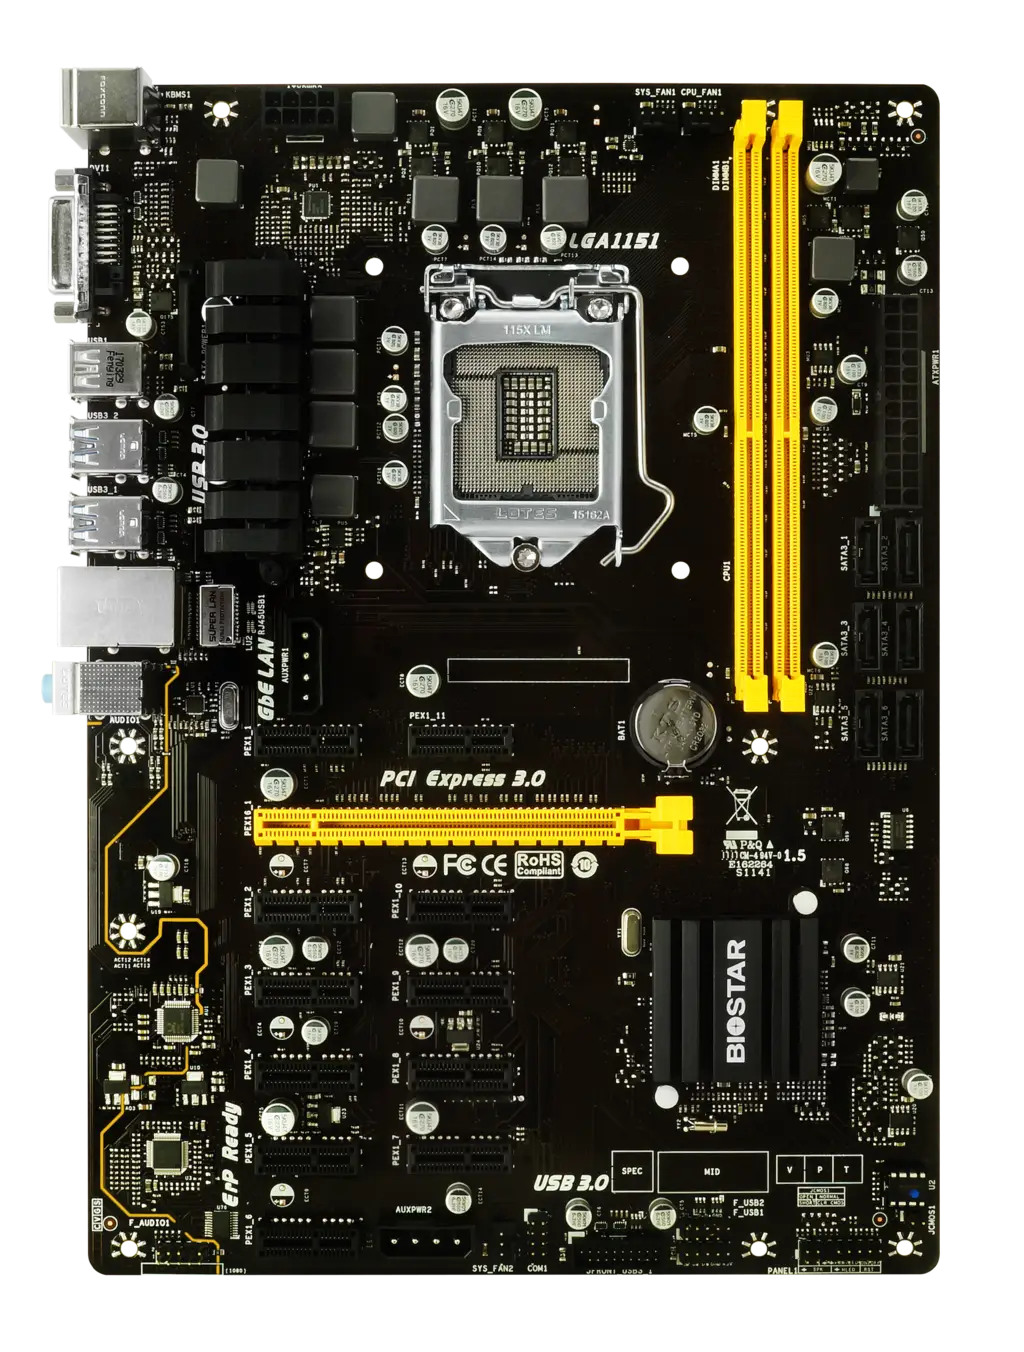
Computer Motherboard Circuit Board -
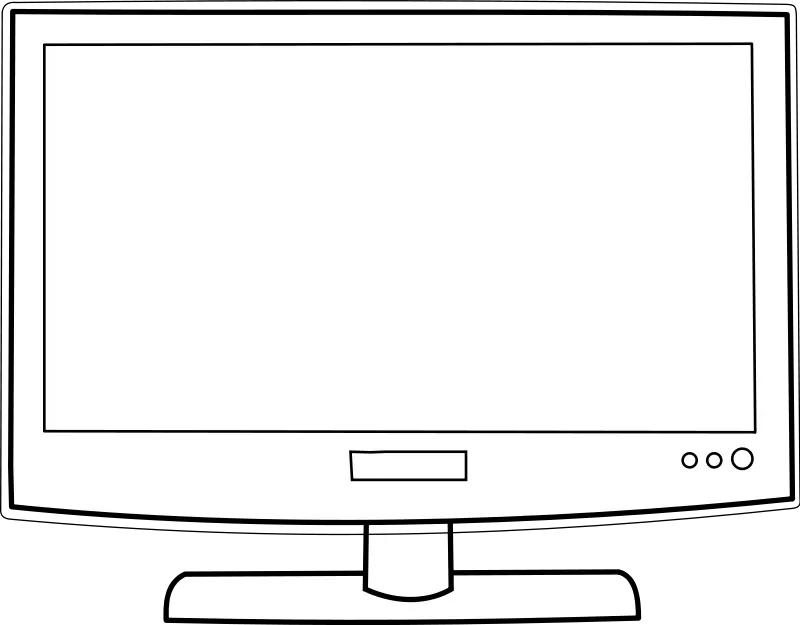
Television Outline Sketch for Educational Use -
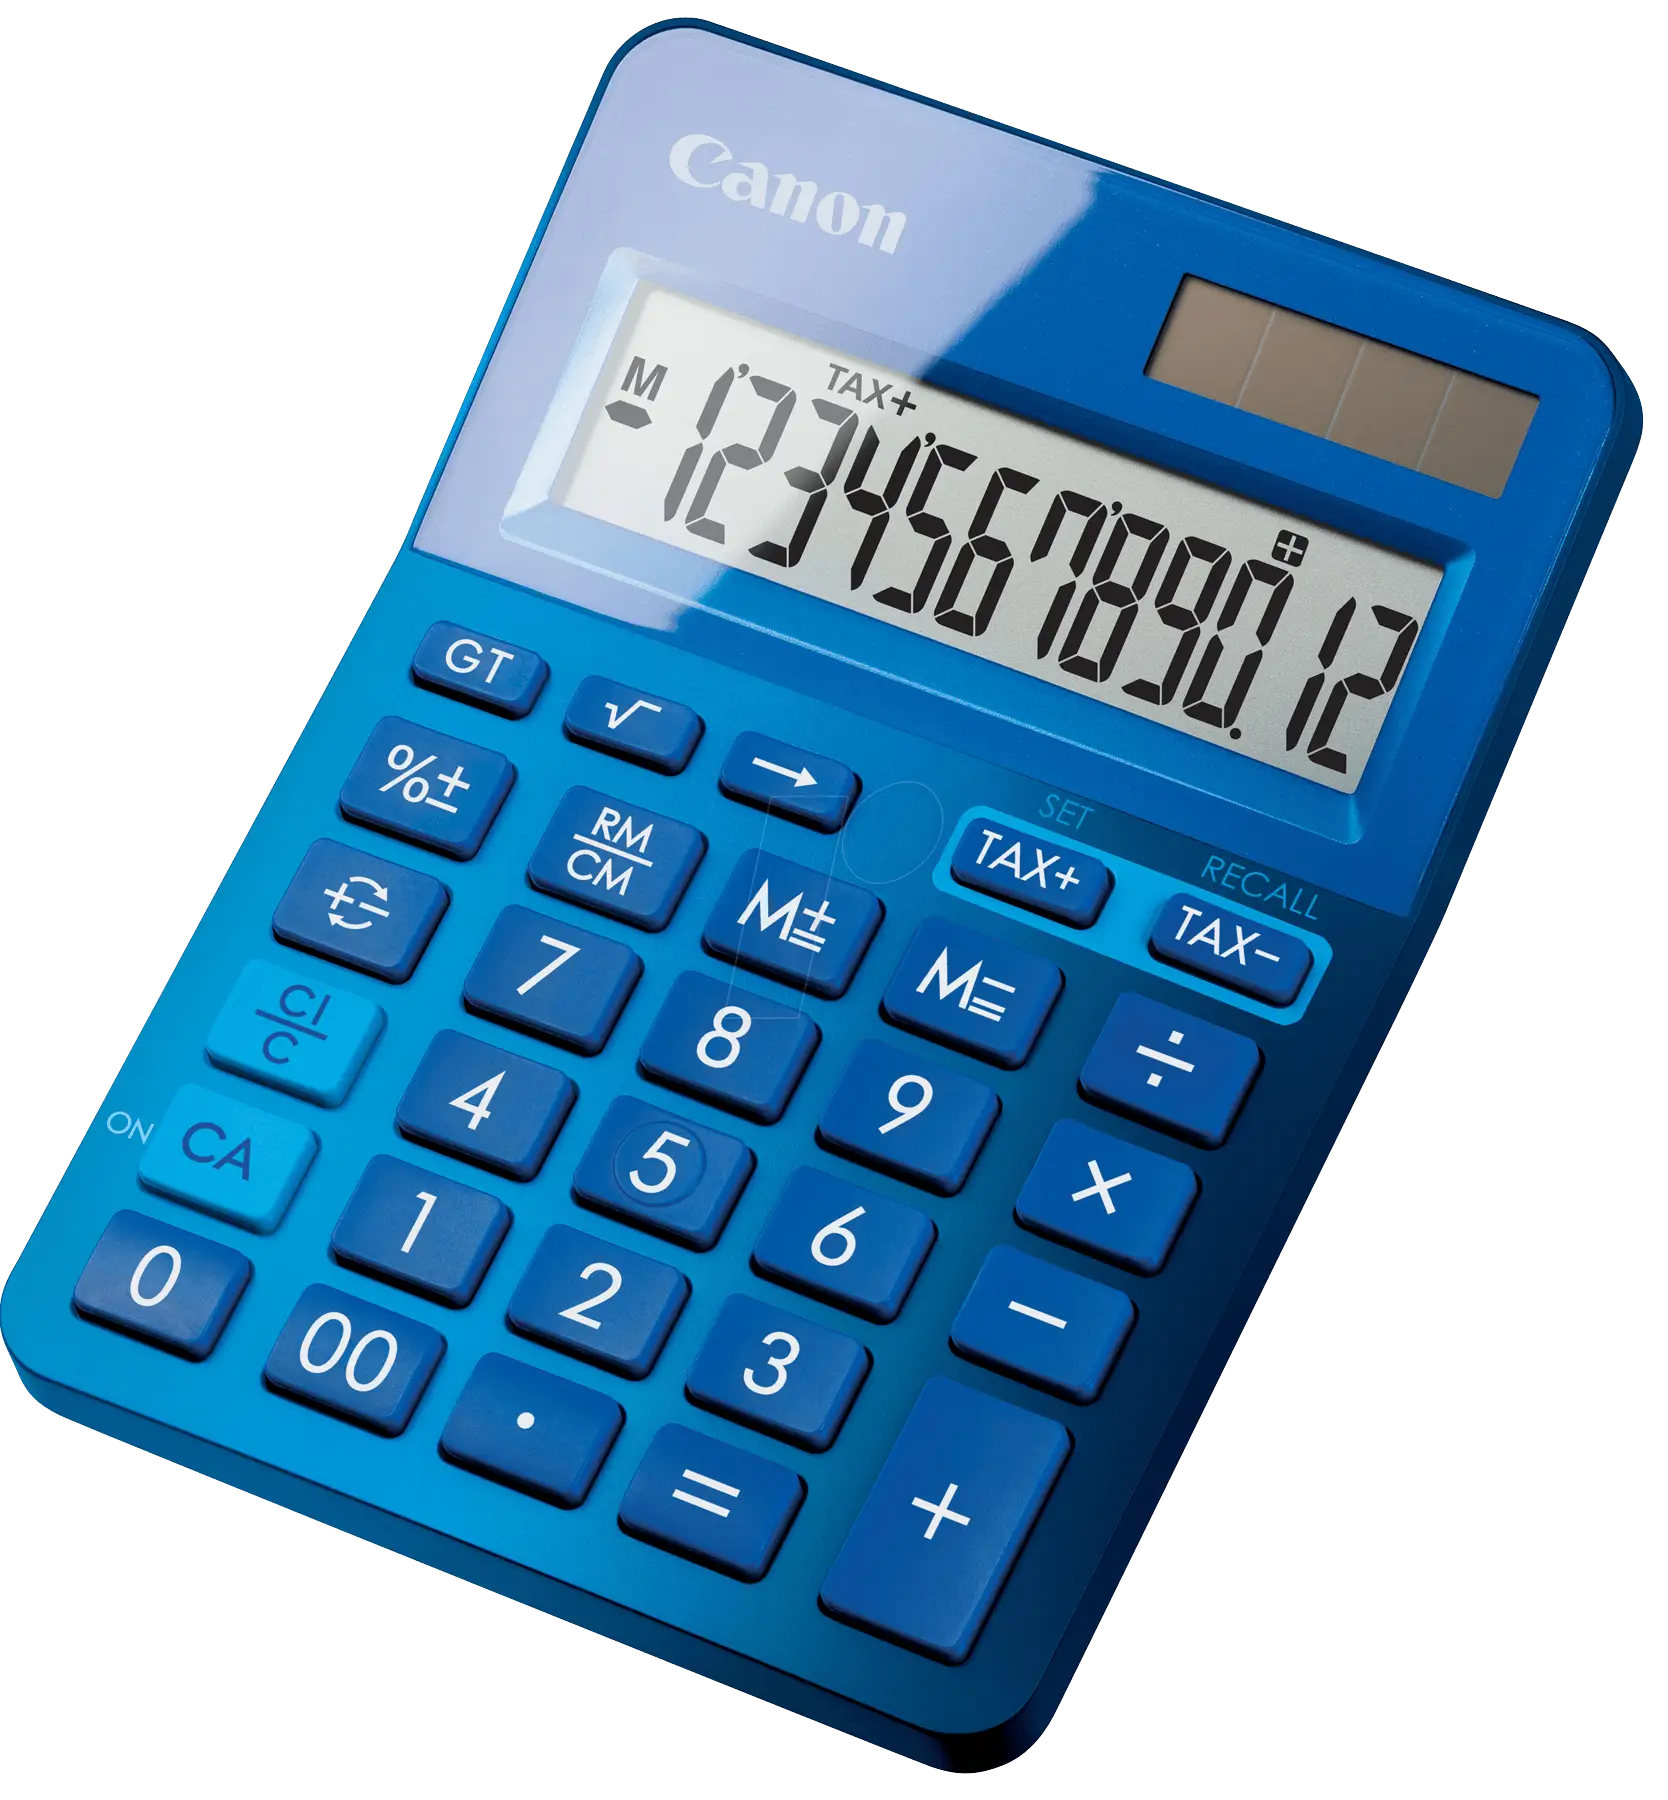
Blue Electronic Calculator for Office and School -
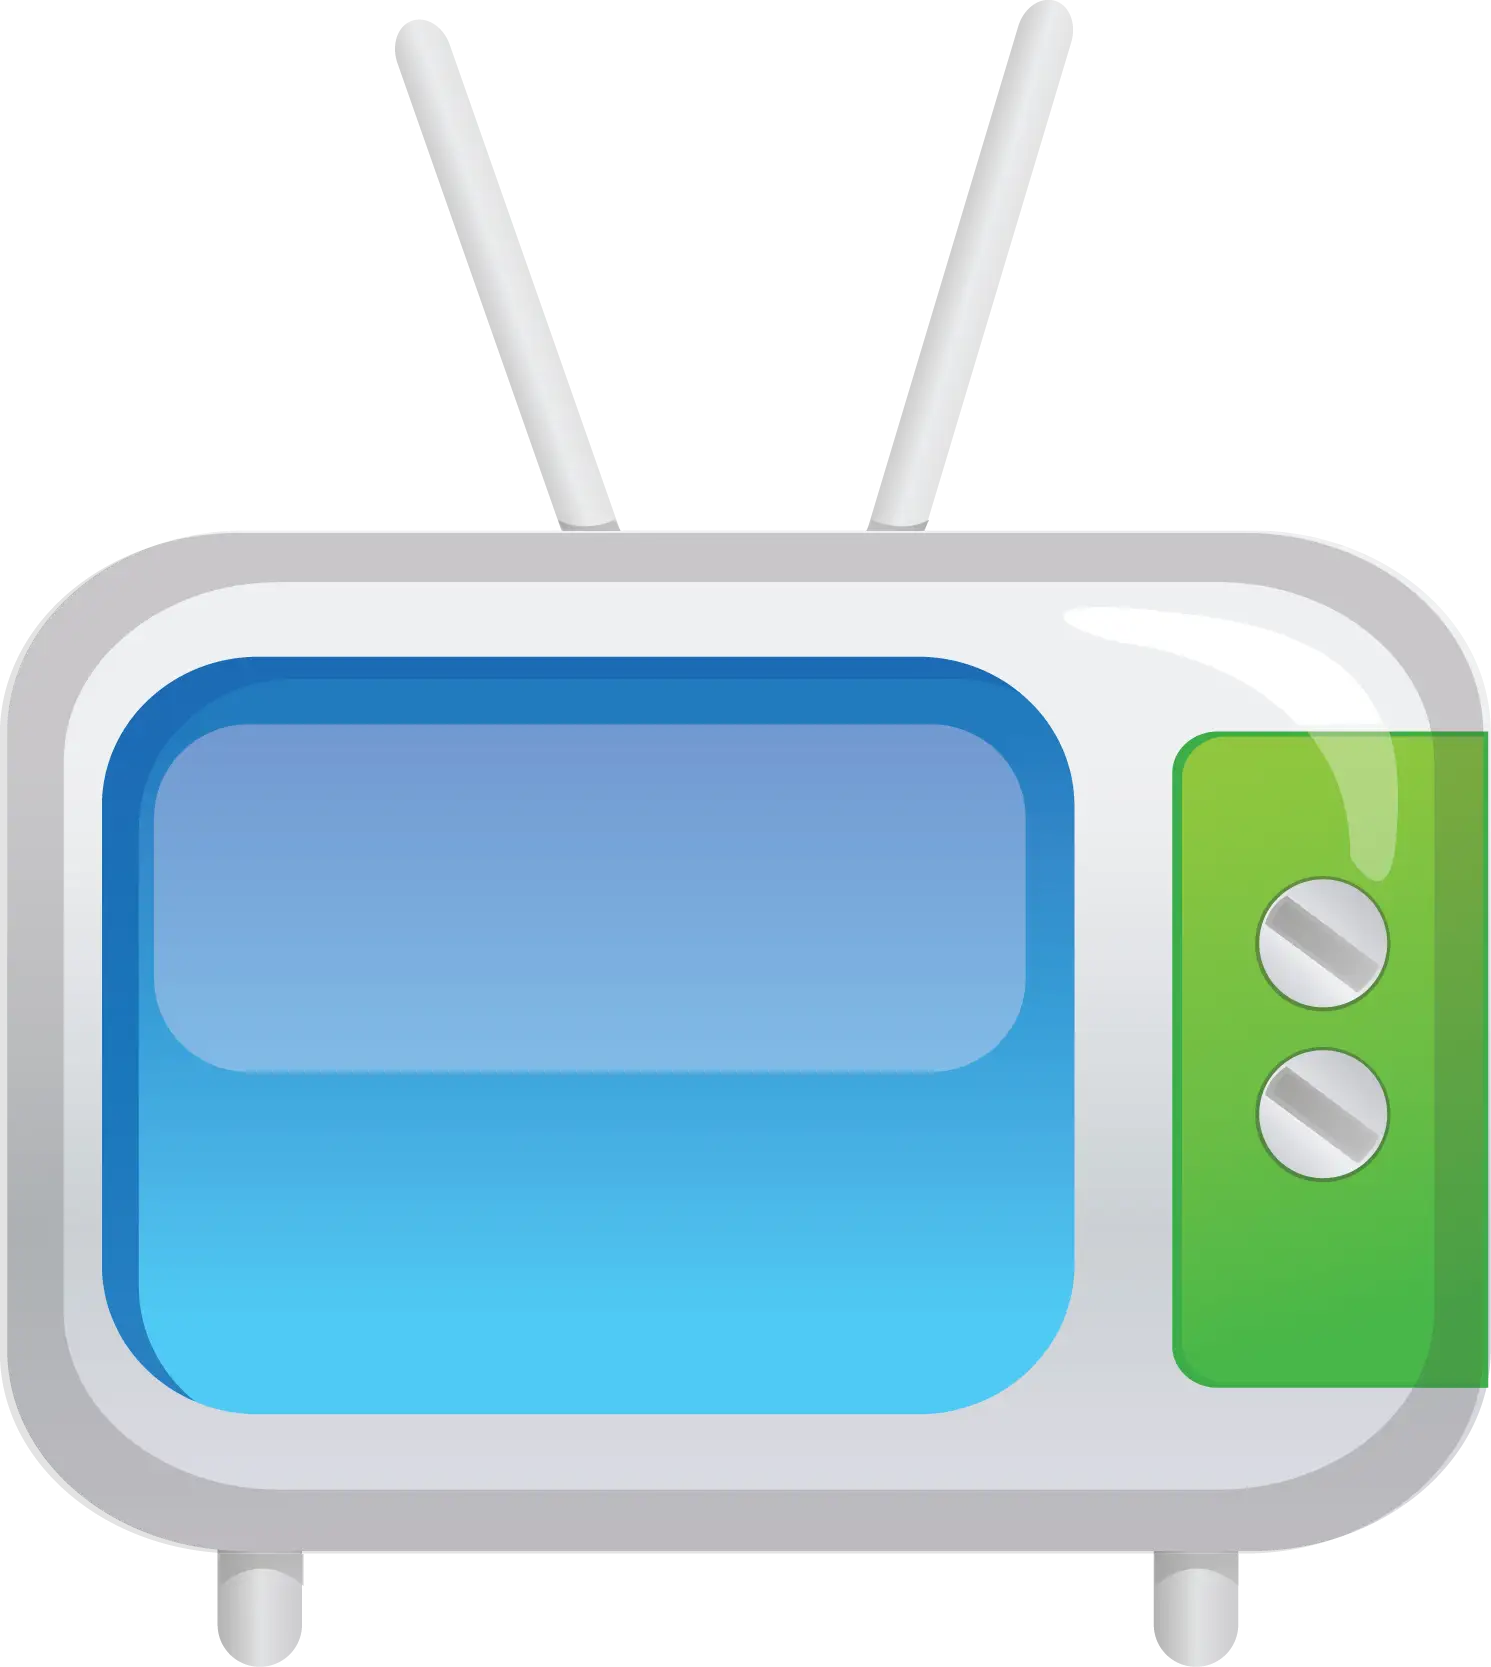
Cartoon Television Icon with Blue and Green Design -

Magnifying Glass with Graph Illustration -
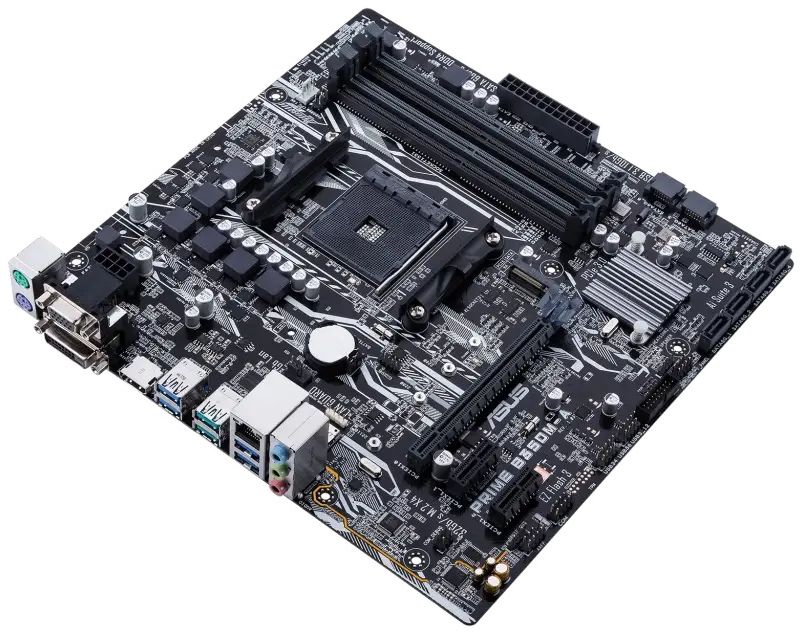
Modern Computer Motherboard with Advanced Components -
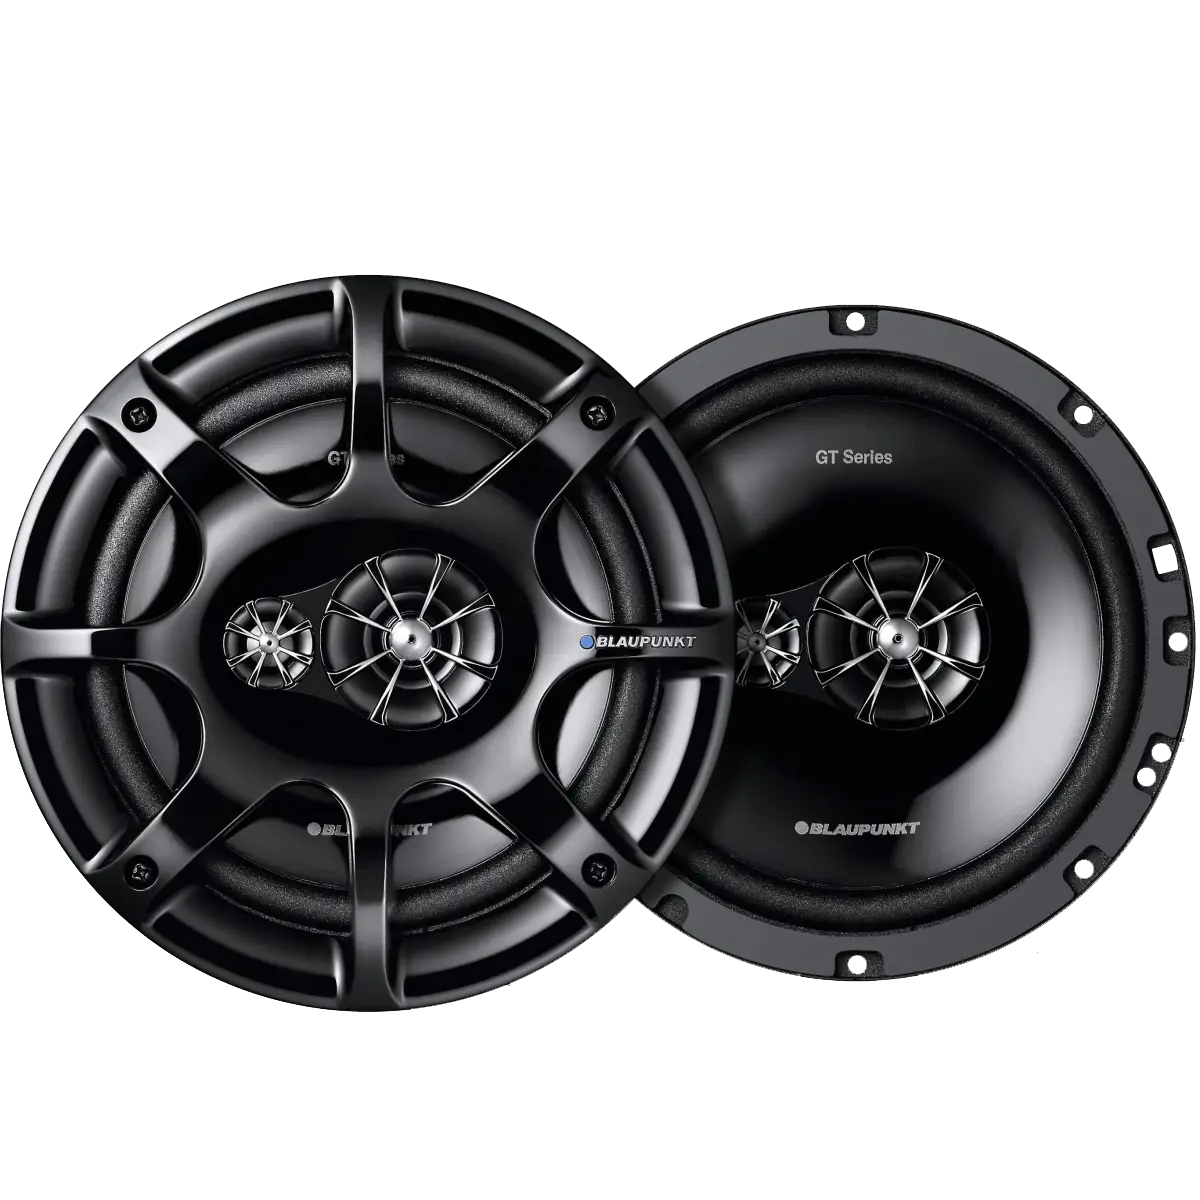
High-Quality Black Car Speakers -
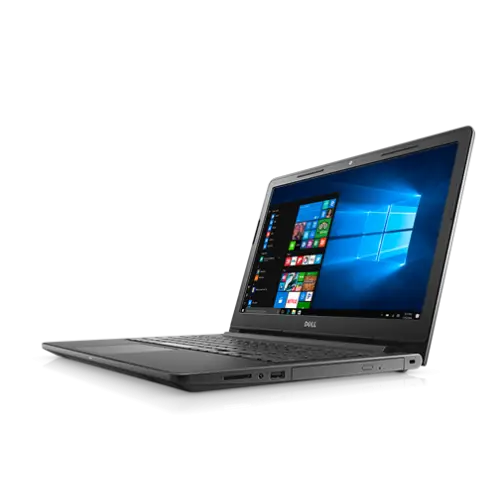
Laptop with Windows Operating System -
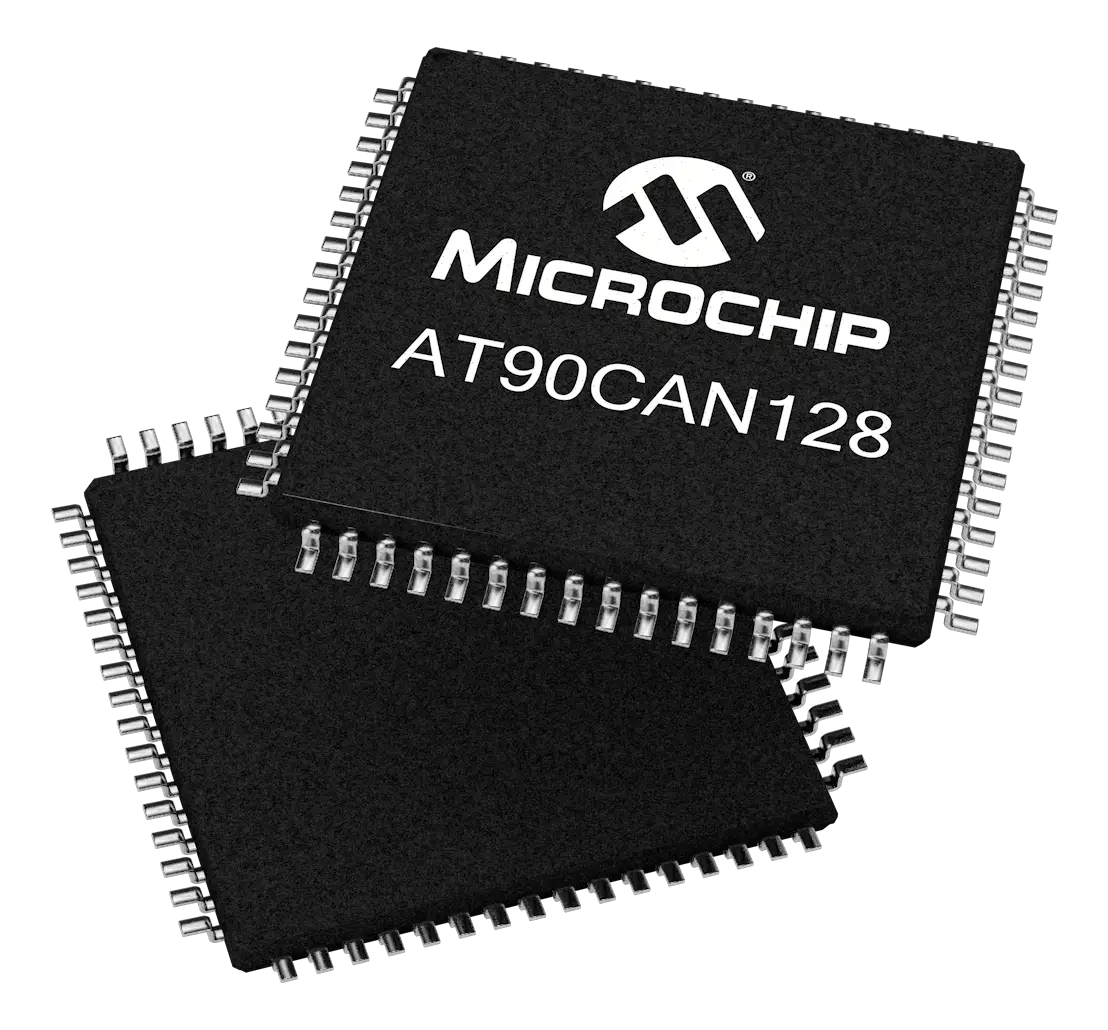
Microchip AT90CAN128 Semiconductor Component