
You Might Like
-

Colored Regional Map of Africa -

Blue Globe Network Icon -

Satellite Dish Icon -

Free WiFi Area Logo -

Various Devices Displaying Software -

Complete Blue World Map -

Icon of KPI Dashboard with Graph and Person -

Zigzag Down Arrow Icon for Decline Representation -

Wireless Padlock Icon with Wi-Fi Signal -

Yellow Ethernet Cable for Network Connections -

Bar Chart with Upward Arrow -

Phone Call Icon with Signal Waves -
Colorful Bookshelf -

Blue Signal Tower Icon with Radio Waves -

Blue Satellite Icon with Signals -
Color Wheel for Artistic Inspiration -

Search Growth Icon -

Illustration of Growth Chart with Upward Arrow -

Firewall Icon Depicting Security Concept -

3G Signal Wireless Icon -
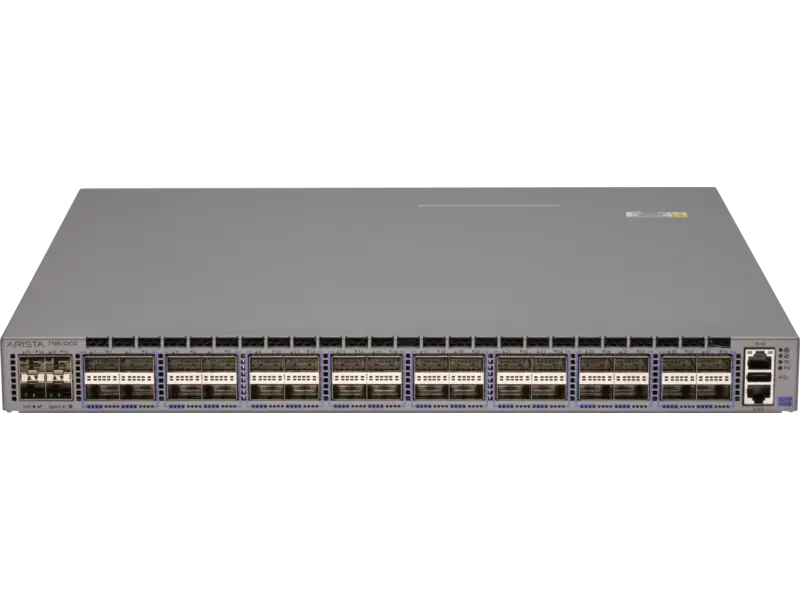
Network Switch for Data Connectivity Solutions -

Illustration of Call Center Network Connections -

Green Signal Bars Icon -

Blue Globe Icon for Global Connectivity -

Blue Declining Bar Graph with Arrow -

Circle Pie Chart Icon -

Cloud Computing Concept with Connected Devices -

Team Cooperation Diagram -

Yammer Logo in Blue Circle -

Simplistic Green Wireless Wifi Icon Illustration