You Might Like
-

White Cloud Blur Graphic Element -

Purple Crescent Moon on Clear Background -
Colorful Geometric Sphere -
Colorful Abacus for Learning and Counting -

Instagram round gradient logo -

Zigzag Down Arrow Icon for Decline Representation -

Black Feather with Smooth Texture -

Stylized Decorative Dolphin Illustration -

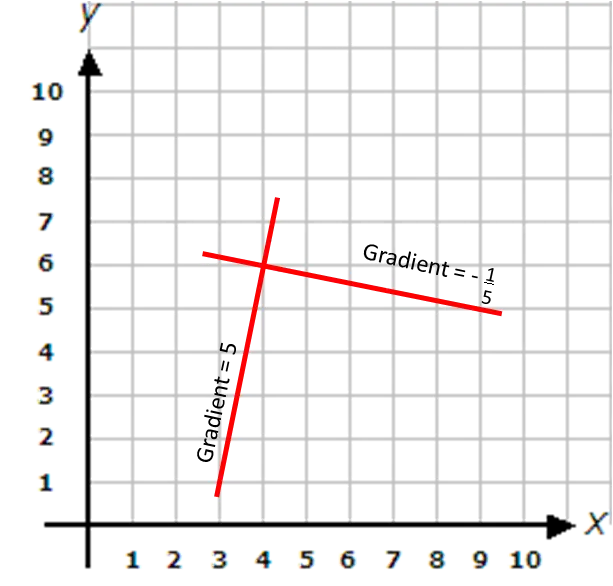
Graph Plot with Blue Curve Illustration -
Gradient T-Shirt in Pink and Yellow -
Abstract Colorful Planet Art -

Orange Curved Abstract Design -
Colorful Sparkling Circle Design -

Gradient Transparent Background -
Rainbow Gradient Heart Illustration -

Blue Declining Bar Graph with Arrow -

Circle Pie Chart Icon -
Colorful decorative bows -

Playful Cartoon Number 5 Illustration for Kids -

Minimalist Equal Symbol Icon -

Abstract Blurred White Text Design -

Yellow Flame Fire Illustration -

Declining Chart Illustration -
Festive Red Banners with Sparkles -

Bold Black Equals Symbol -
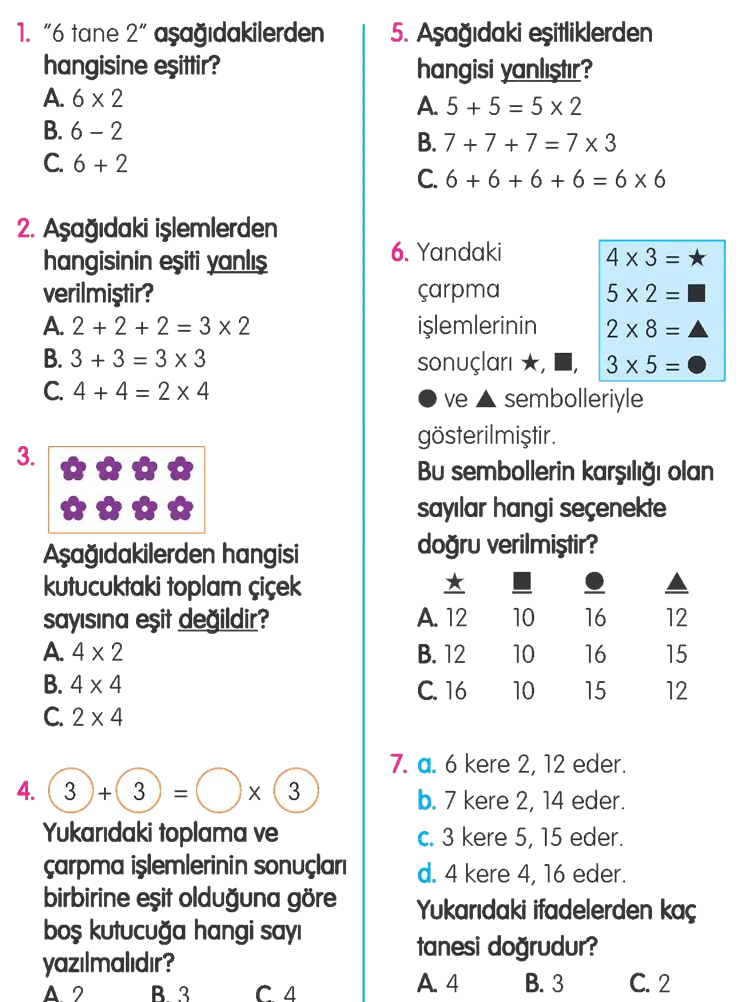
Math Worksheet with Questions -
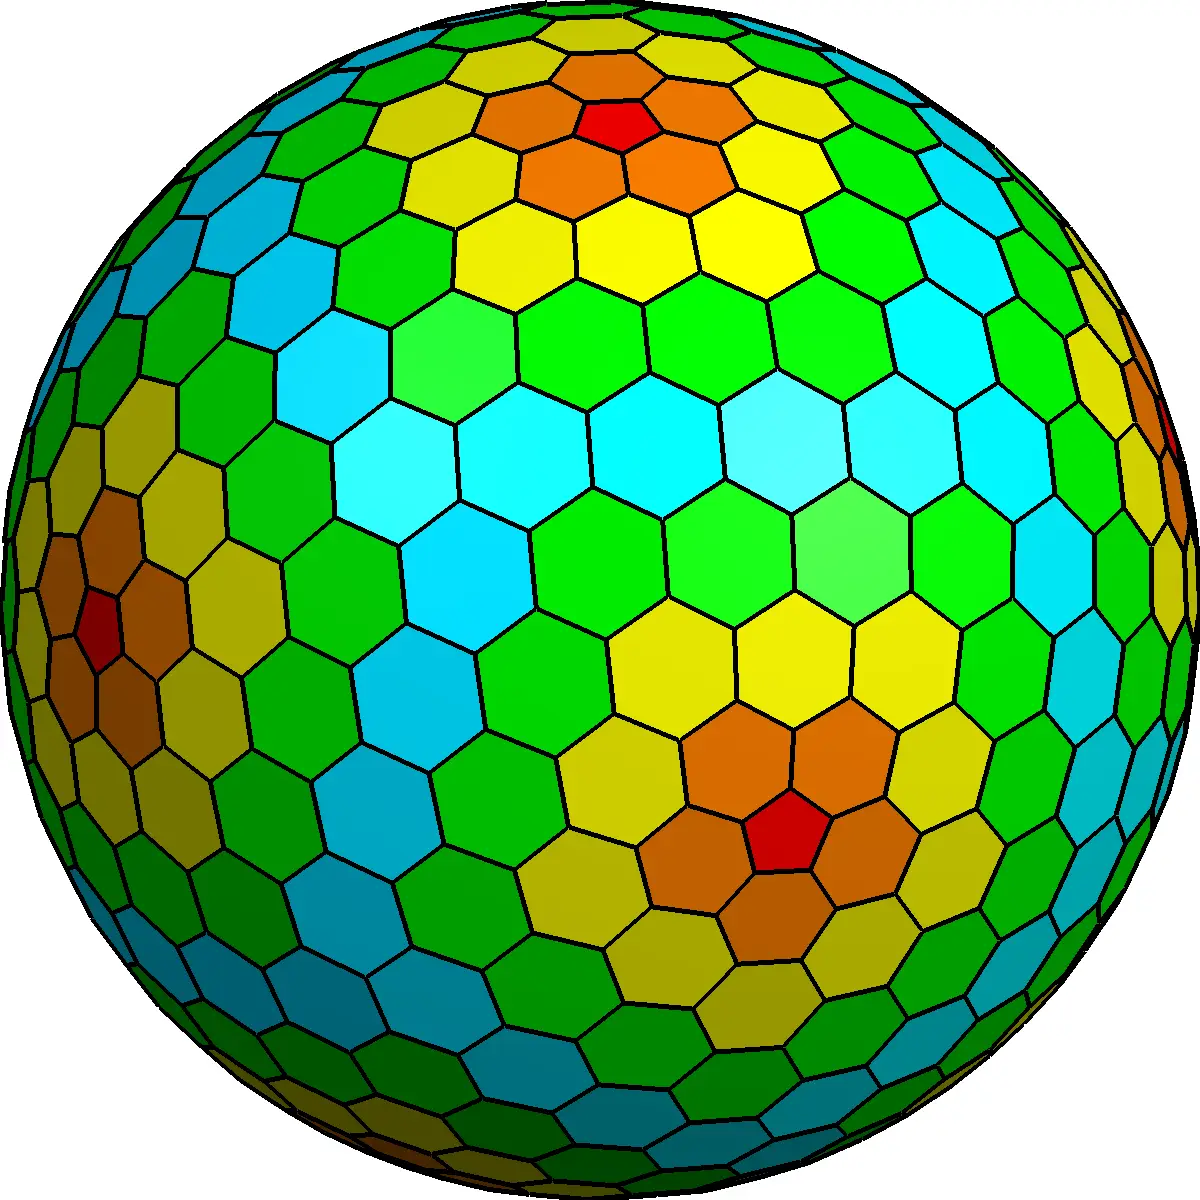
Colorful Hexagonal Sphere -
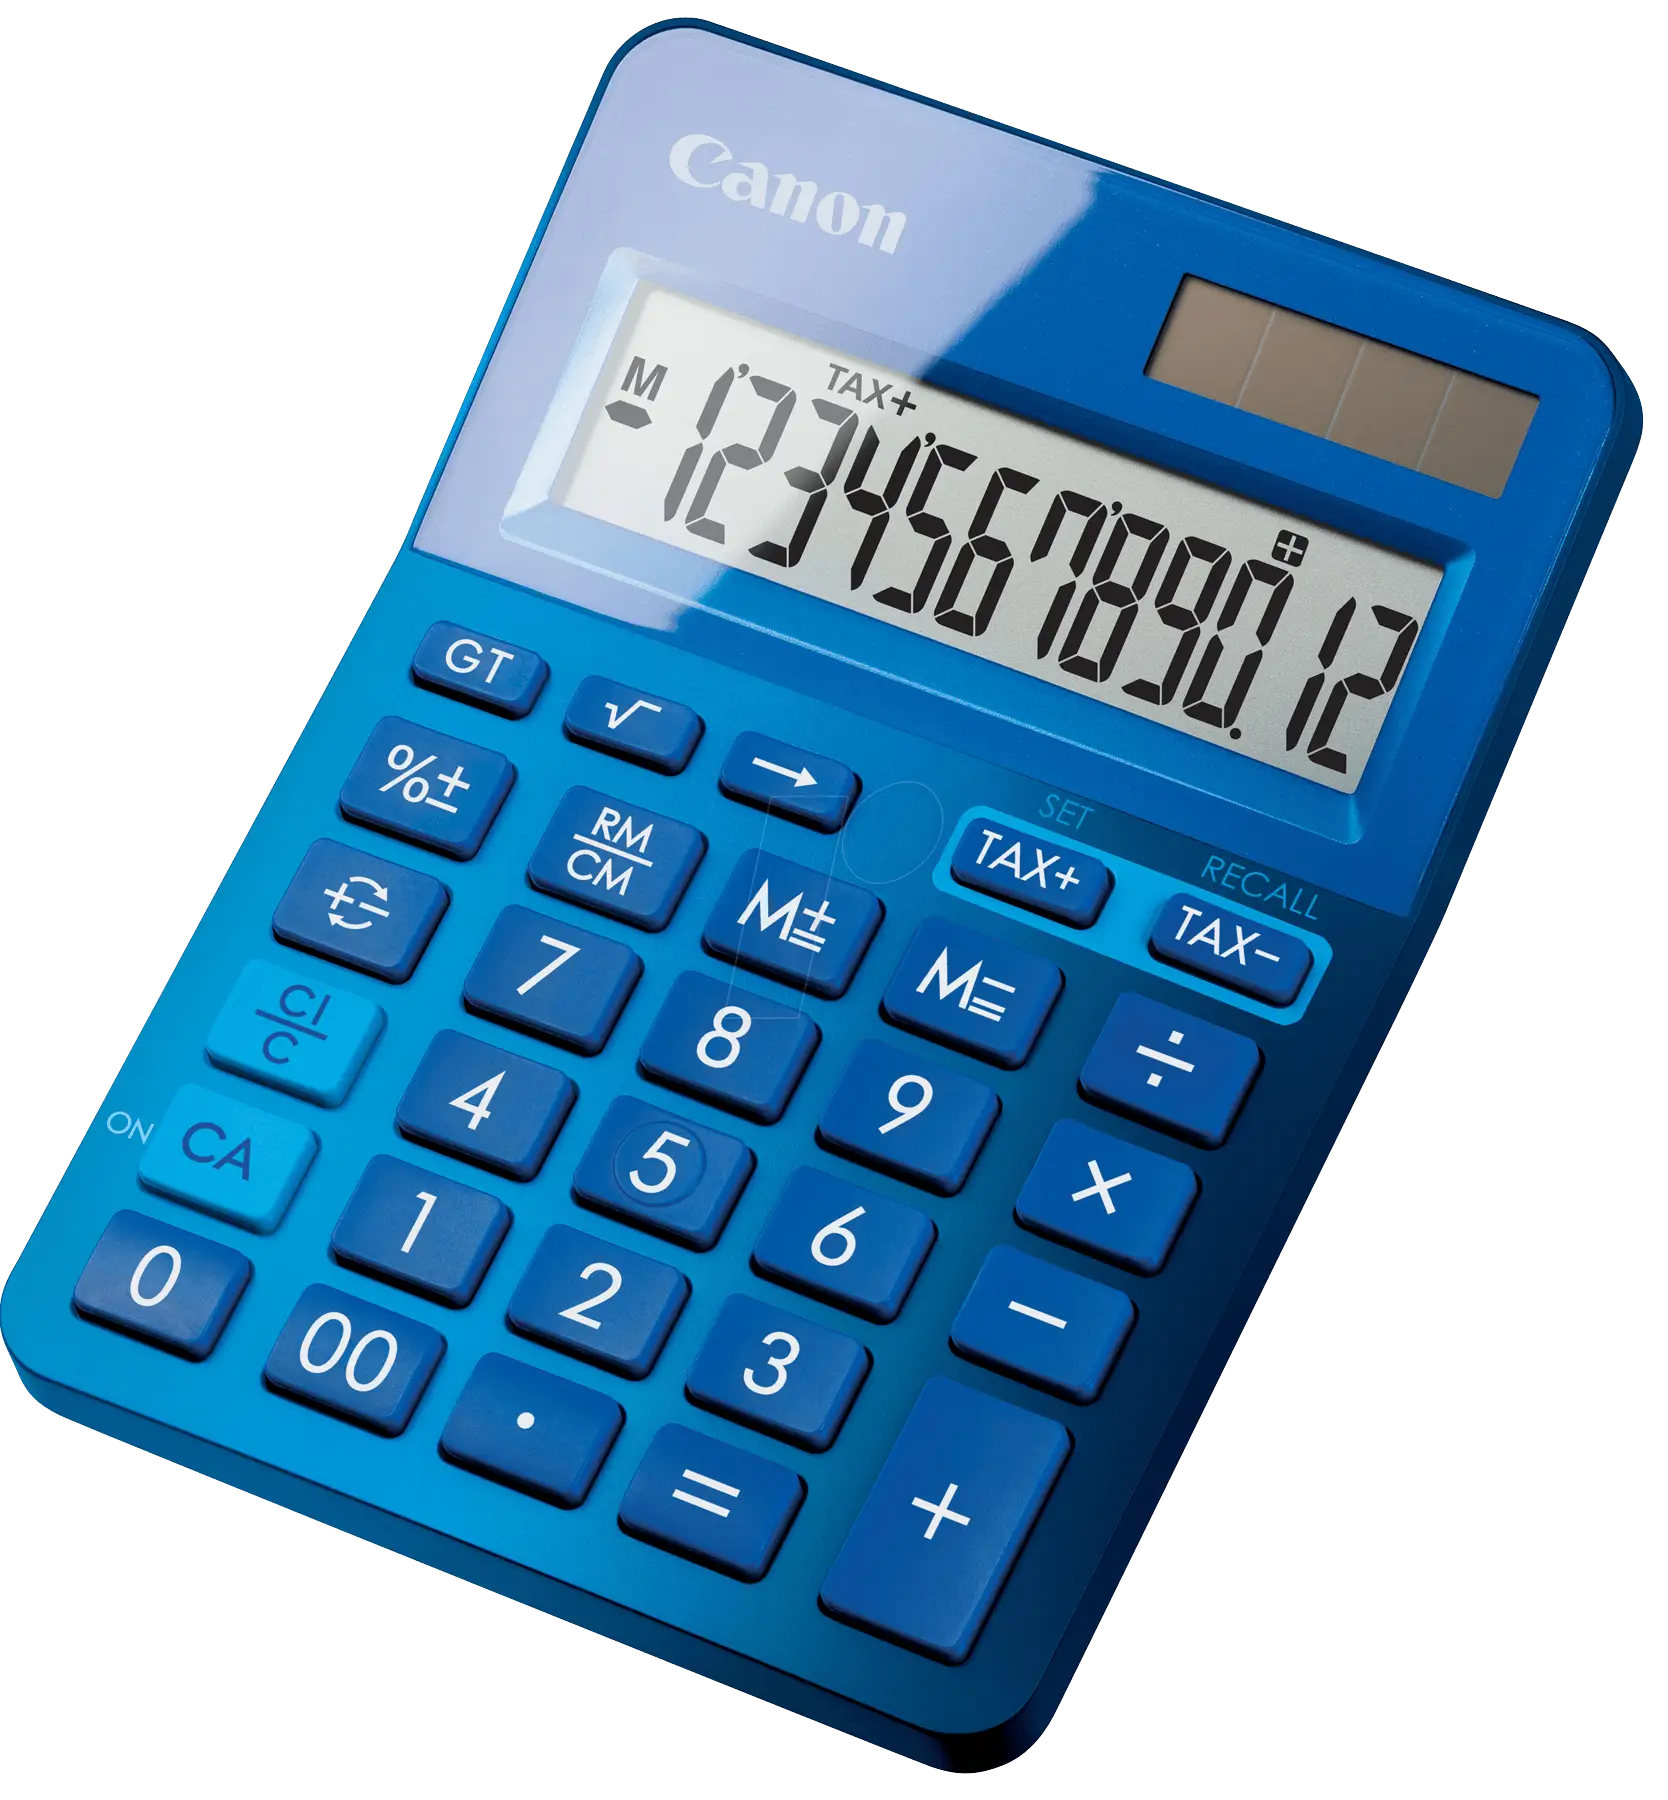
Blue Electronic Calculator for Office and School -

Blue Feather Design in Artistic Style -
Colorful Spiral Line for Creative Design