
You Might Like
-

Digital Connector with Binary Code -

White Cloud Blur Graphic Element -

Blue Spiral Pattern Design -

Blue Play Button Icon -

Telkom Indonesia Official Logo -

Black Wave Symbol -

Windows Logo on Blue Background -

Purple Crescent Moon on Clear Background -

Floating Bubbles in Artistic Design -

Yellow Starburst Shape Illustration -

Blue Microsoft Edge Logo -

Black Feather with Plume and Dark Appearance -

Blue Globe Network Icon -

Black Smartphone Icon Design -

Colorful Abstract Graphic Design -

Red Adobe Logo -

Black V Symbol -

Yellow Happy Emoji Face -

Simple Silhouette of a Human Figure -

Team with Growth Graph Illustration -

Black Mandala Decorative Pattern Design -
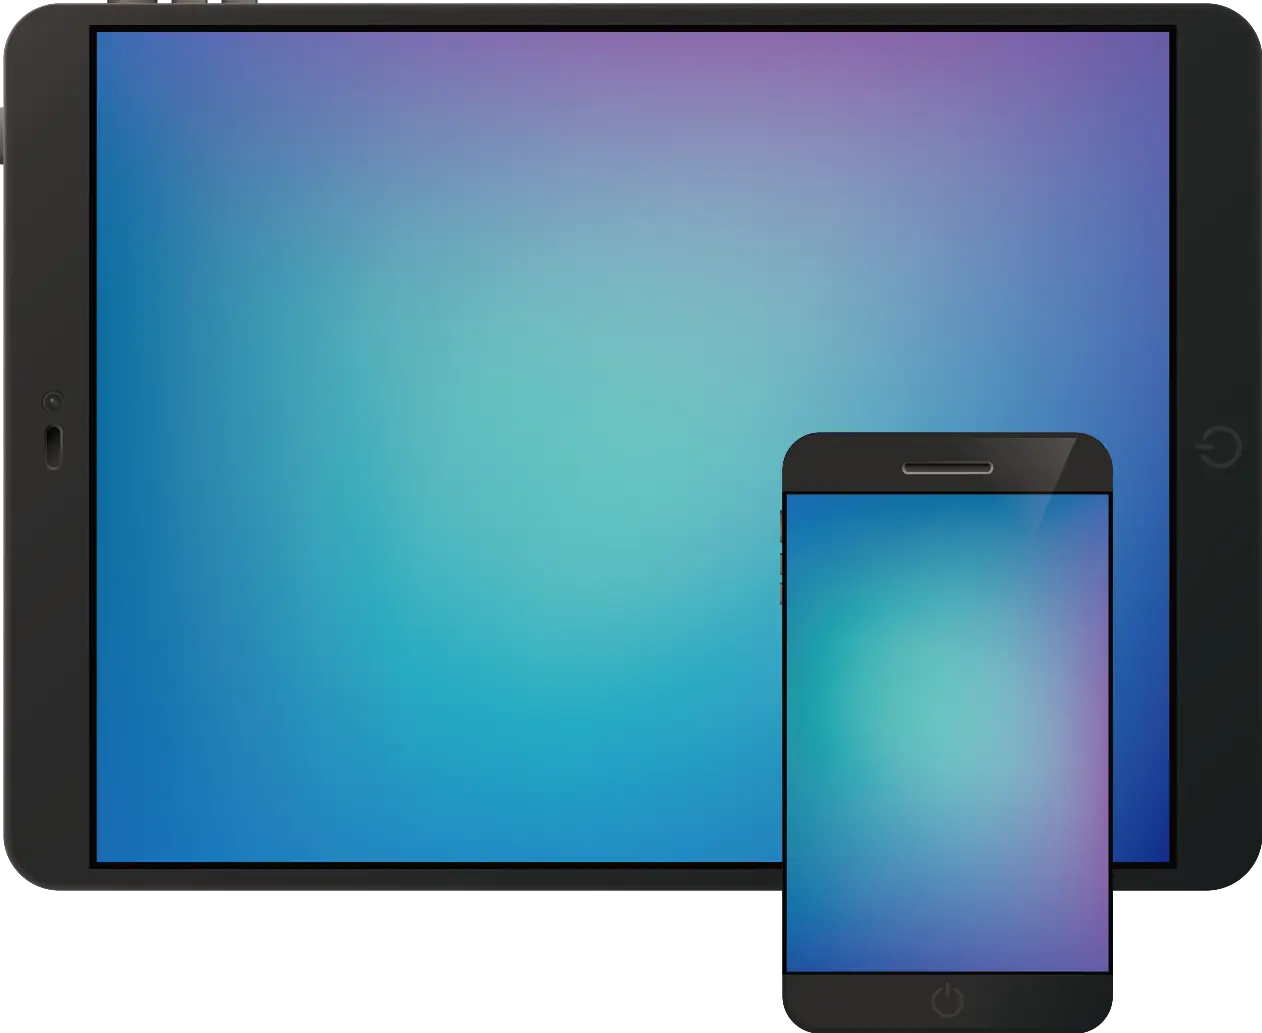
Tablet and Smartphone Technology -

Colorful Abstract Painting with Geometric Shapes -
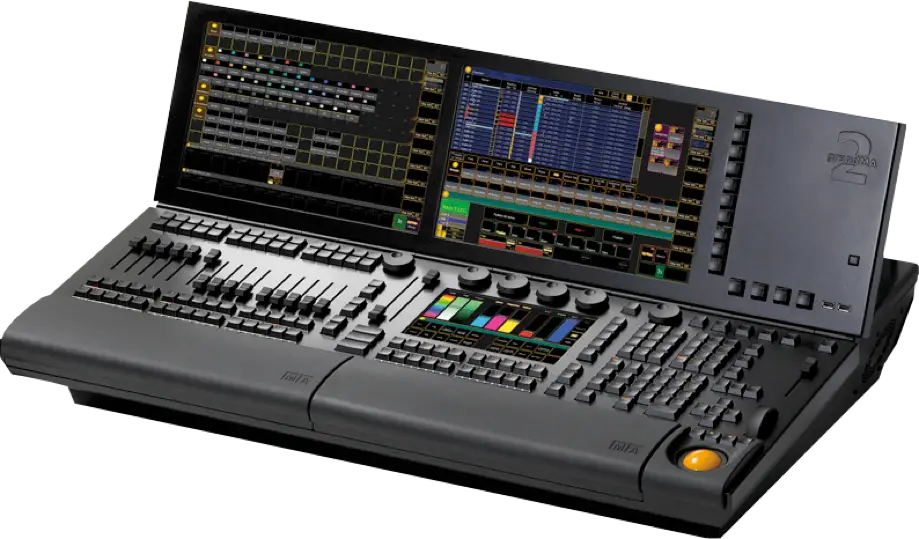
Professional Lighting Console for Stage Performance -

Blue Game Controller Icon -

Transparent Background Grid -

Fierce Bear Head Illustration -

Black Angle Brackets Symbol -

Bright Yellow Stars Illustration -

Colorful Stained Glass Heart