You Might Like
-
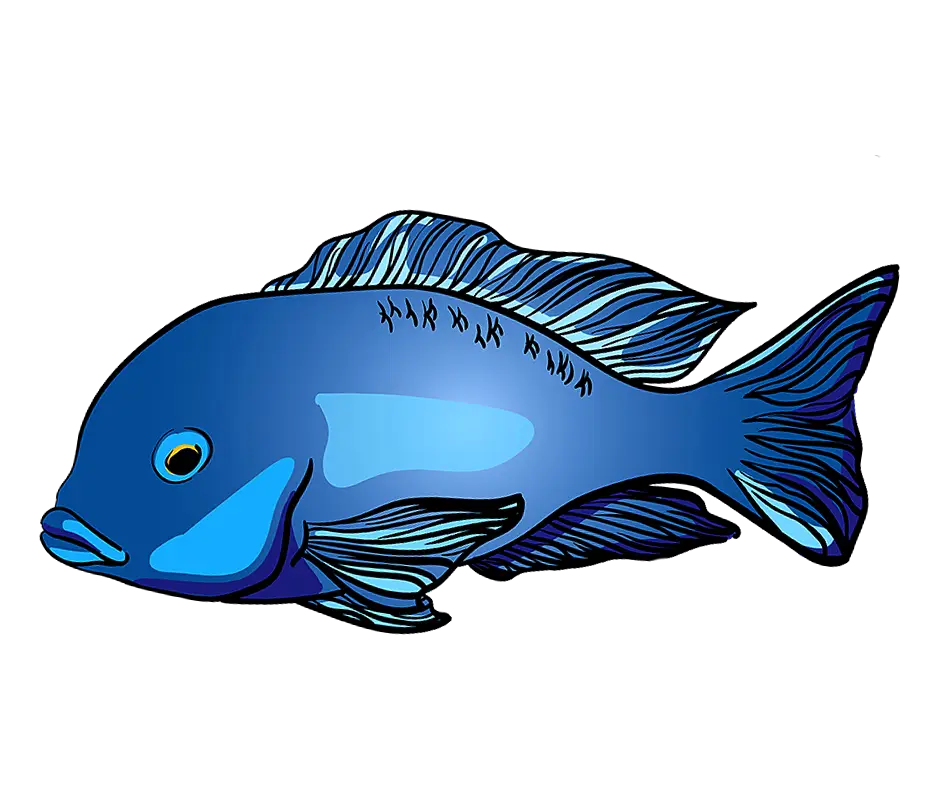
Blue Fish Graphic Illustration -
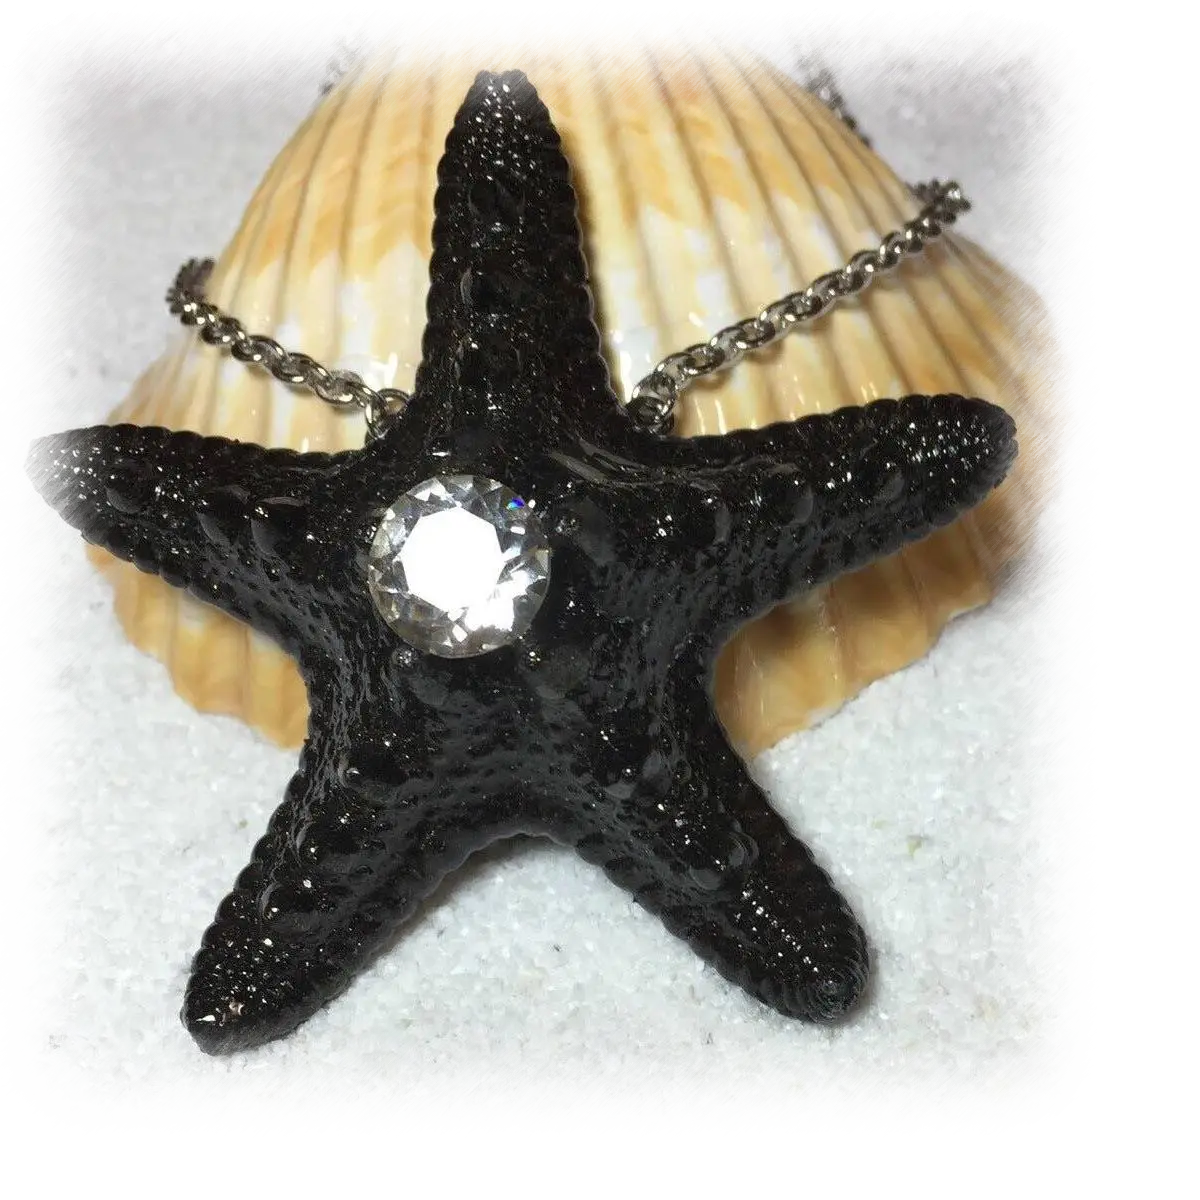
Black Starfish Necklace with Gem -

Black Wave Symbol -
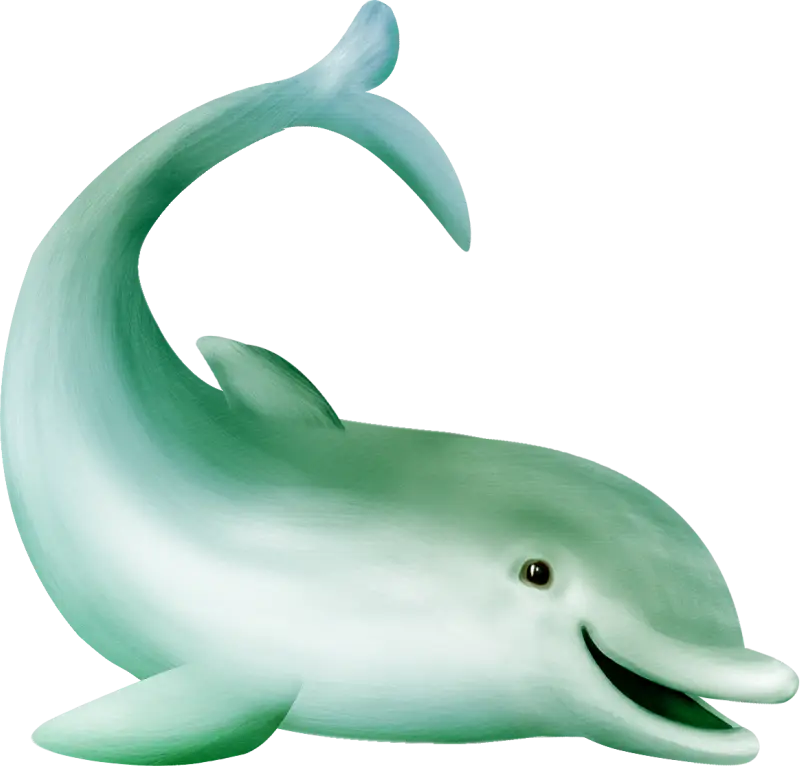
Cute Cartoon Dolphin Illustration -

Minimalistic Sea and Sky Logo -
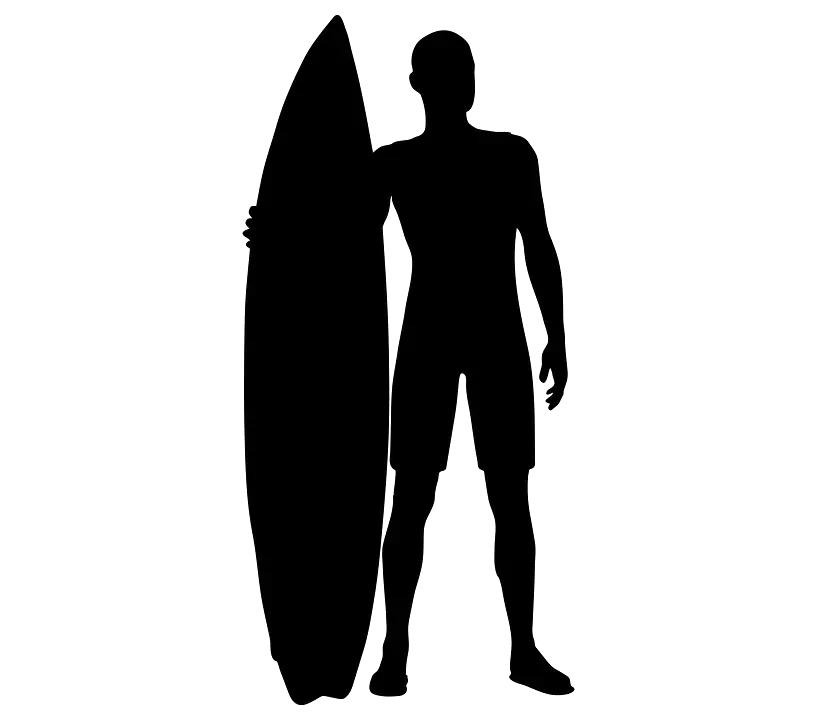
Surfer Silhouette -
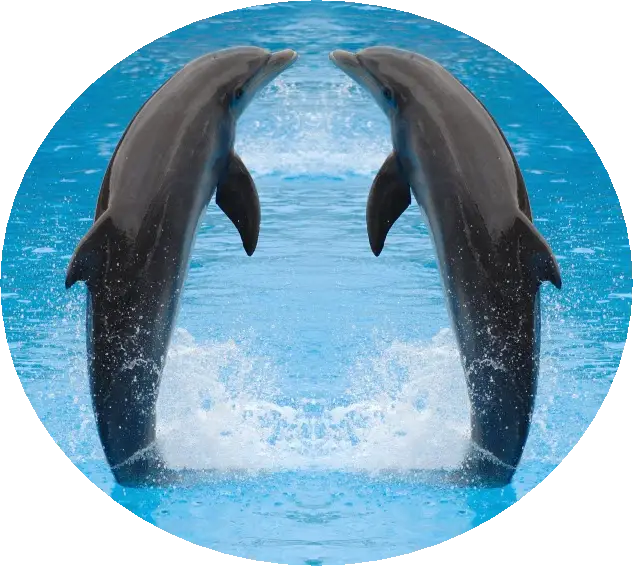
Playful Dolphins Jumping in Water -
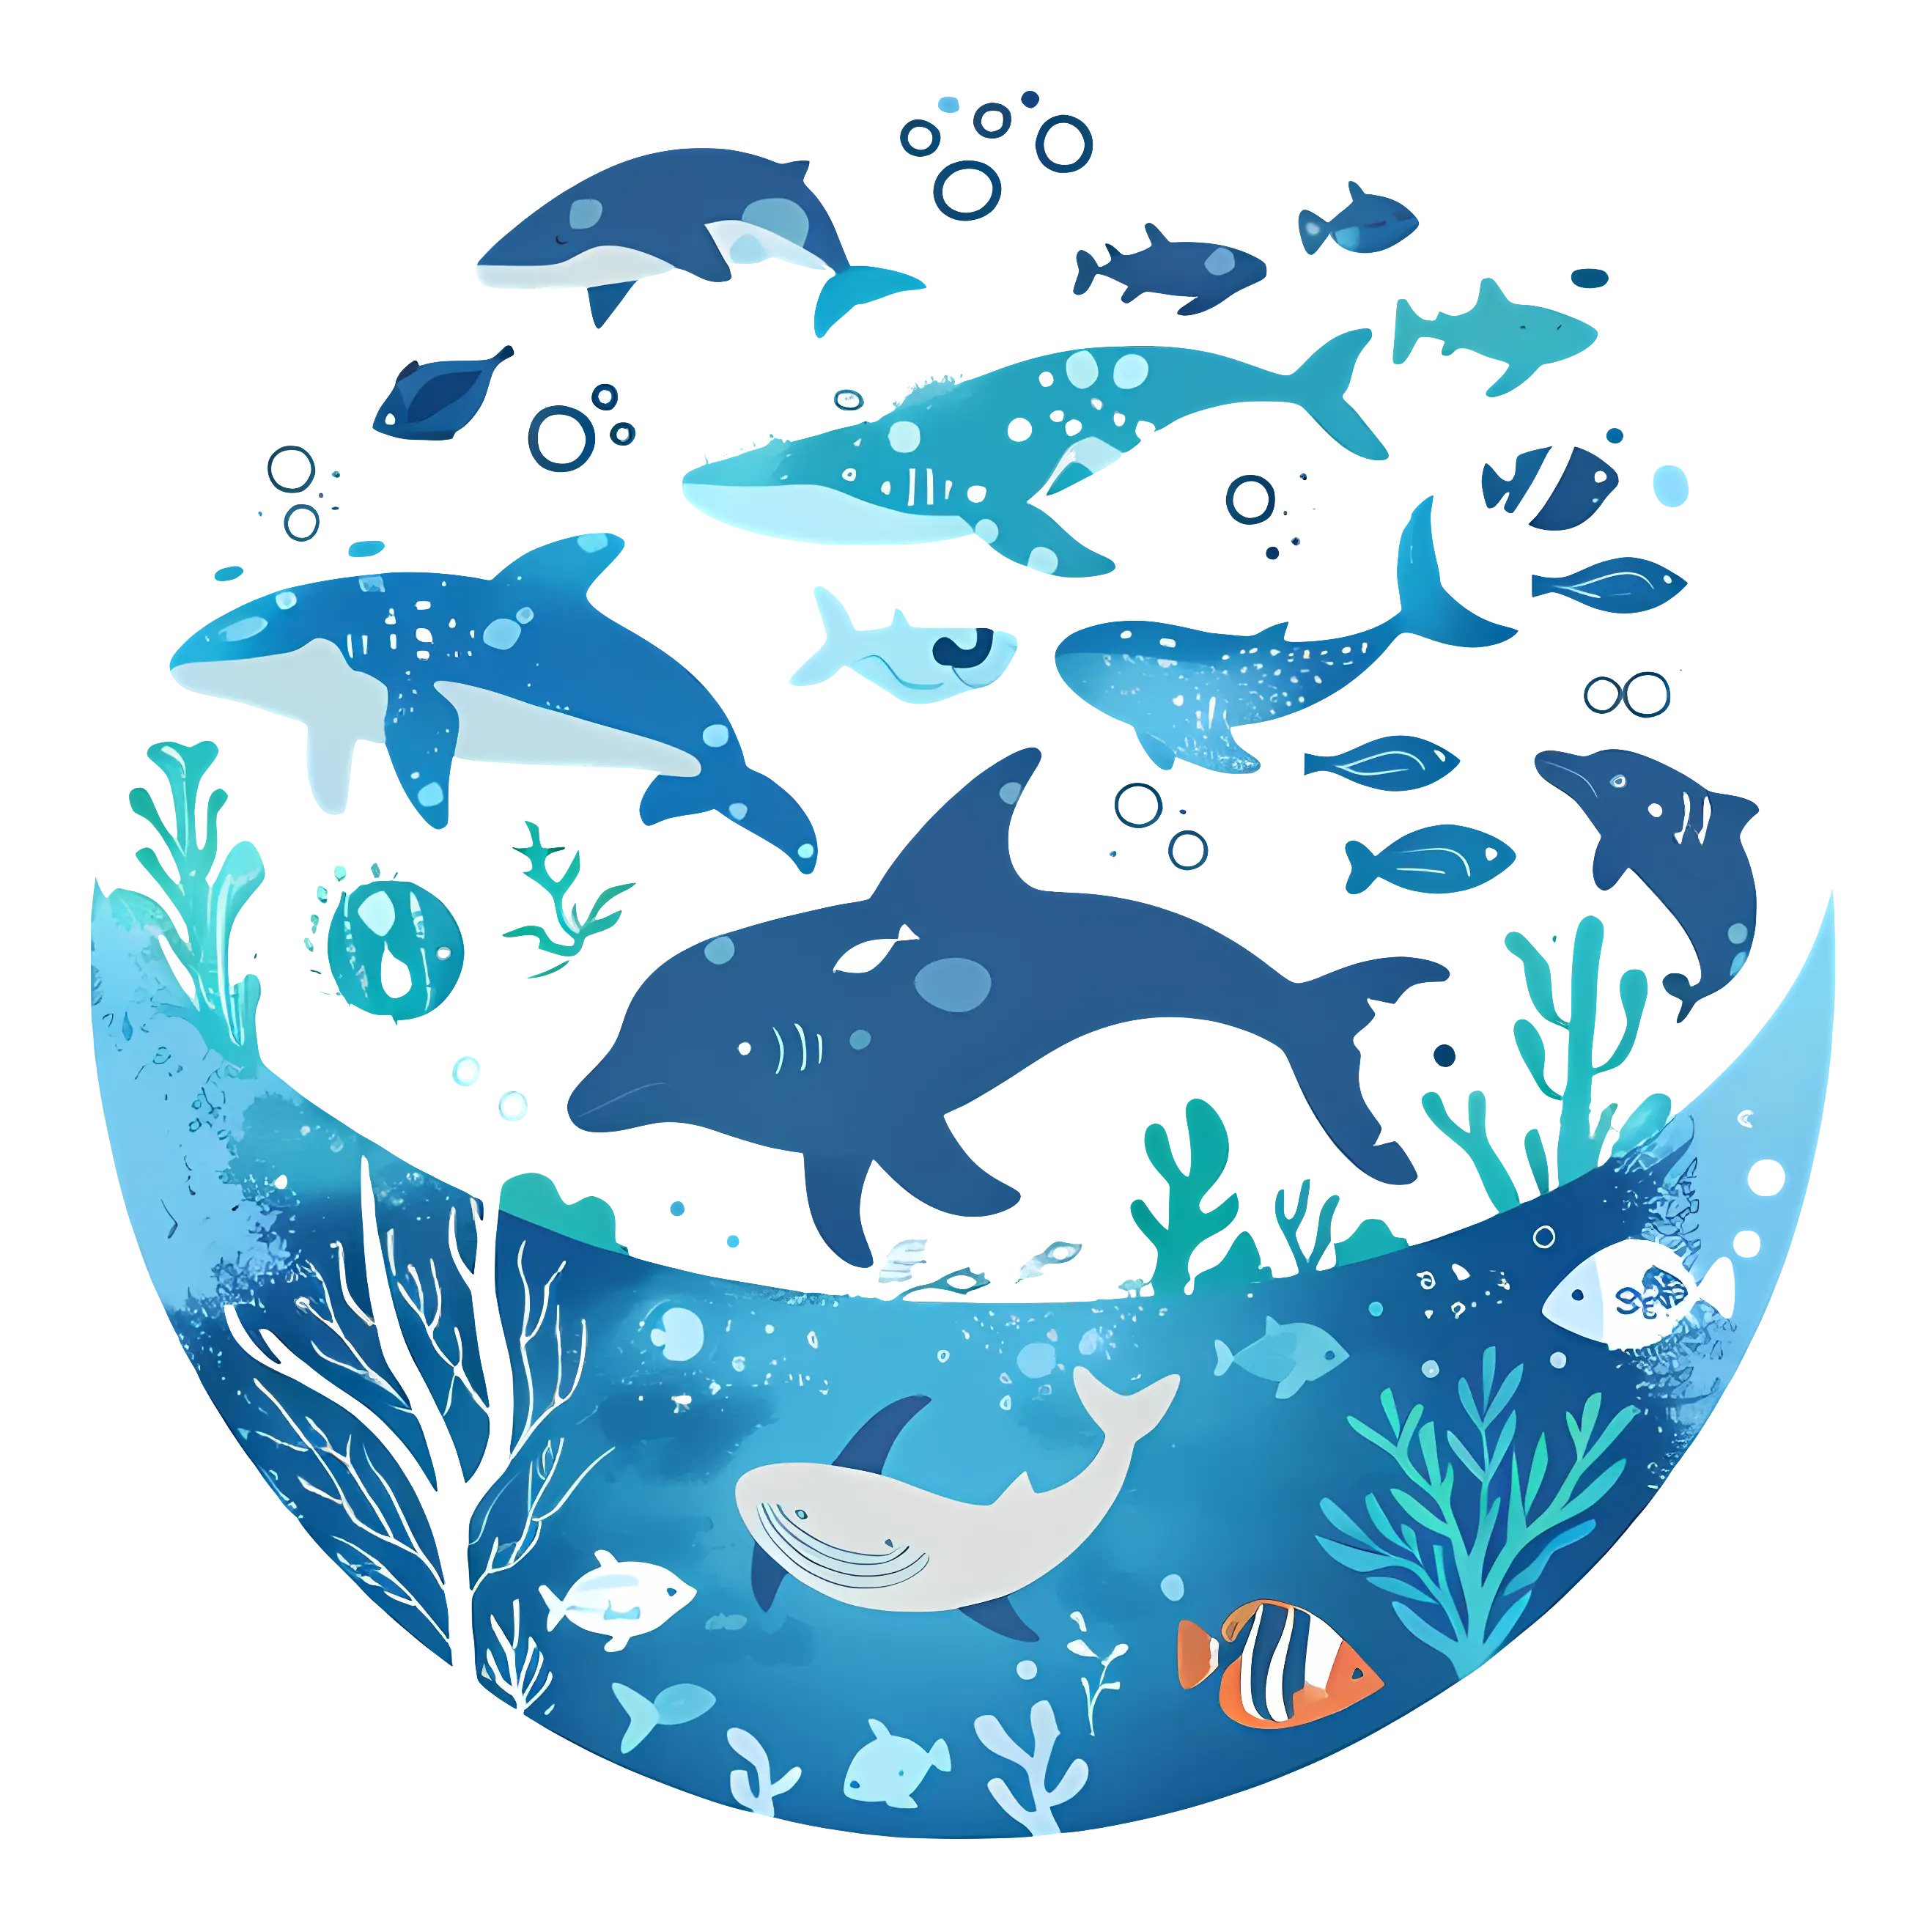
Vivid Marine Life in Underwater Illustration -

Man Paddleboarding Cartoon Illustration -

Green Globe Icon Representing Sustainability -

Smart Home Control System with Temperature Display -
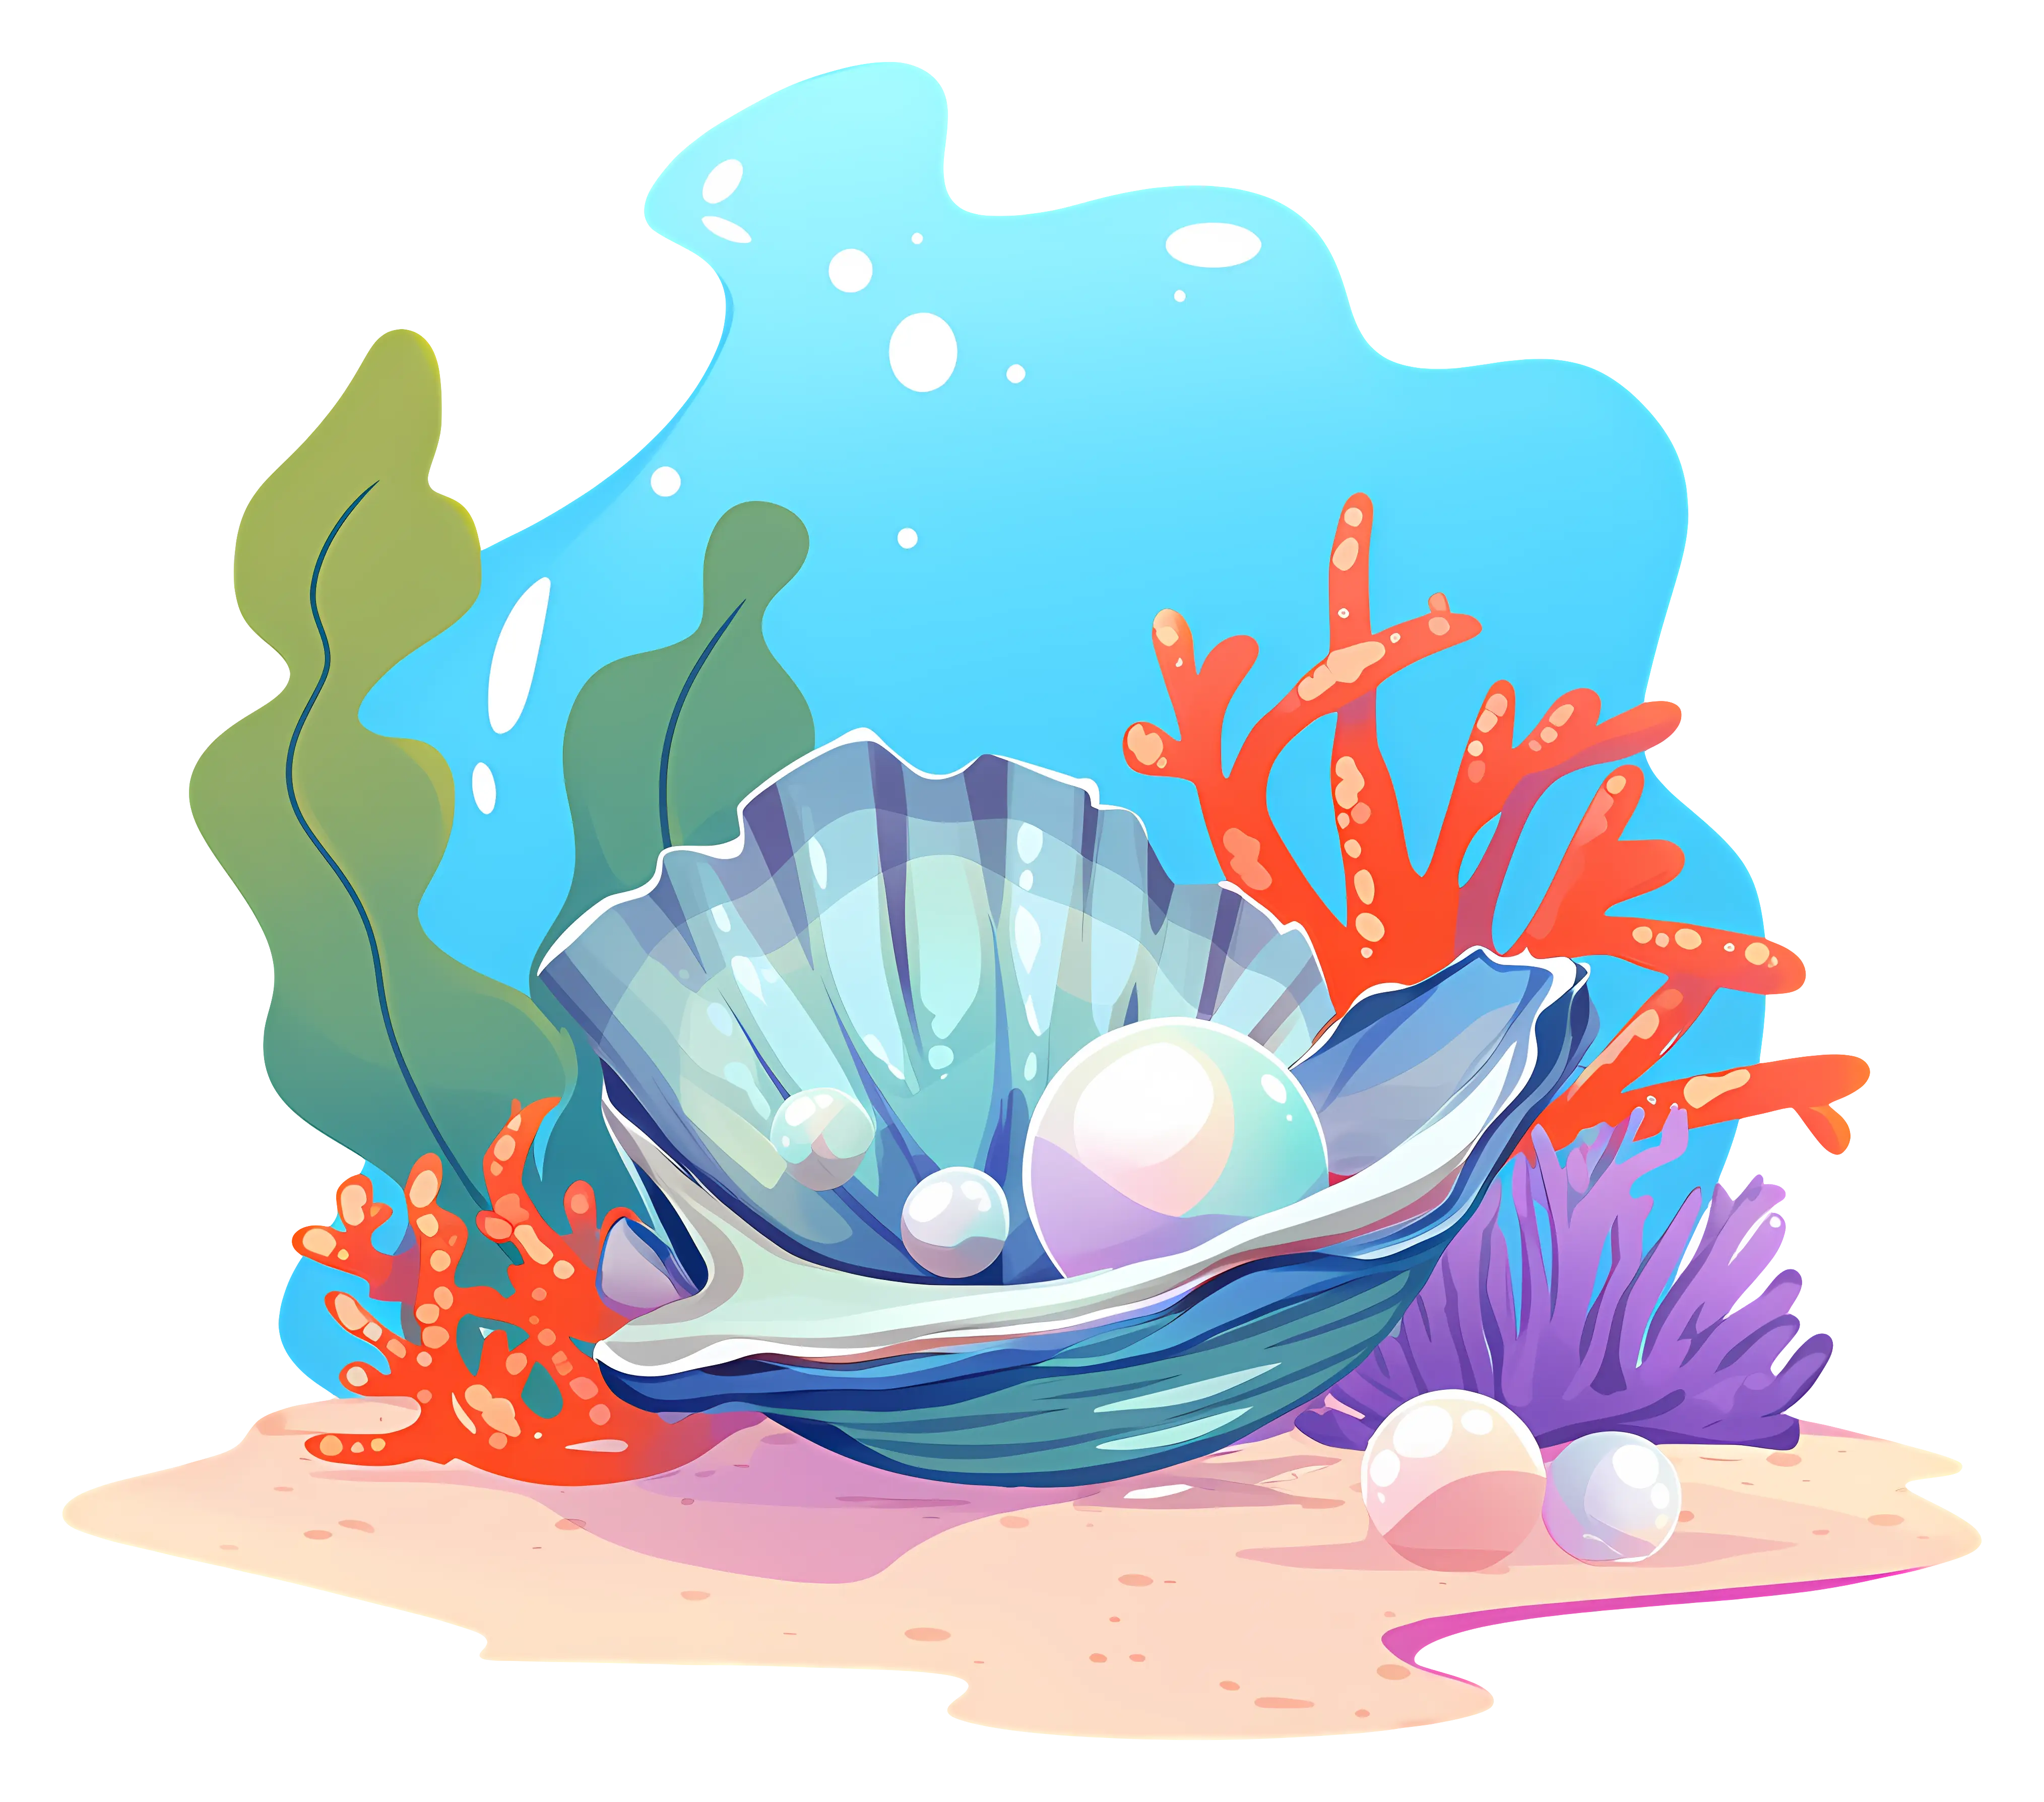
Underwater Pearl in Seashell Illustration -
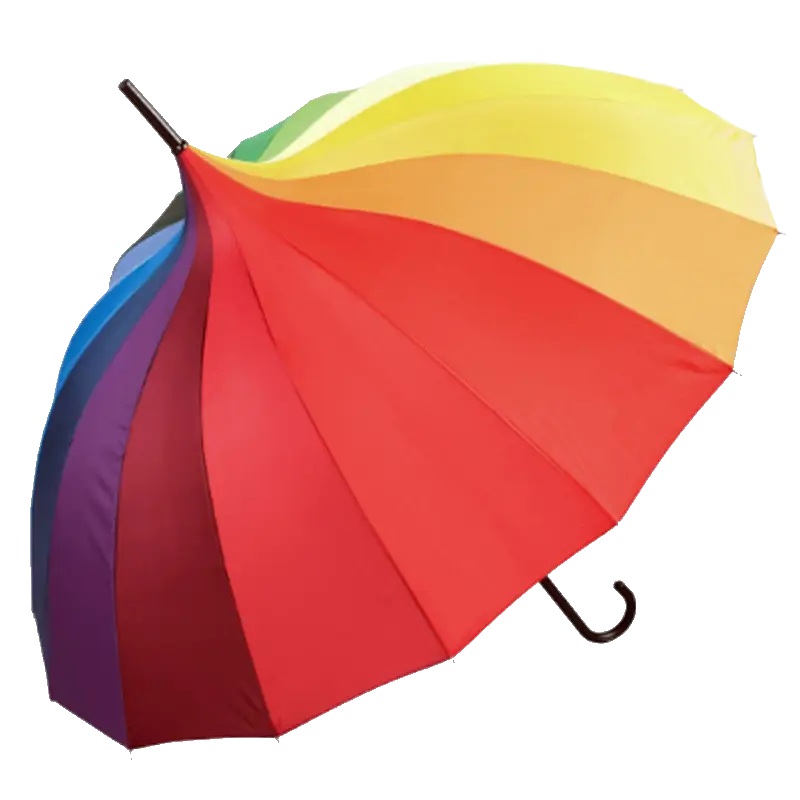
Multicolored Umbrella for Weather Protection -
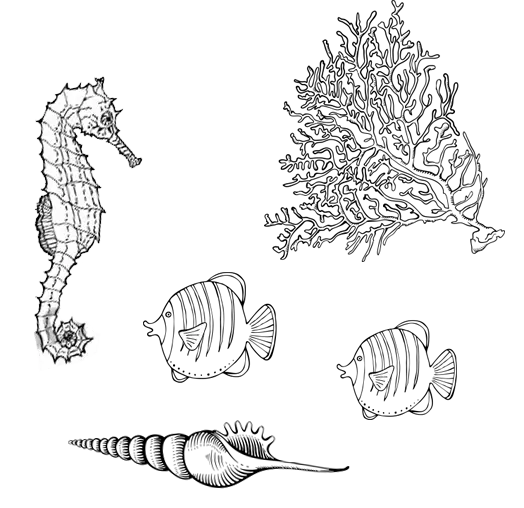
Illustration of Sea Creatures -
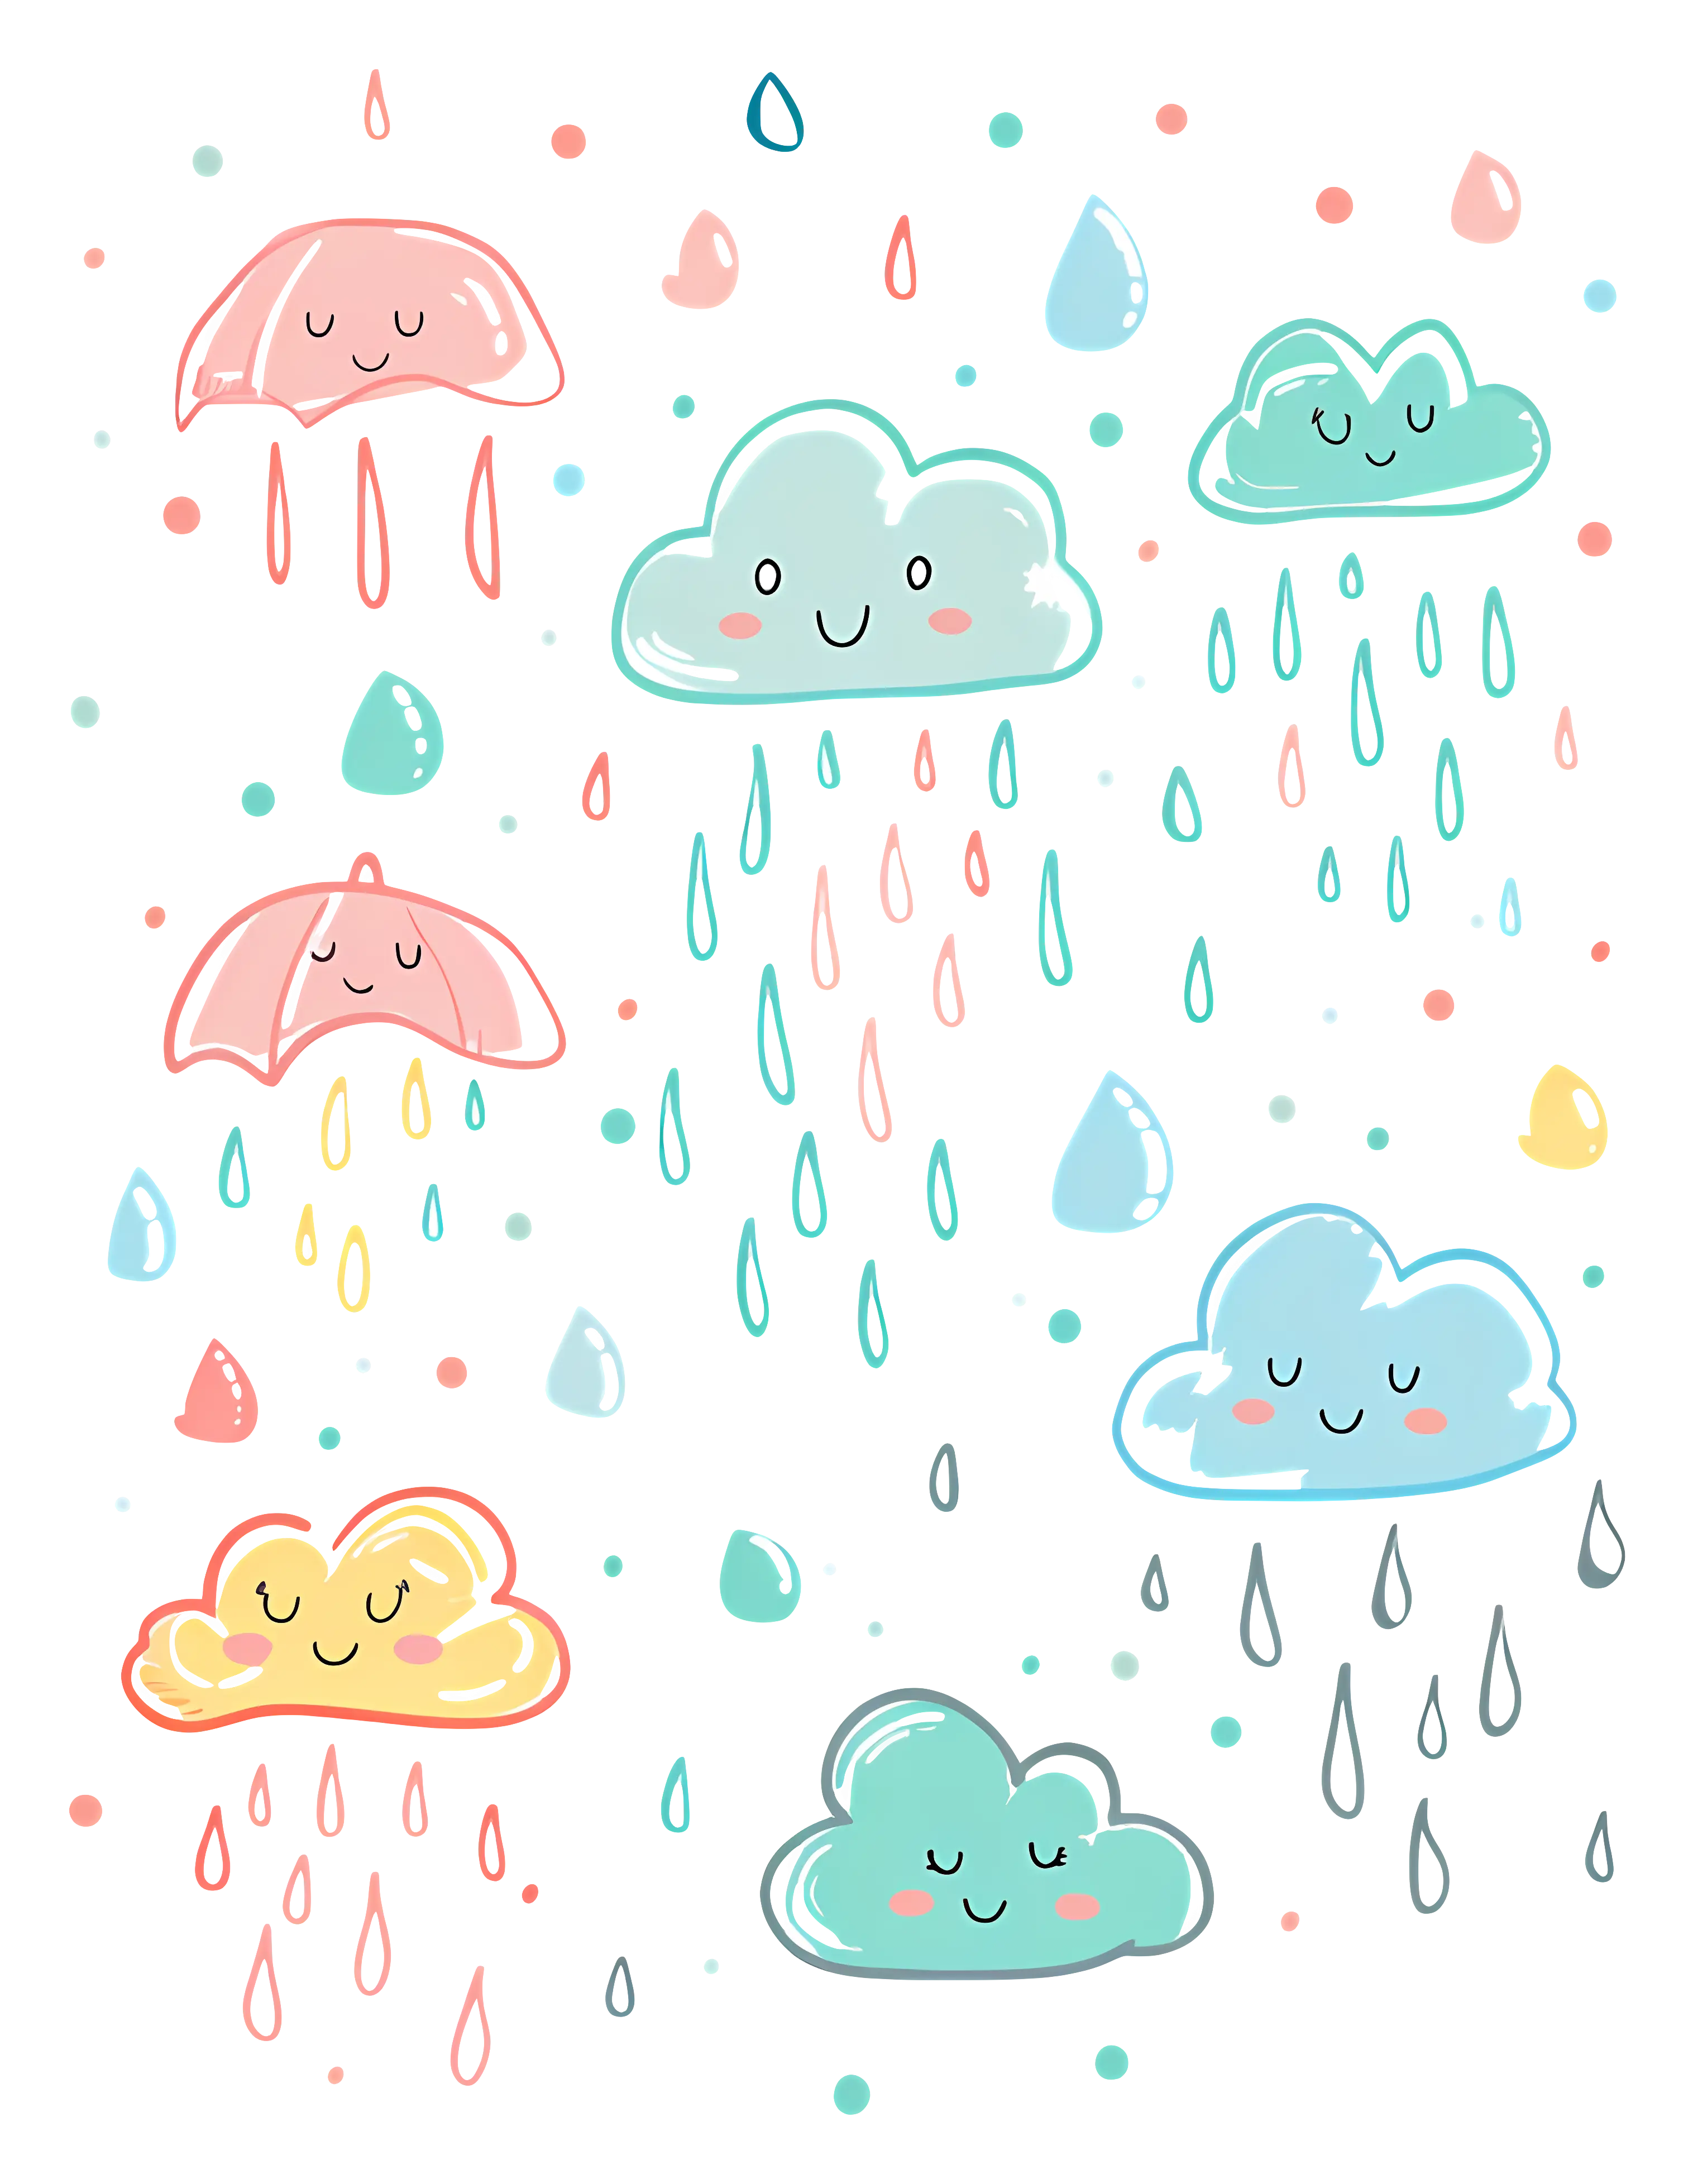
Cute Rain Clouds and Umbrellas Illustration -

Black Windy Weather Icon -

Thermometer Symbol Icon -
Transparent Jellyfish Illustration -
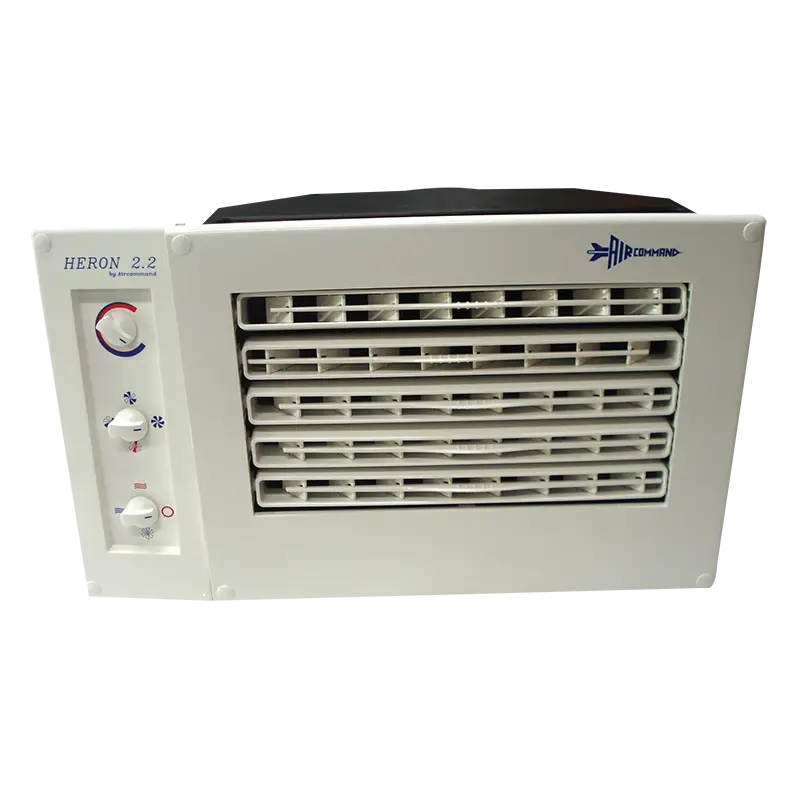
Electric Room Heater -
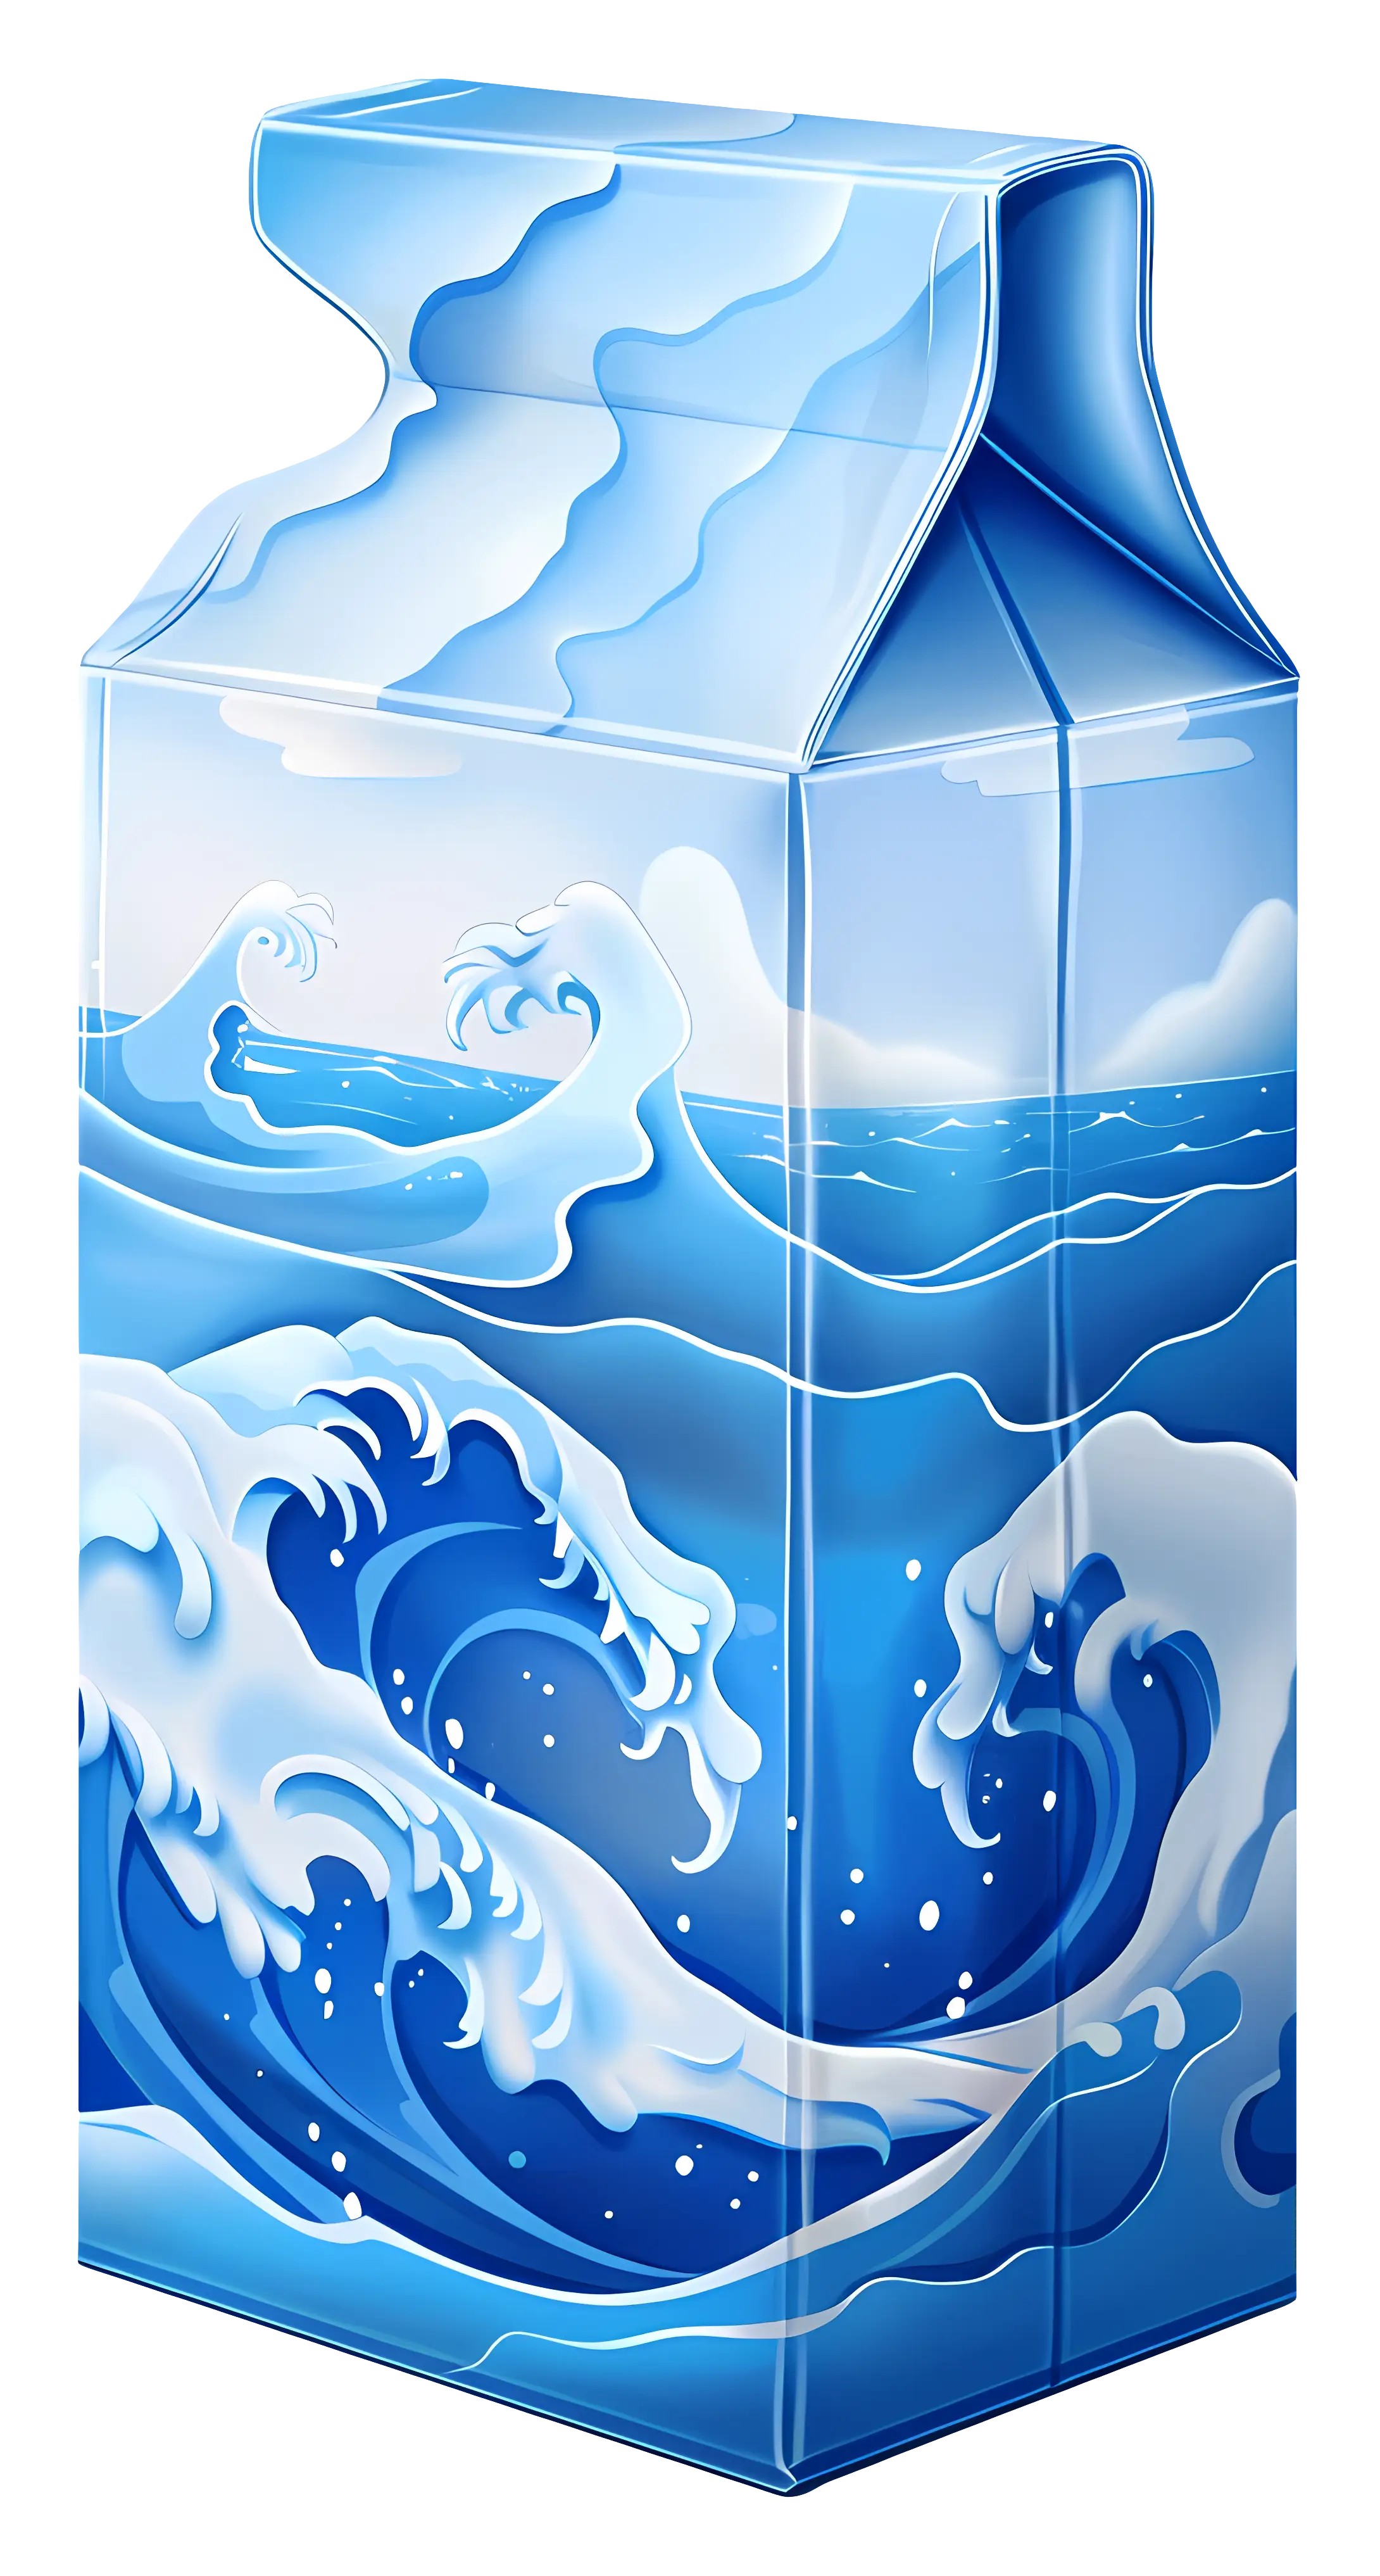
Ocean Waves on Milk Carton -
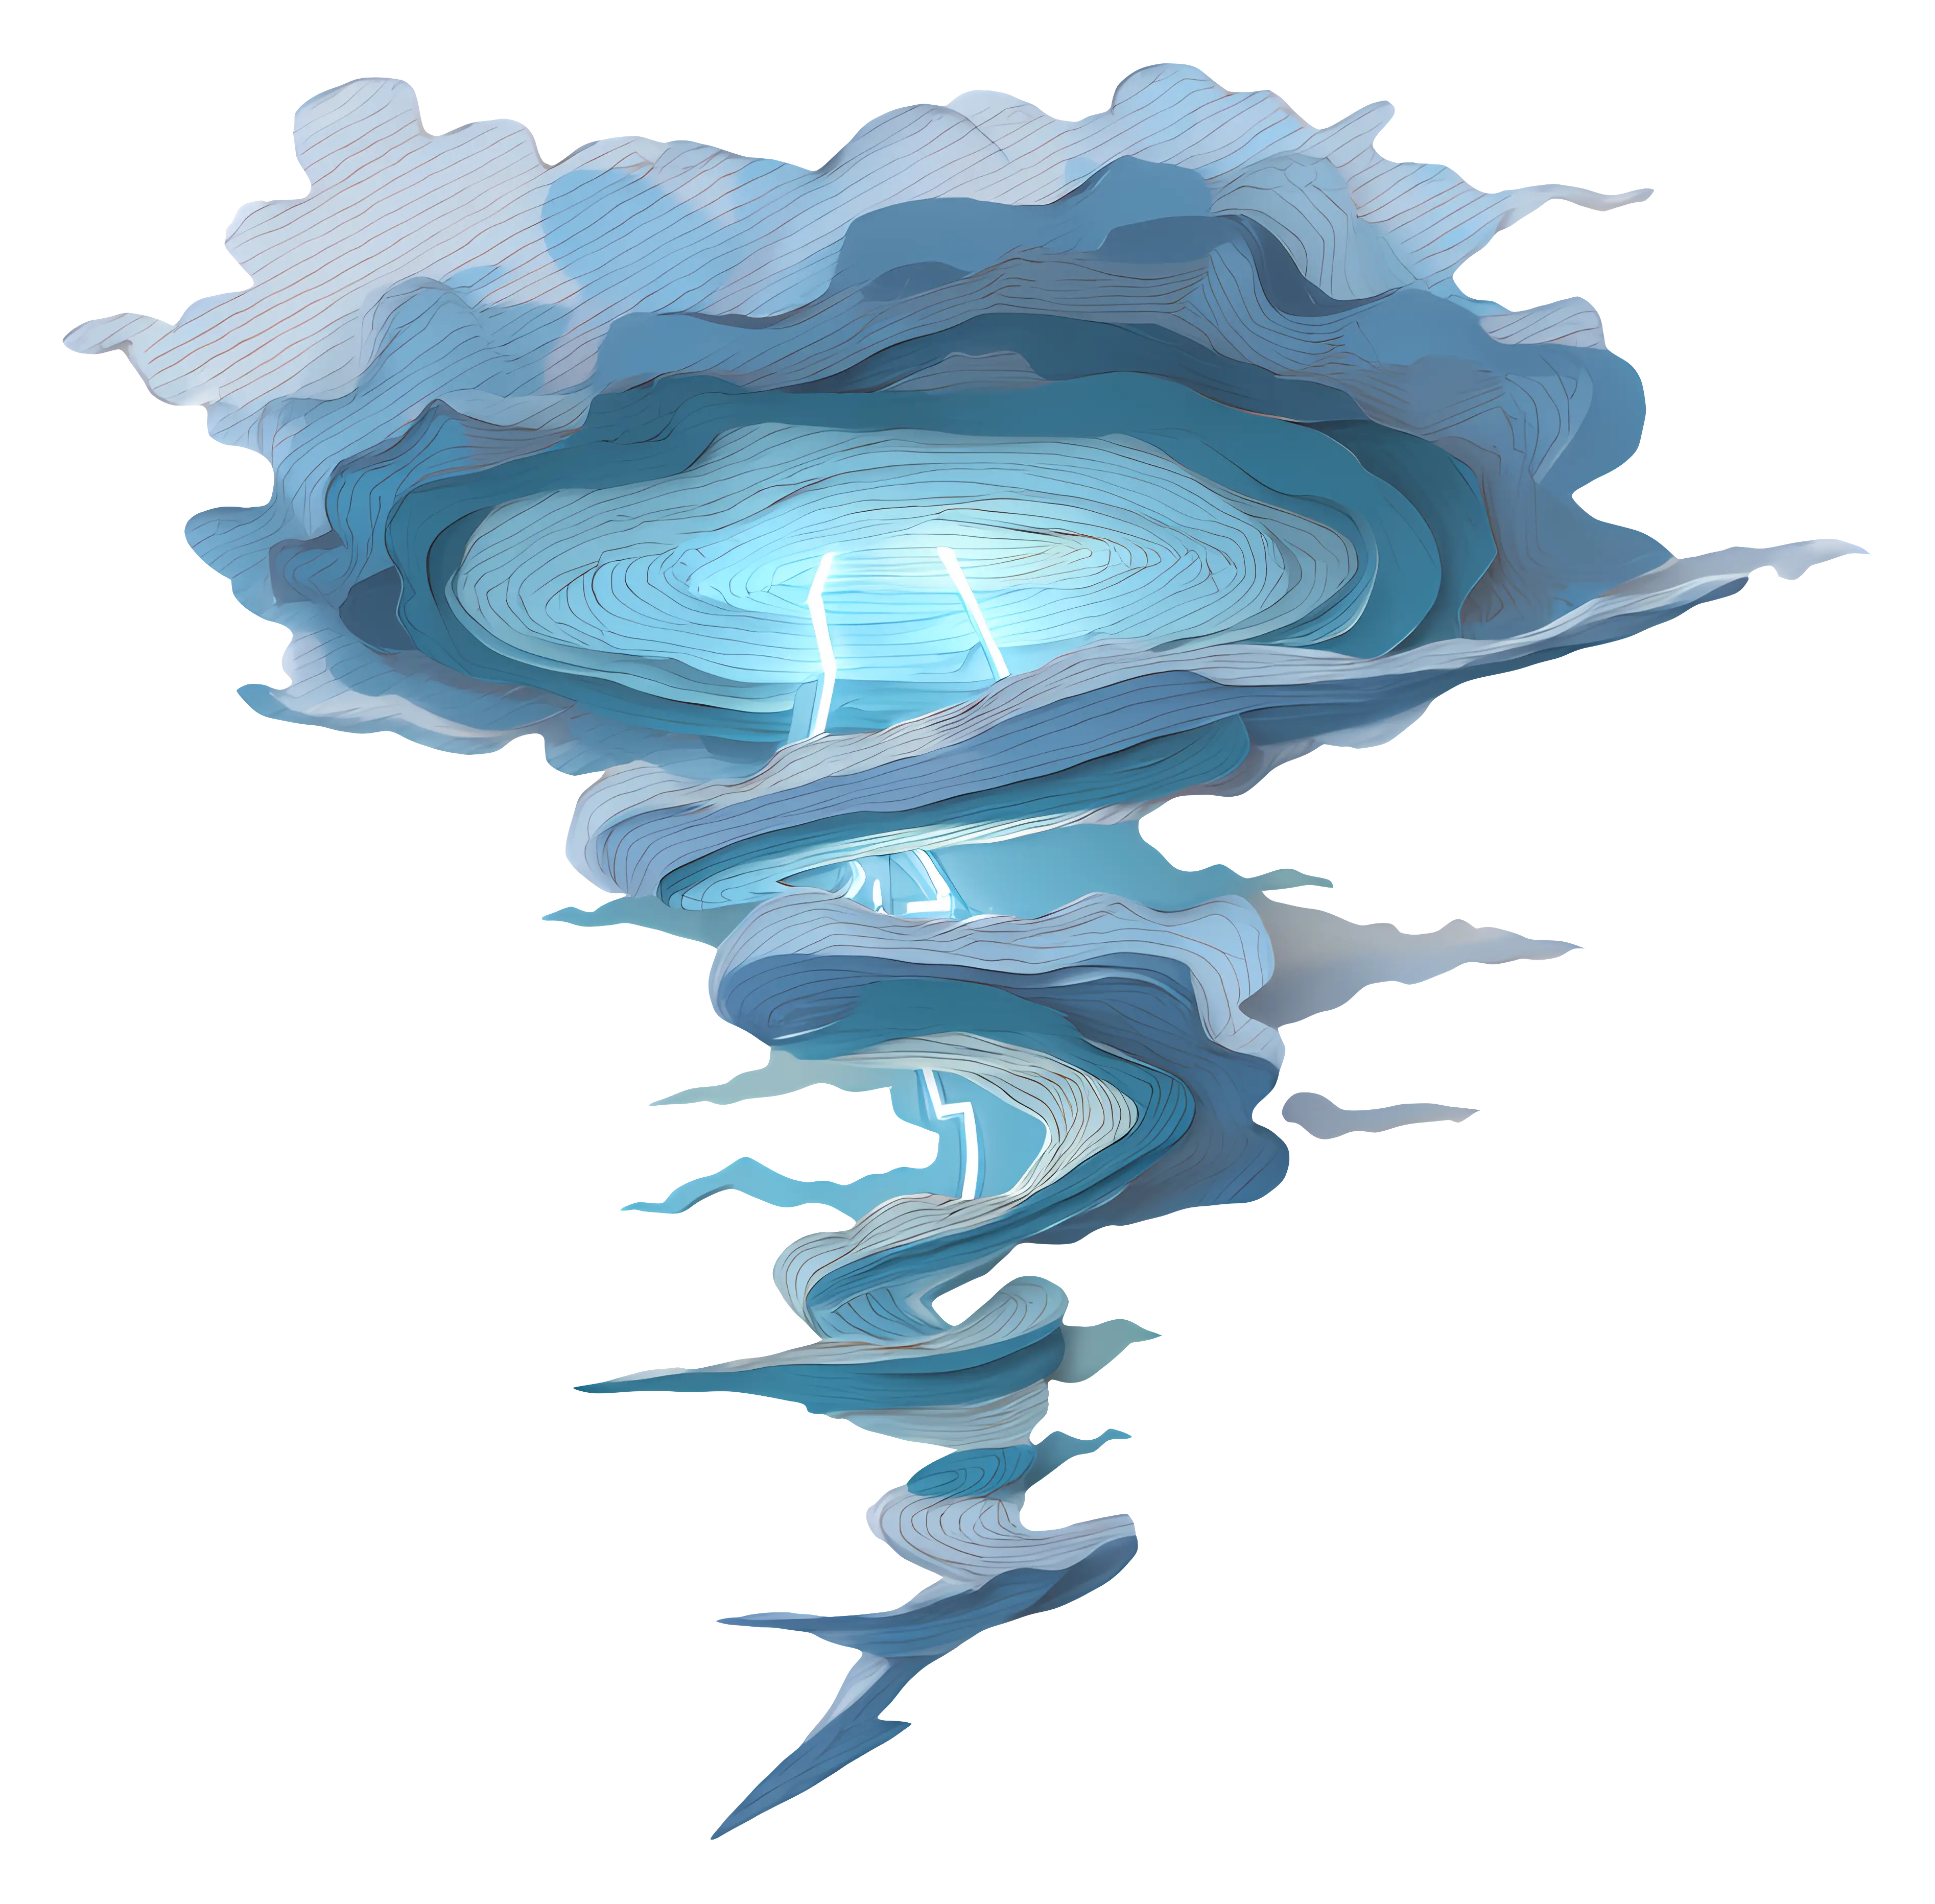
Storm Cloud with Lightning -
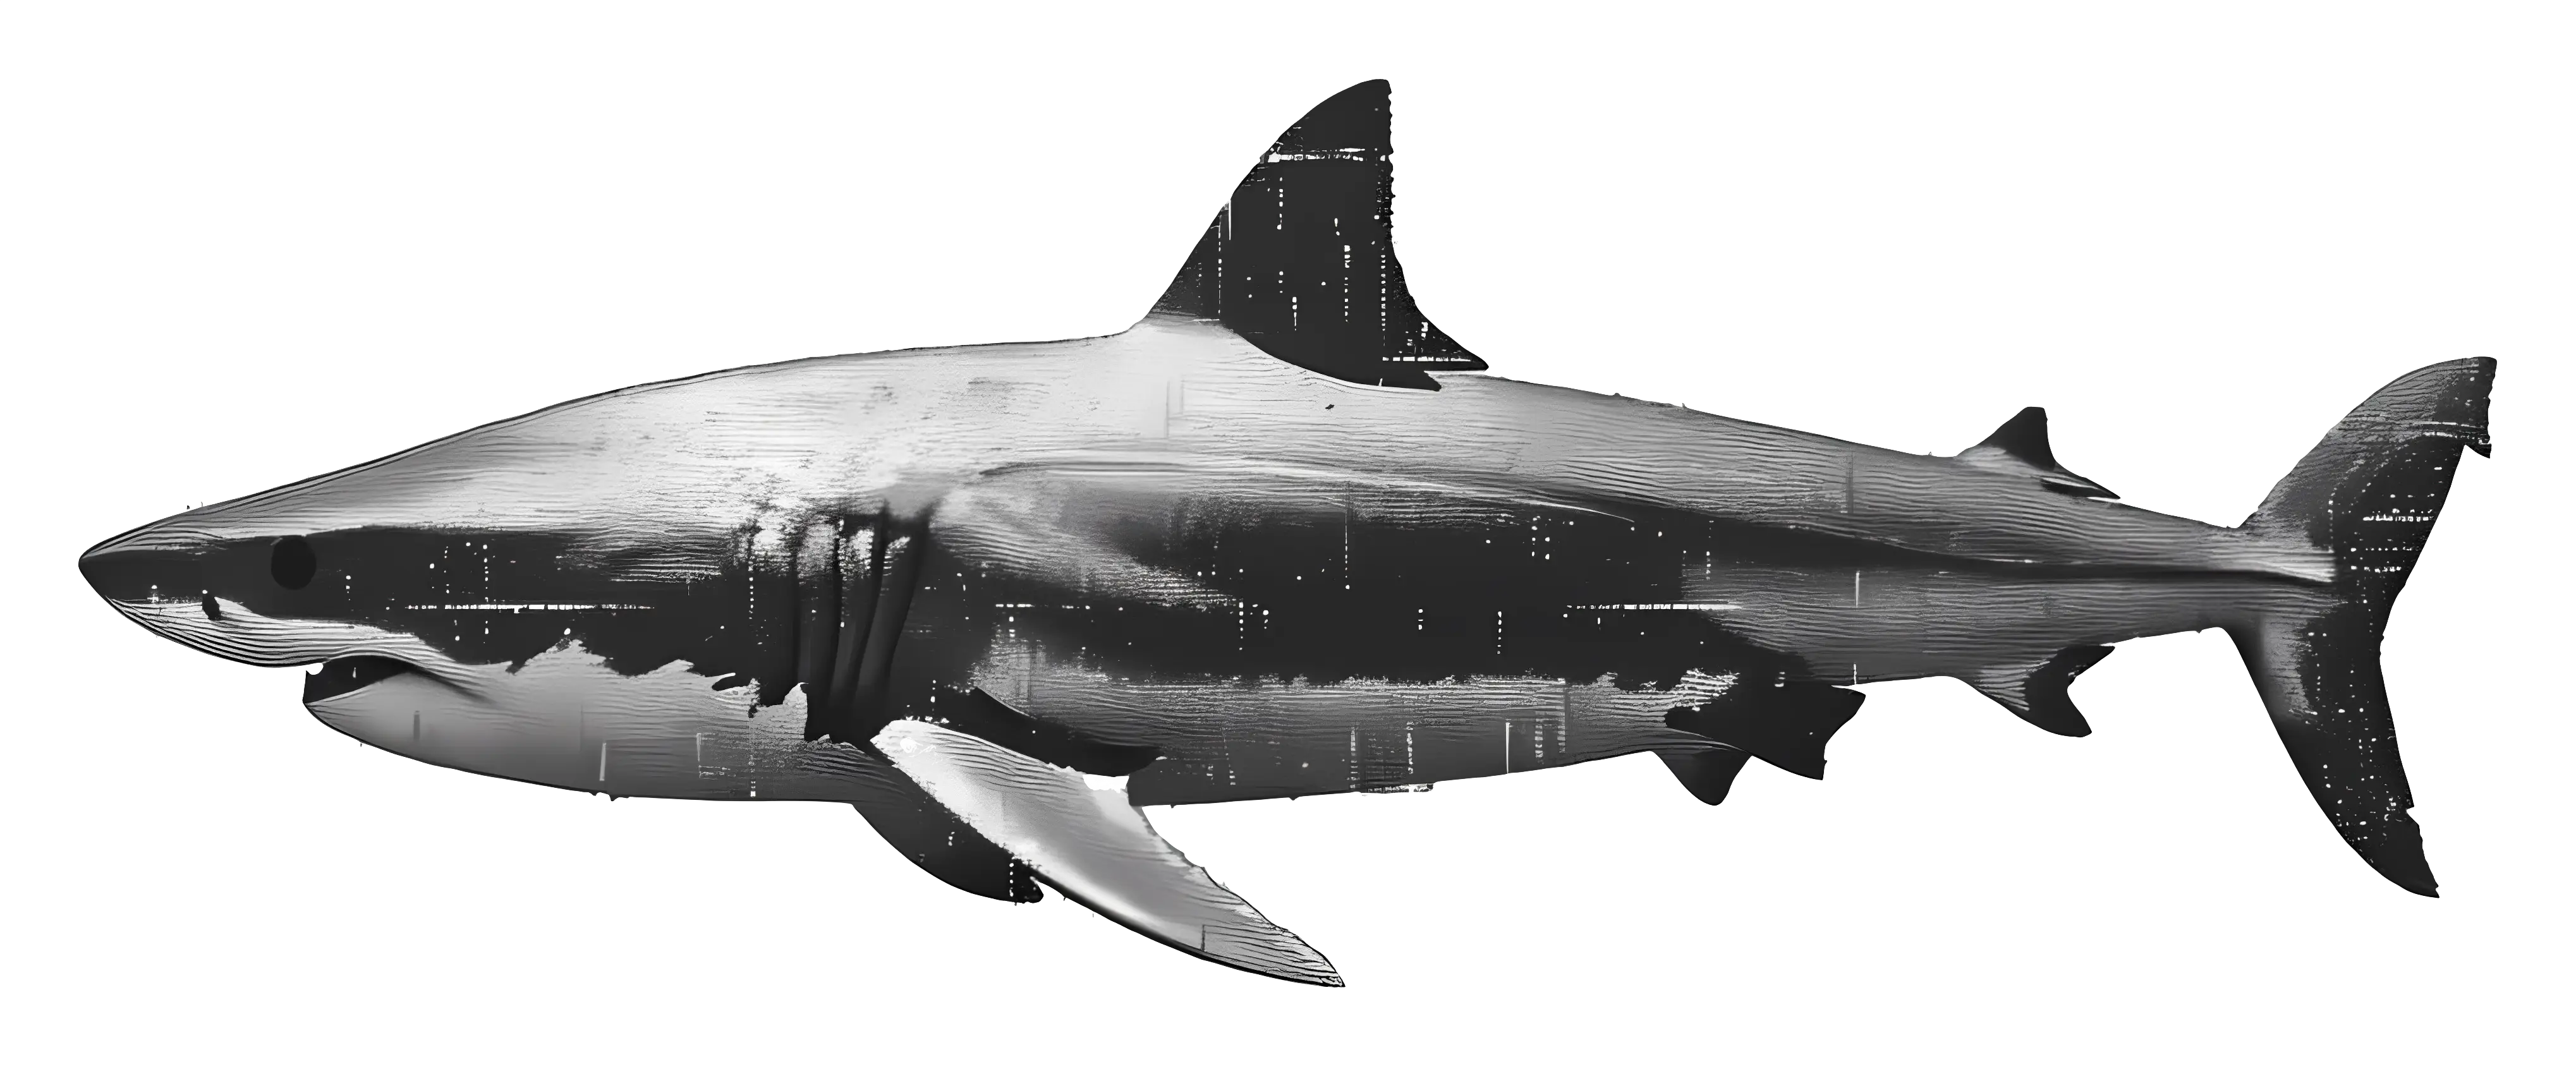
Realistic Shark Illustration -
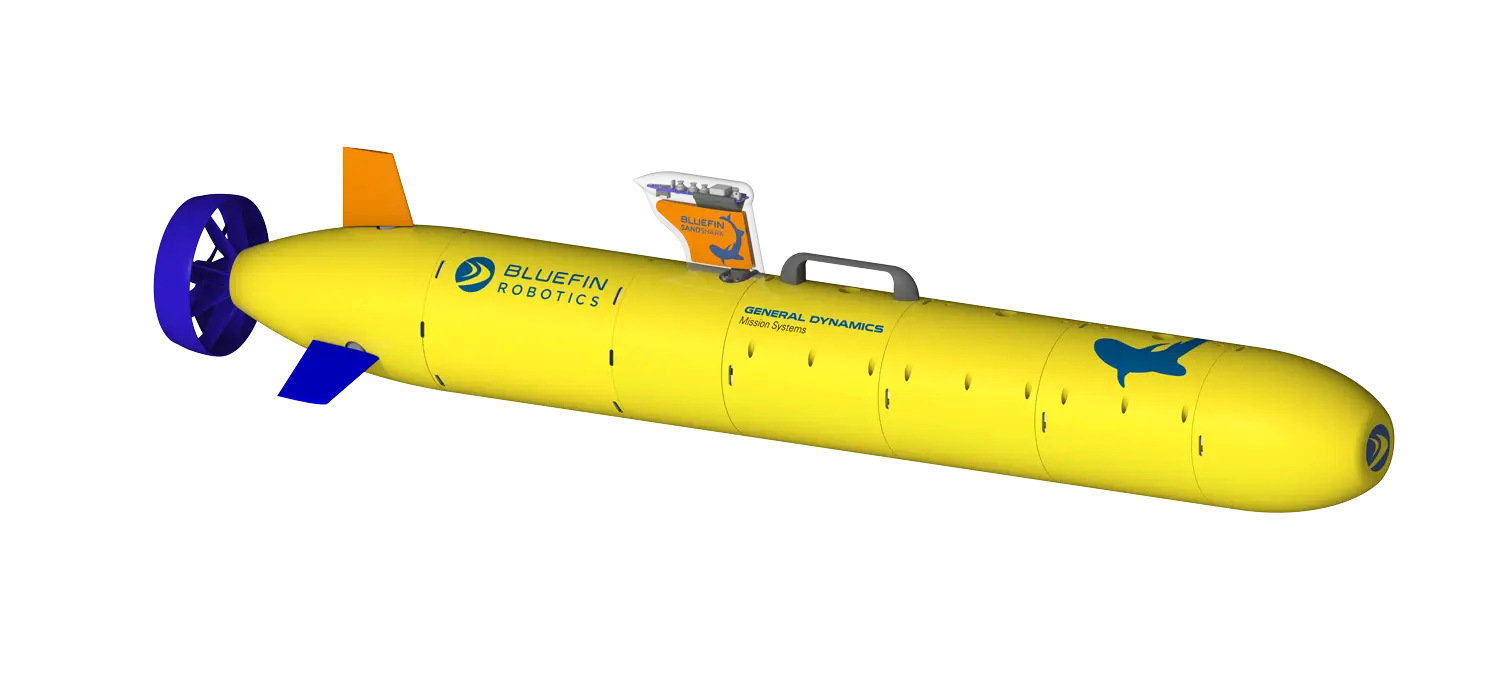
Yellow Submarine for Ocean Exploration -
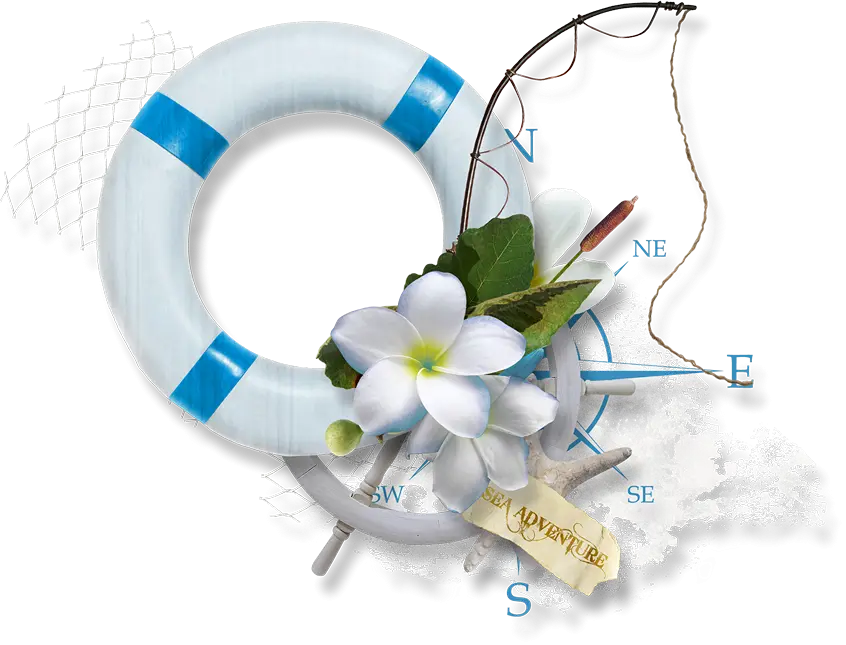
Nautical Decor with Lifebuoy and Flowers -
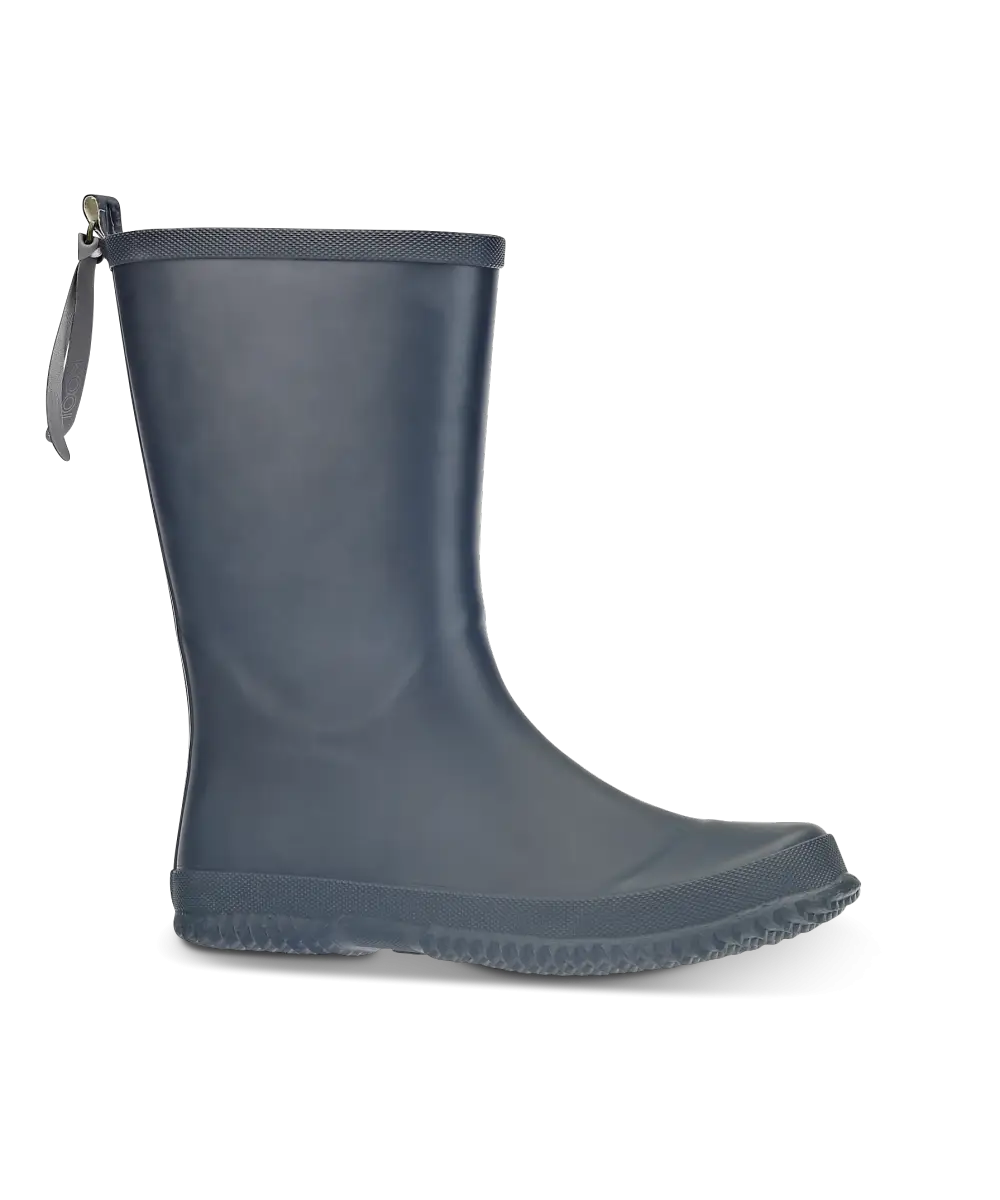
Classic Black Rubber Rain Boot -
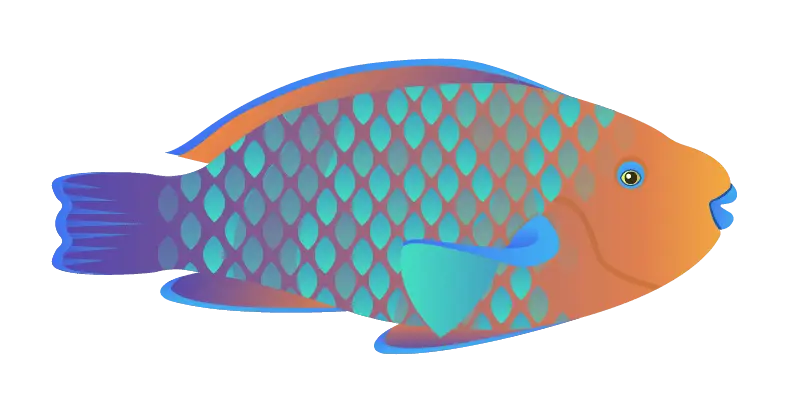
Colorful Fish Illustration -
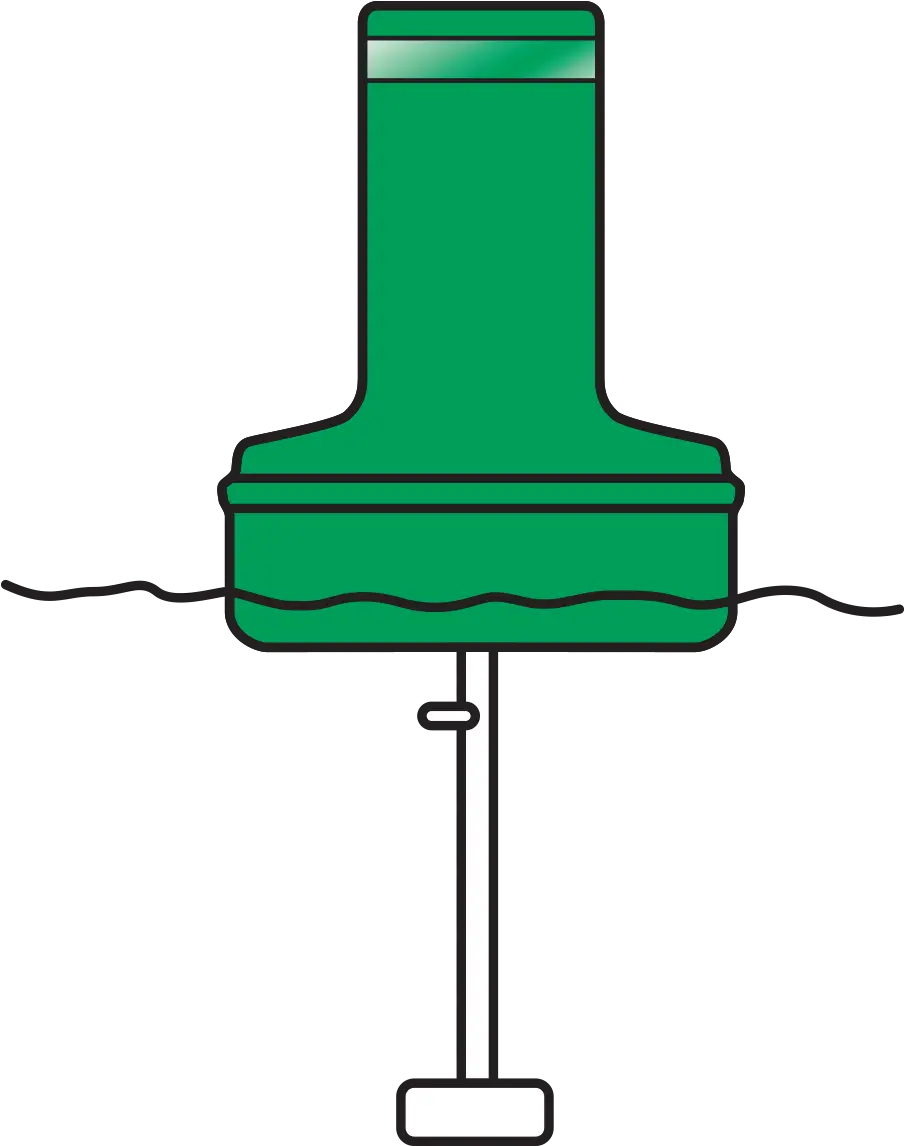
Green Buoy Floating in Water -
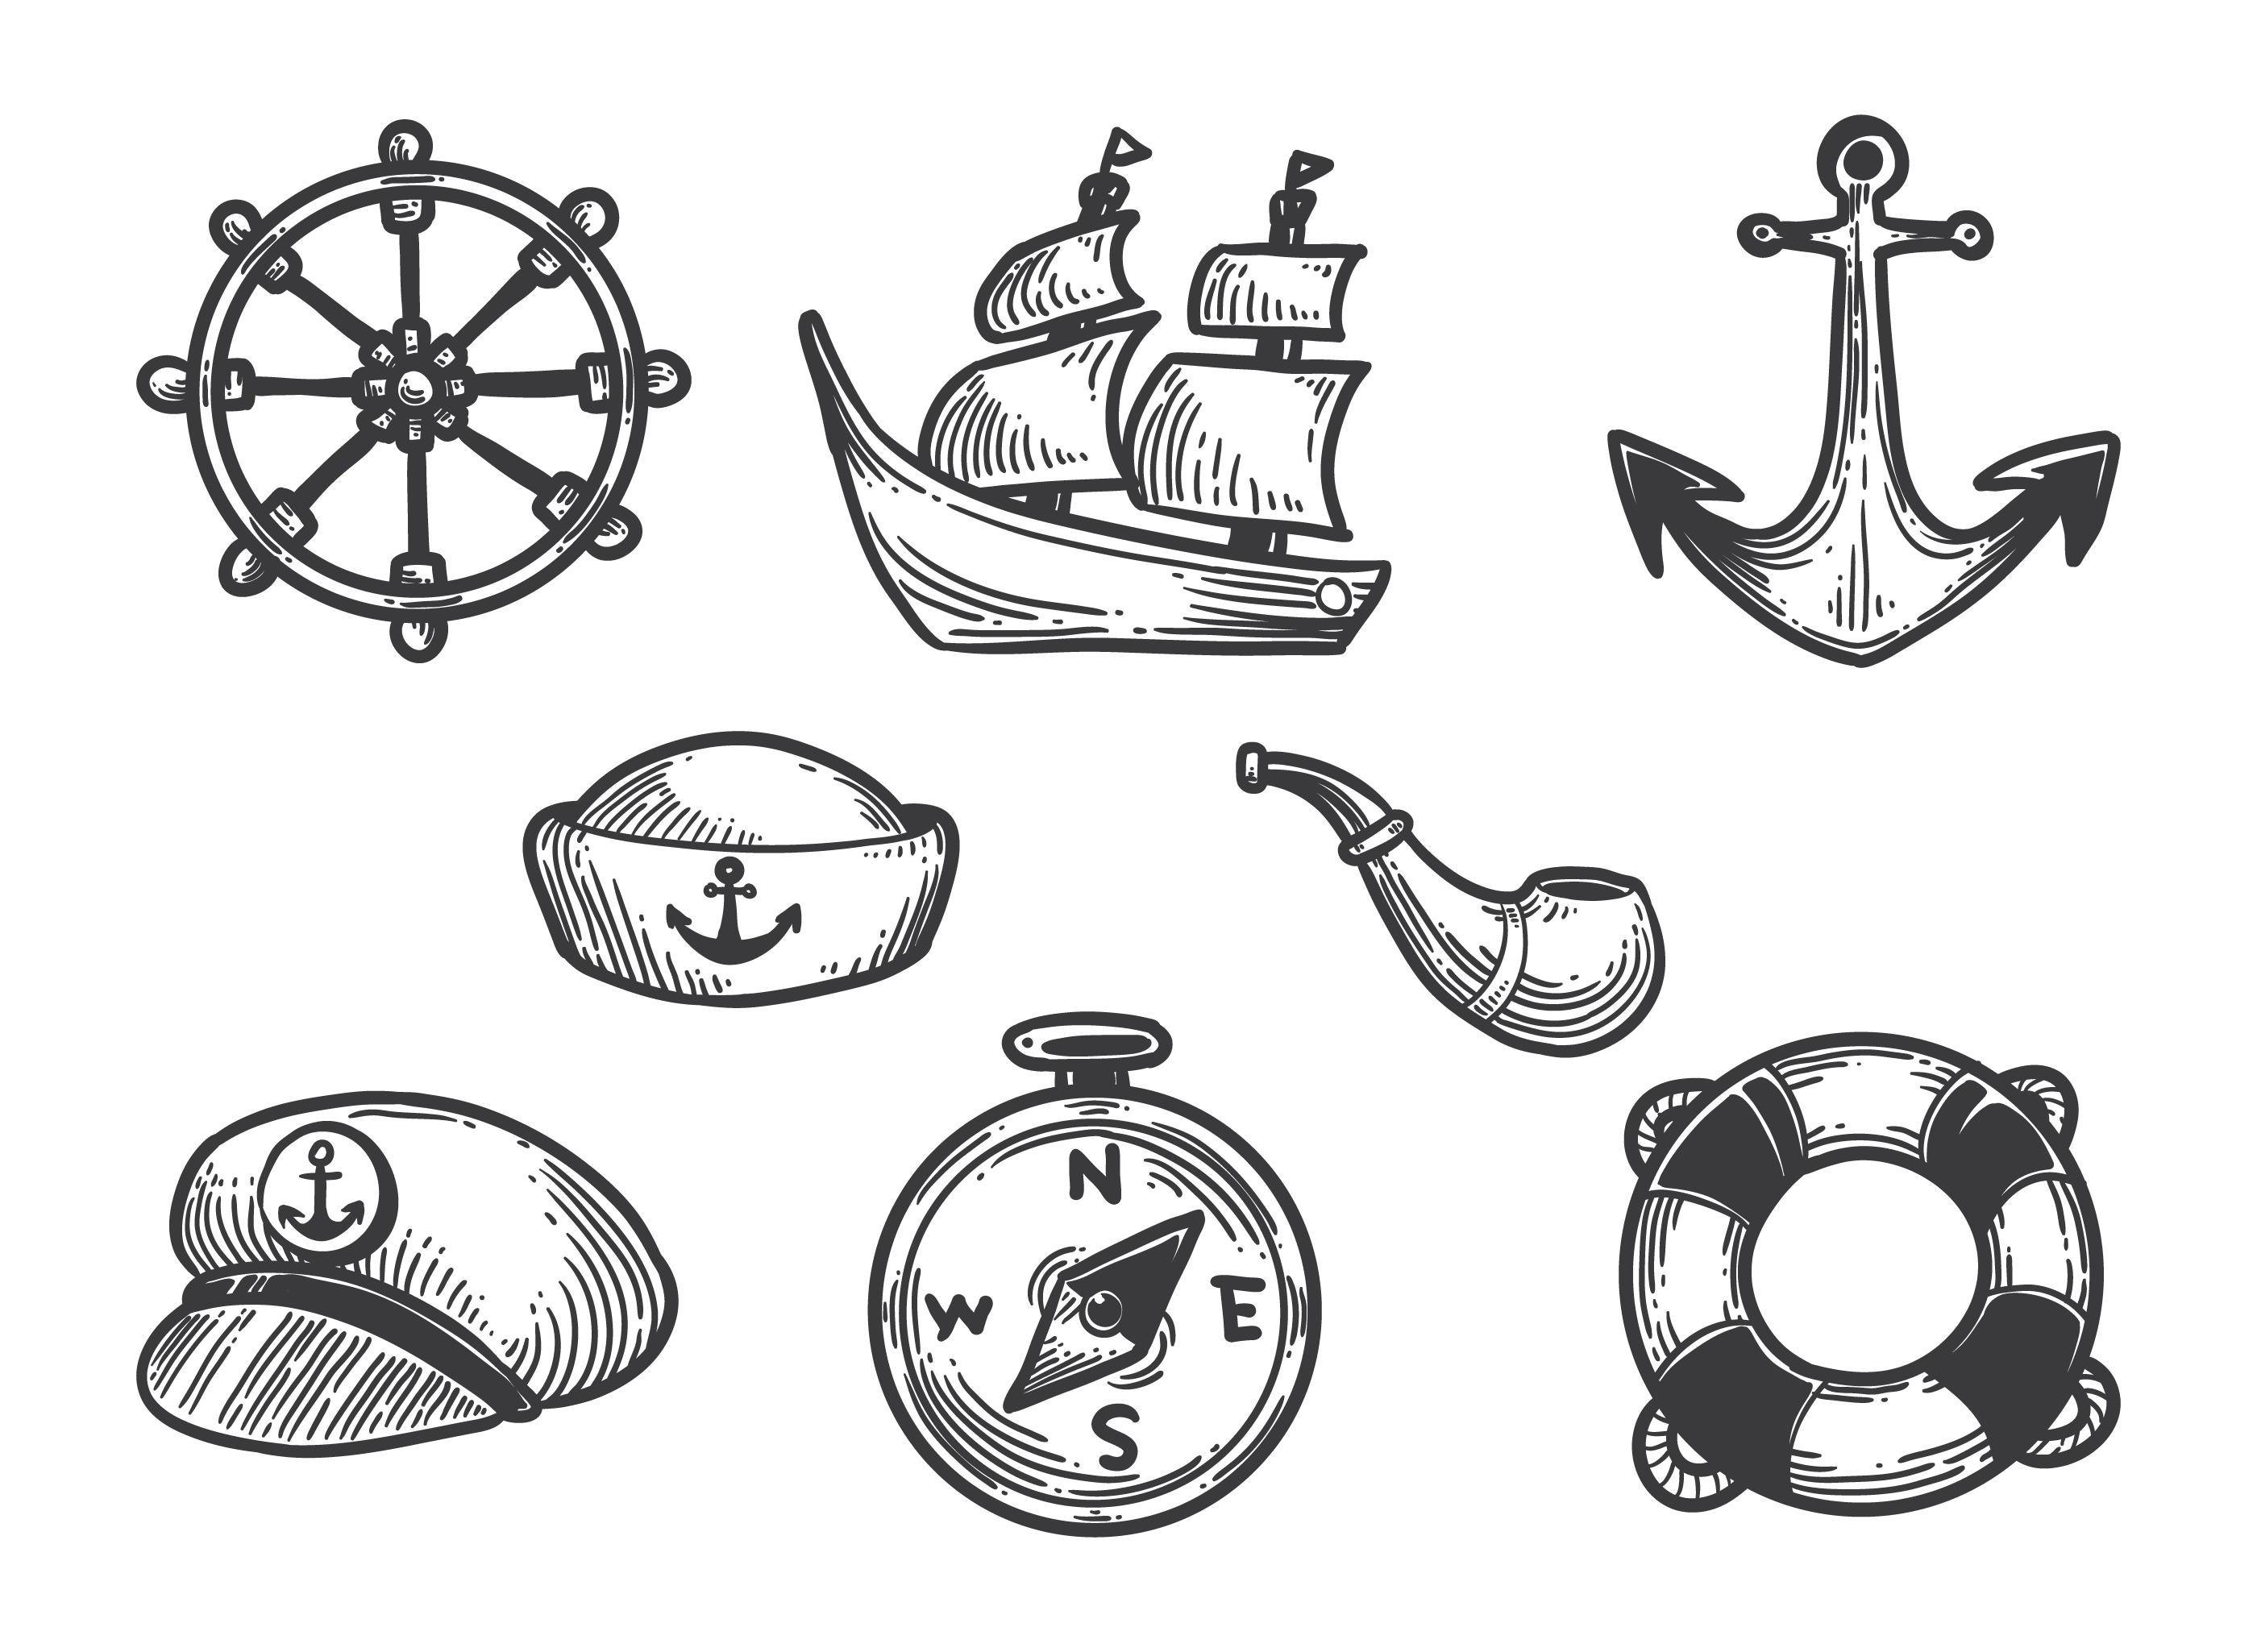
Vintage Nautical Icon Set with Marine Themes -
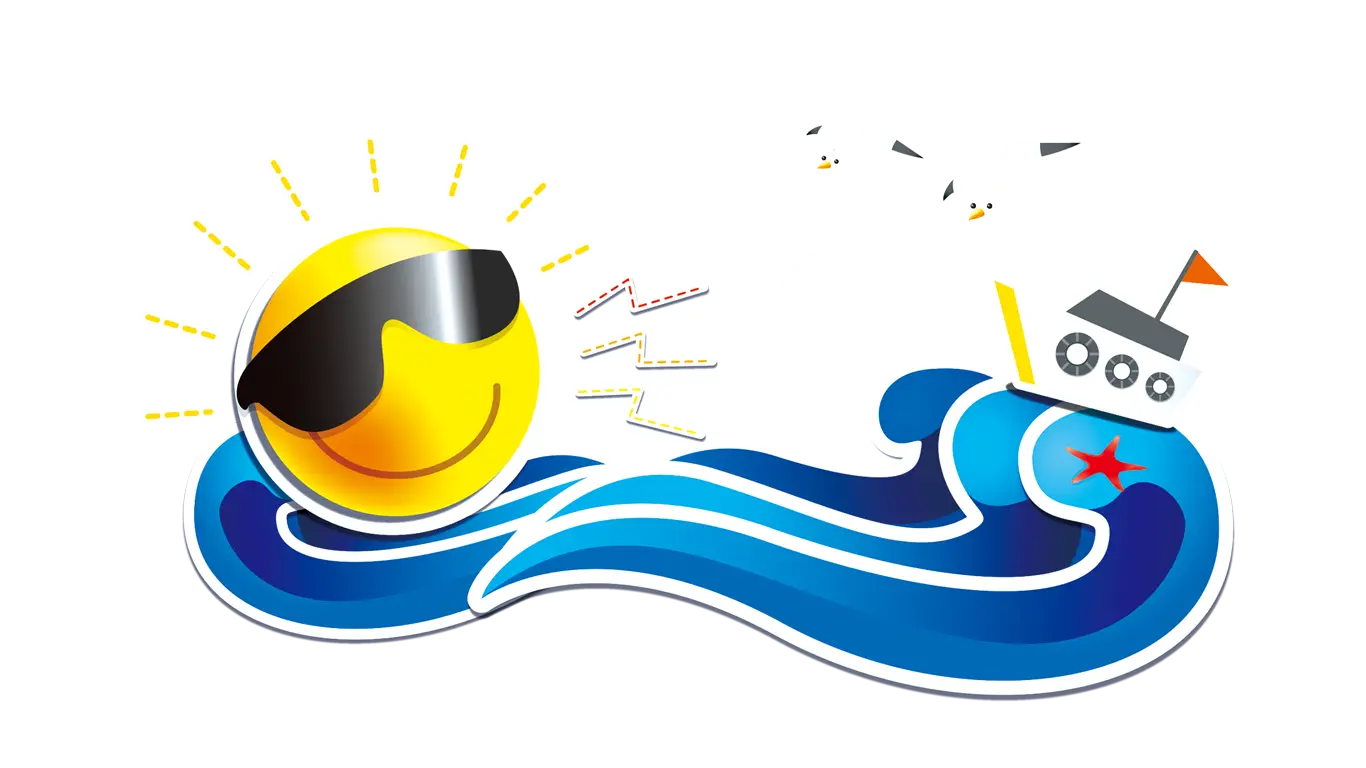
Cool Sun with Sunglasses at the Beach -
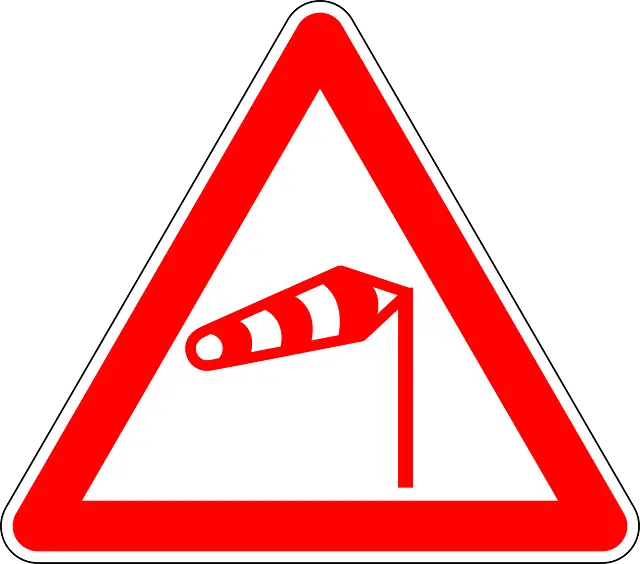
Red Triangle Wind Warning Road Sign