You Might Like
-

Hand Holding Plant with Energy Symbol -
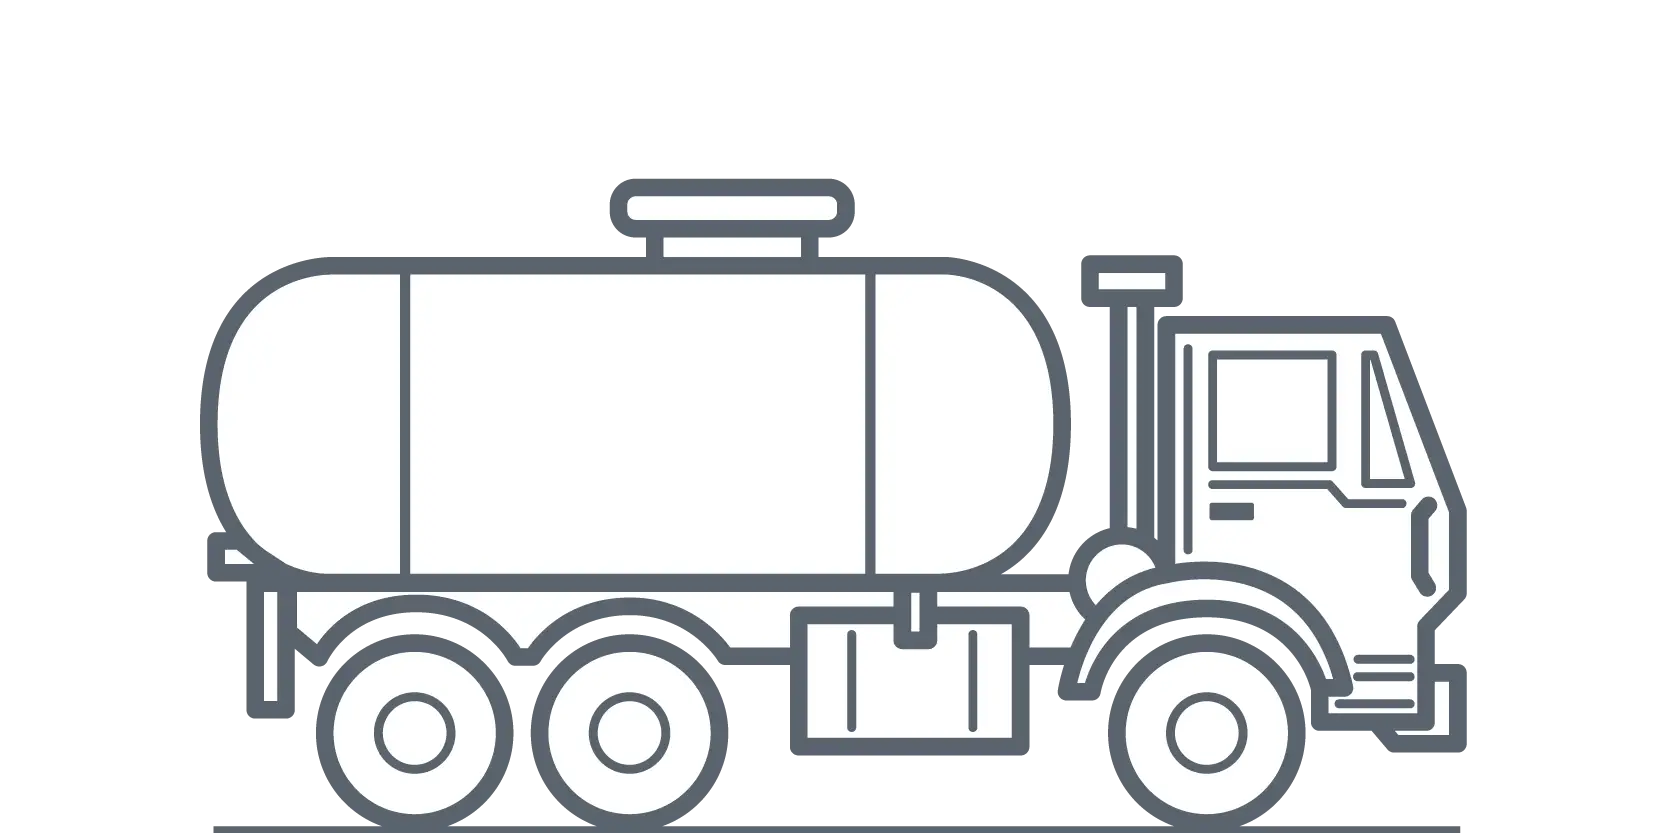
Tanker Truck Illustration in Outline Style -

Red Fire Symbol Flames Icon -
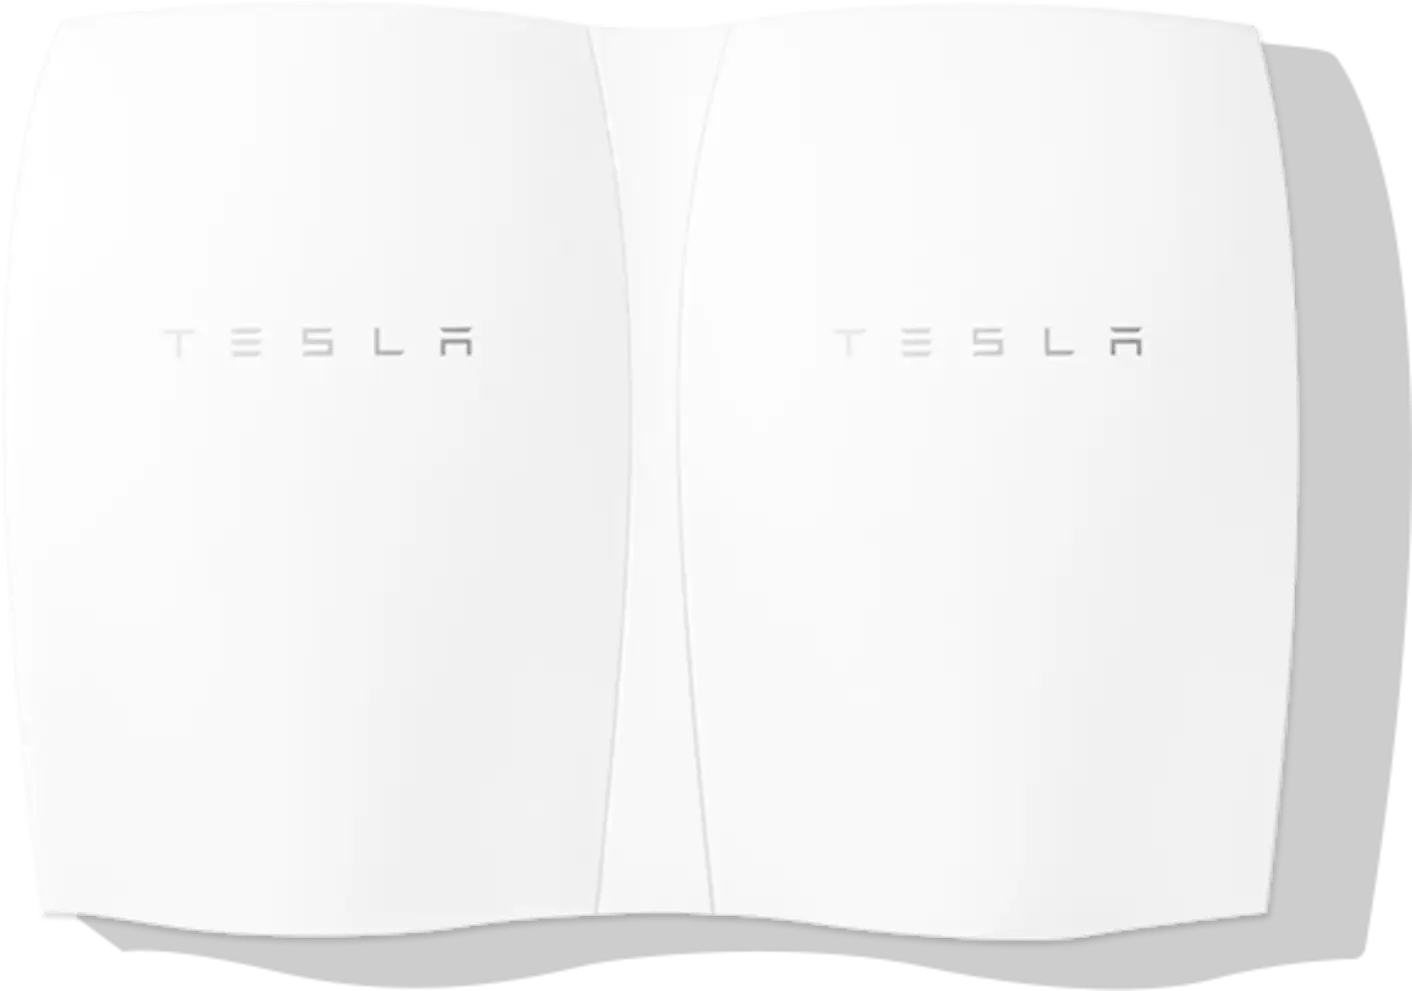
White Tesla Powerwall Energy Storage -
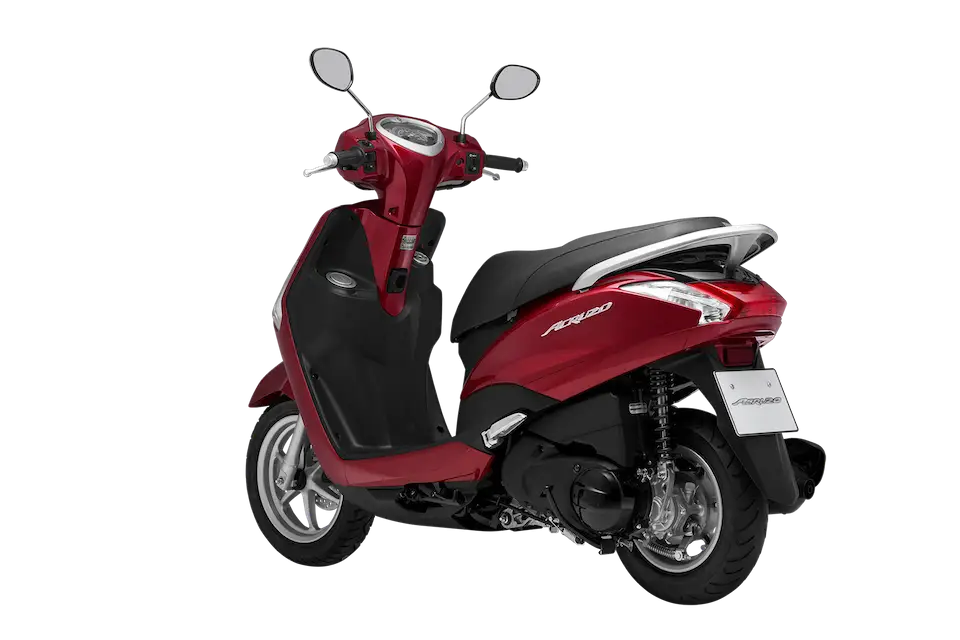
Red Scooter for Urban Mobility -
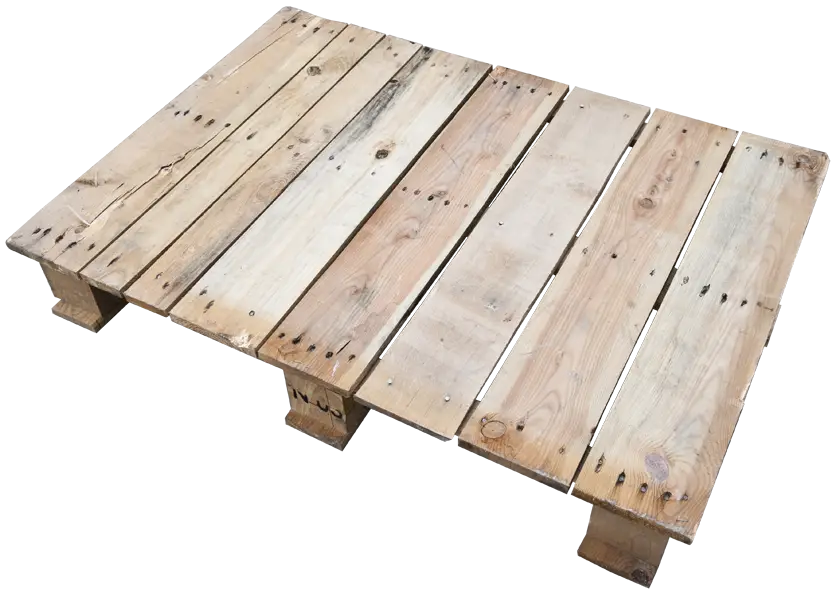
Wooden Pallet For Storage and Shipping -
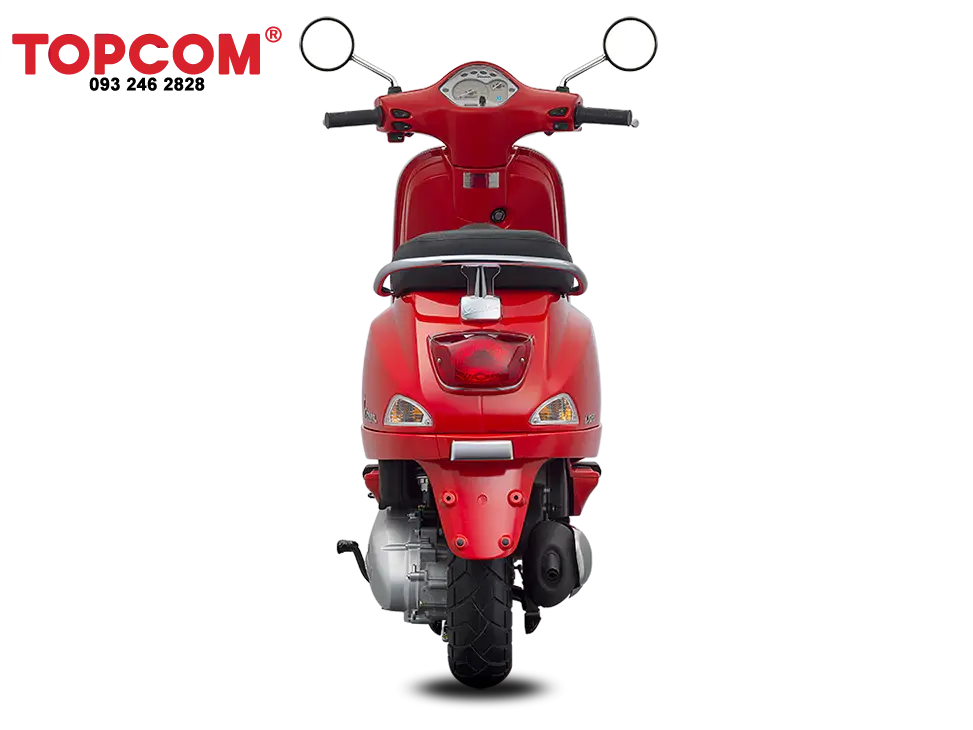
Red Electric Scooter -
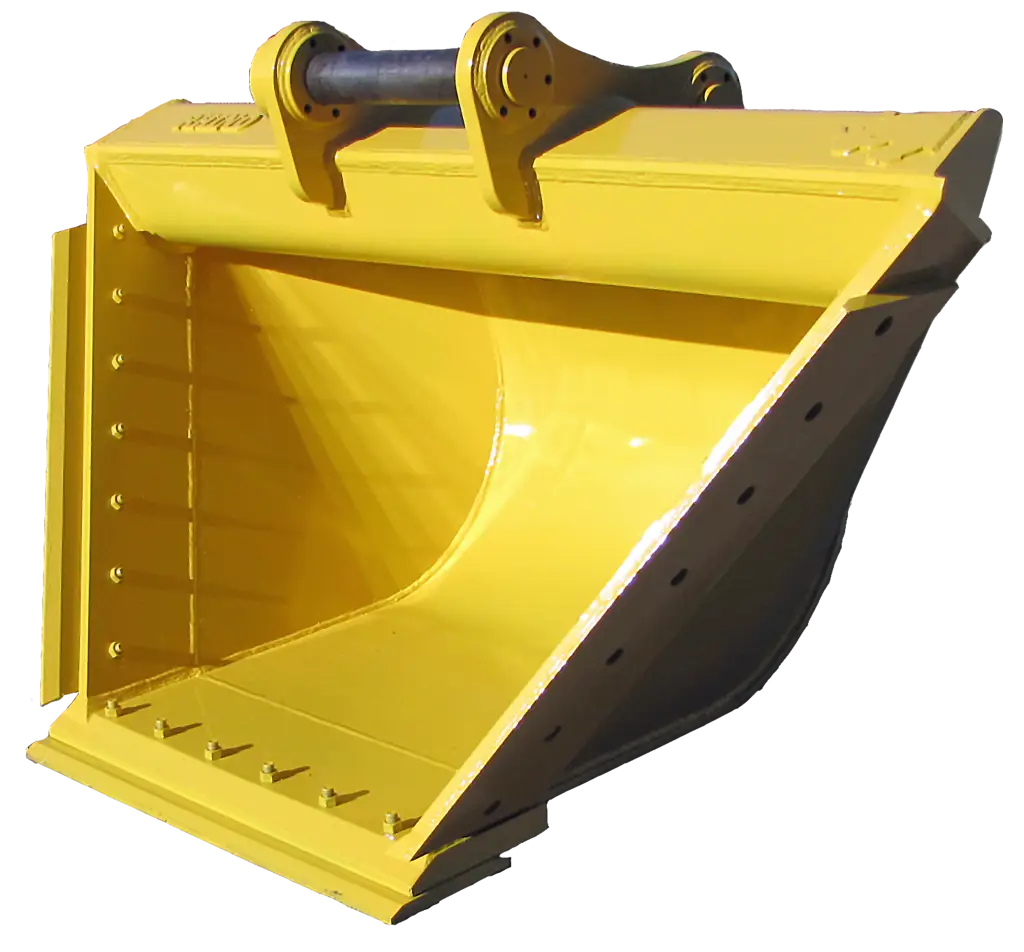
Yellow Excavator Bucket for Construction -

Paint Splash Fun -

Simple Nuclear Power Plant Icon -

Cute Hot Dog Truck -

Eco-Friendly Nuclear Power Plant Symbol -

SMC Corporate Logo Design -

Karate Kids in Action -
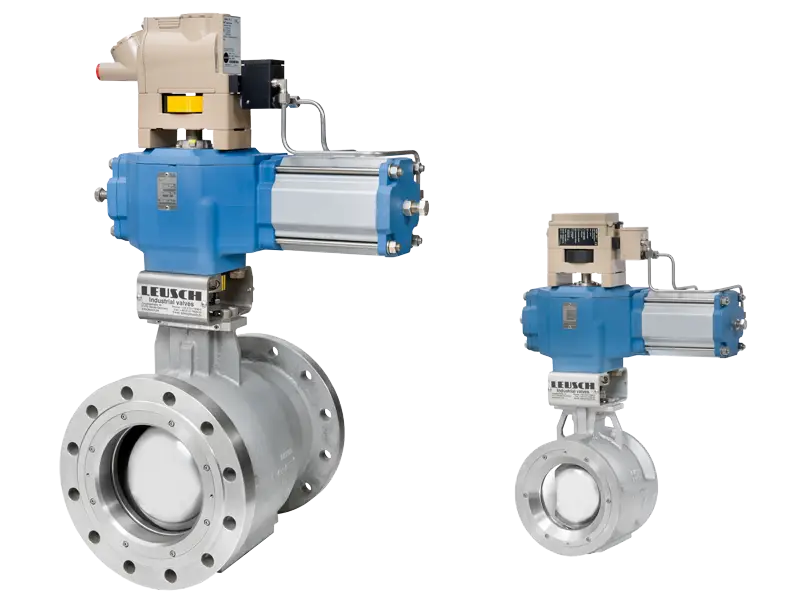
Industrial Valve System Design -

Emirates Gas Company Logo -

Metal Flange with Holes -
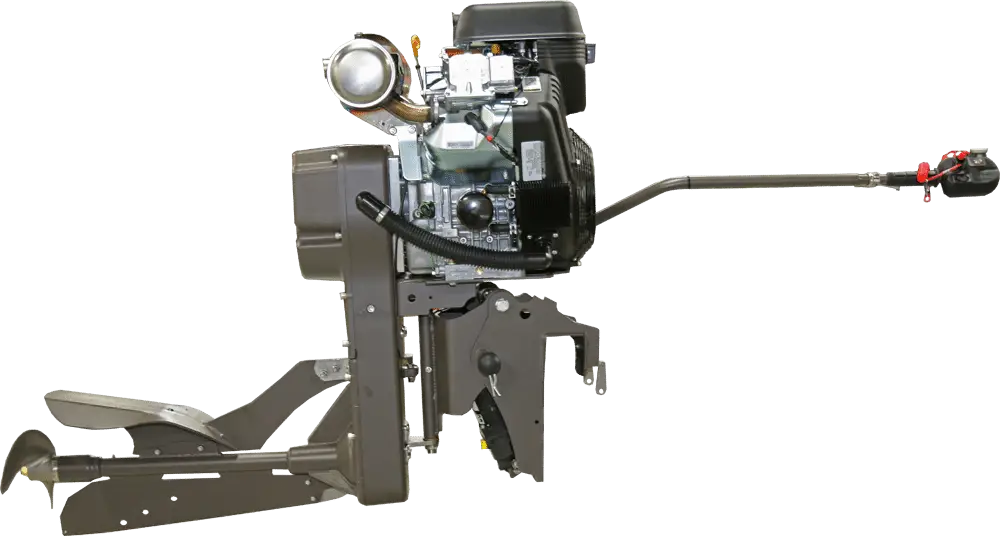
Powerful Engine Machinery -

Storm Cloud with Lightning -

Steampunk Mechanical Wings -

Large Water Tank for Storage -

Precision Metal Gear Reducer for Industrial Use -

Cool Camper Van for Outdoor Adventures -

Colorful Oil Pump Jack -
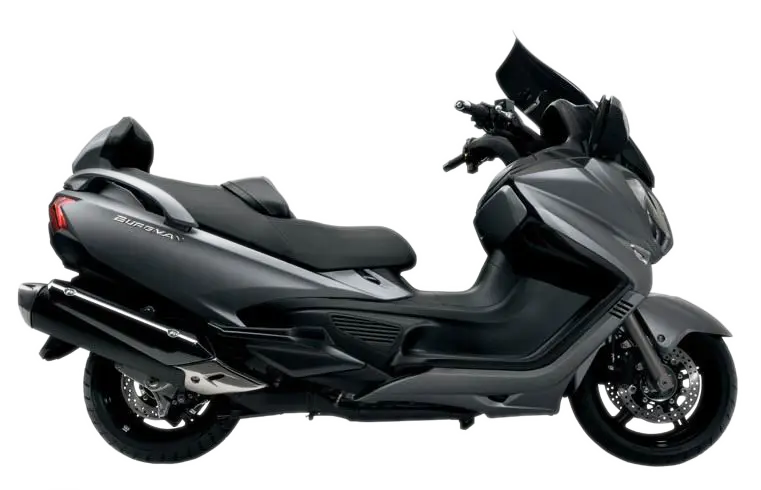
Black Modern Scooter -
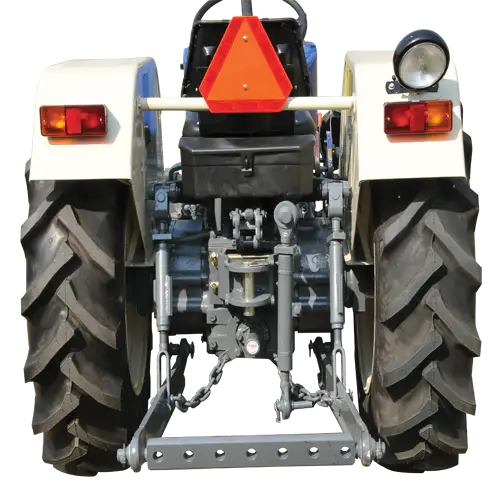
Back View of a Tractor for Agricultural Use -
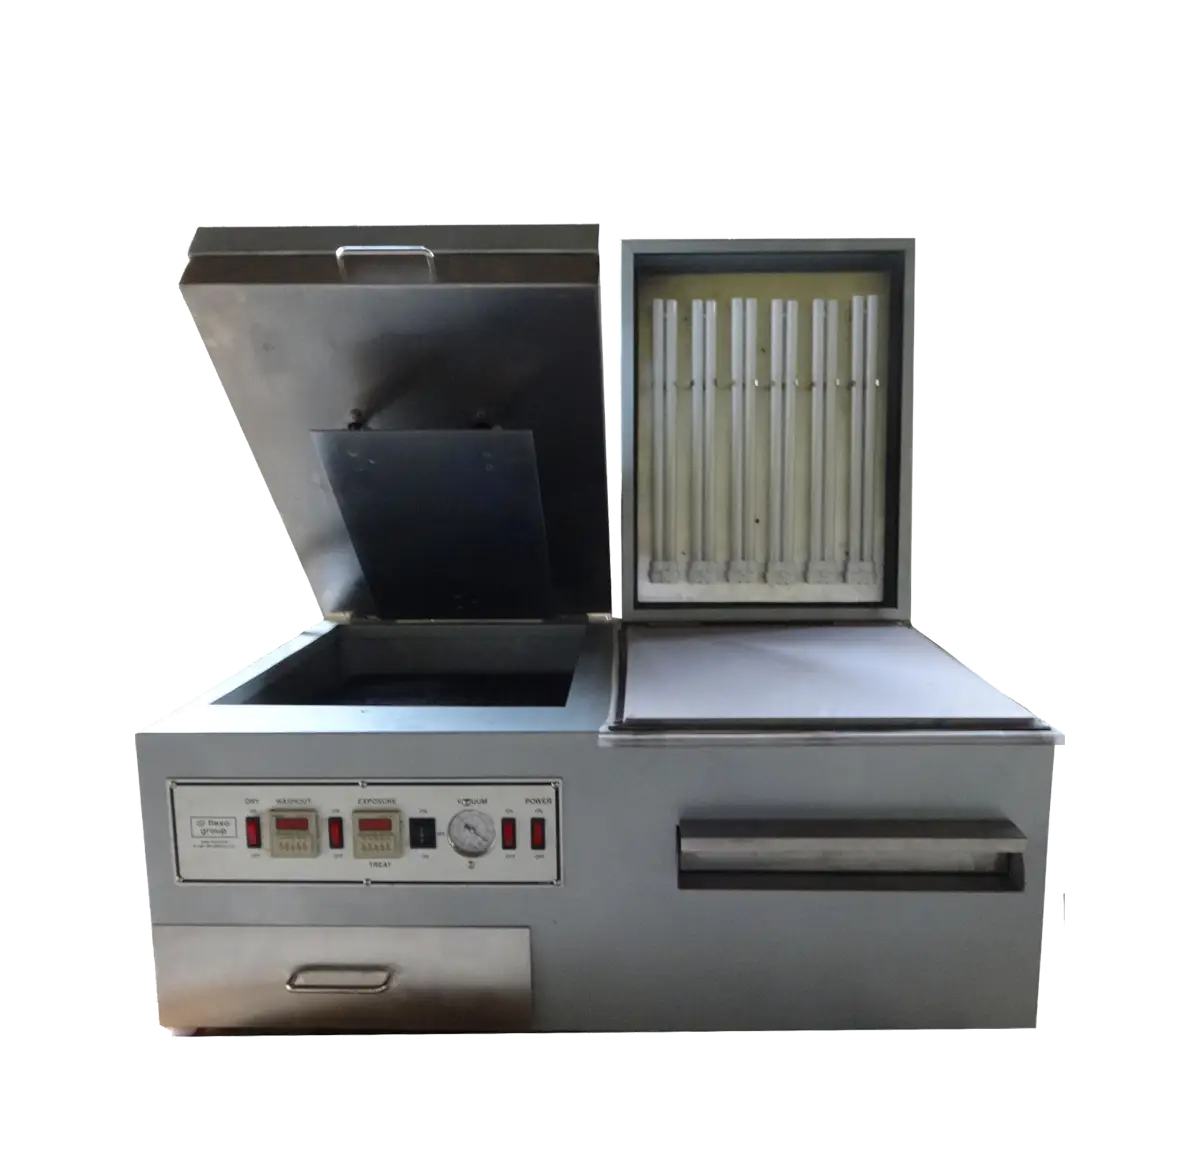
Industrial Machine for Manufacturing -
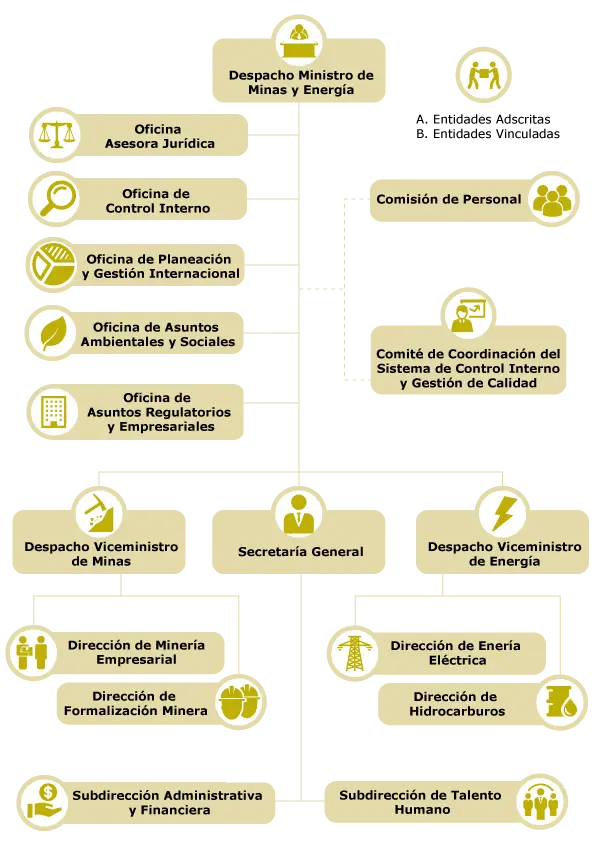
Ministry of Mines and Energy Organizational Chart -

Set of Blue Plastic Barrels -
Blue Ride-on Floor Scrubber Machine