
You Might Like
-

Digital Connector with Binary Code -

Communication Icon -

Blue Globe Network Icon -

Team with Growth Graph Illustration -

Hugging Figures Symbol Illustration -

Organizational Structure Chart -
Phone Symbol for Communication -

Magnet Attracting Figures -

Happy Children Holding Hands -

Icon of KPI Dashboard with Graph and Person -

Zigzag Down Arrow Icon for Decline Representation -

Magnifying Glass with Blue Lens -

Handprint with Spiral Design -
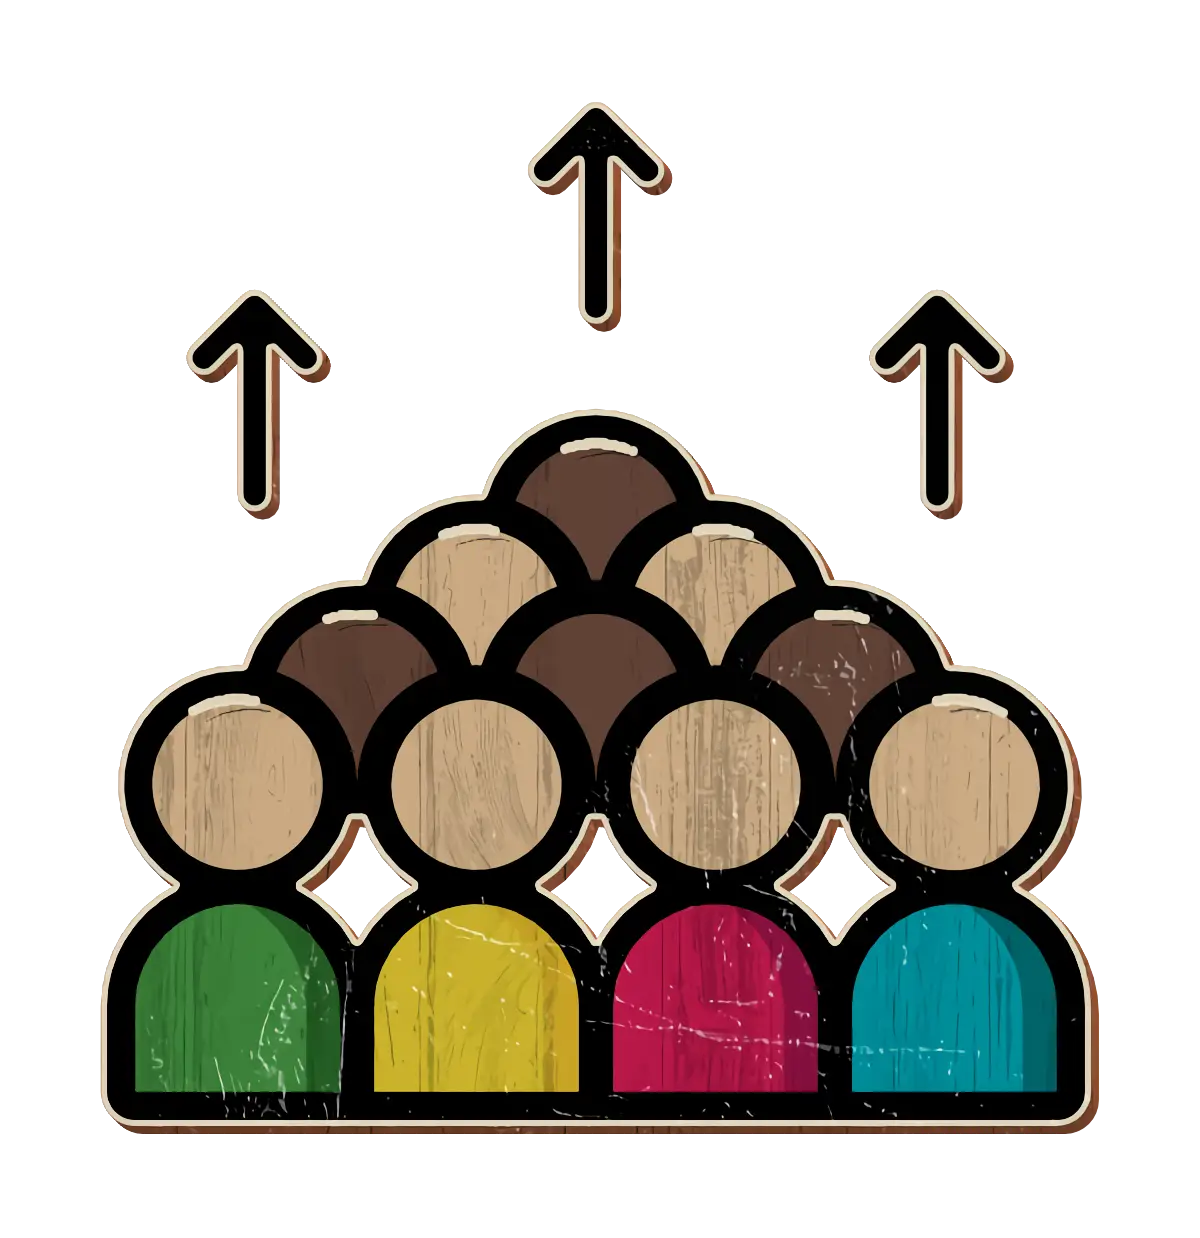
Group of People with Upward Arrows -

Yellow Ethernet Cable for Network Connections -

Bar Chart with Upward Arrow -

Infographic Pencil with Data Elements -

Graph Plot with Blue Curve Illustration -

Black and White Gears Icons -

Search Growth Icon -

Illustration of Growth Chart with Upward Arrow -
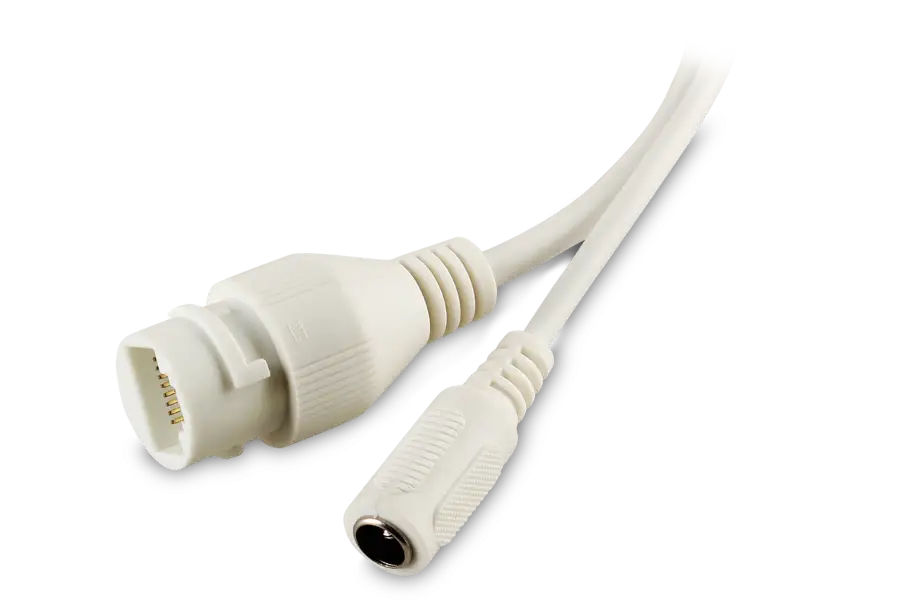
White Cable Connector for Technology Devices -

Love Gesture Hand Emoji -
Circular Arrows Representing Cycle or Loop -

Romantic Tower Scene with Flowers and Ladder -

Illustration of Call Center Network Connections -
Blue Ethernet Cables with Connectors for Networking -

Black Magnifying Glass with Heart Icon -

Blue Declining Bar Graph with Arrow -

Black Handshake Icon