You Might Like
-
Black Angle Brackets Symbol -
Golden Geometric Star Design -
Colorful Geometric Sphere -
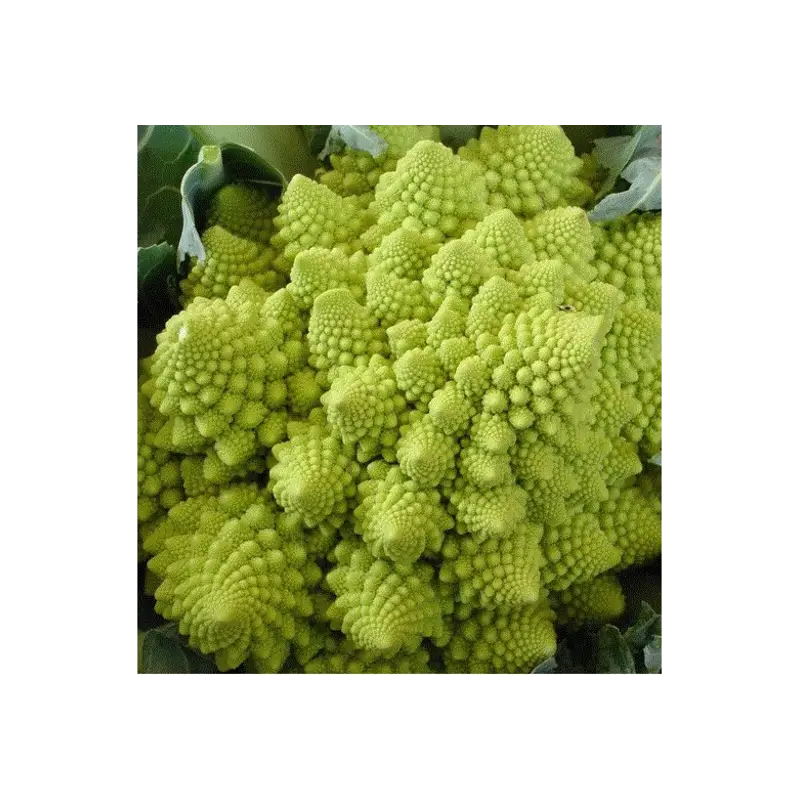
Green Romanesco Vegetable -
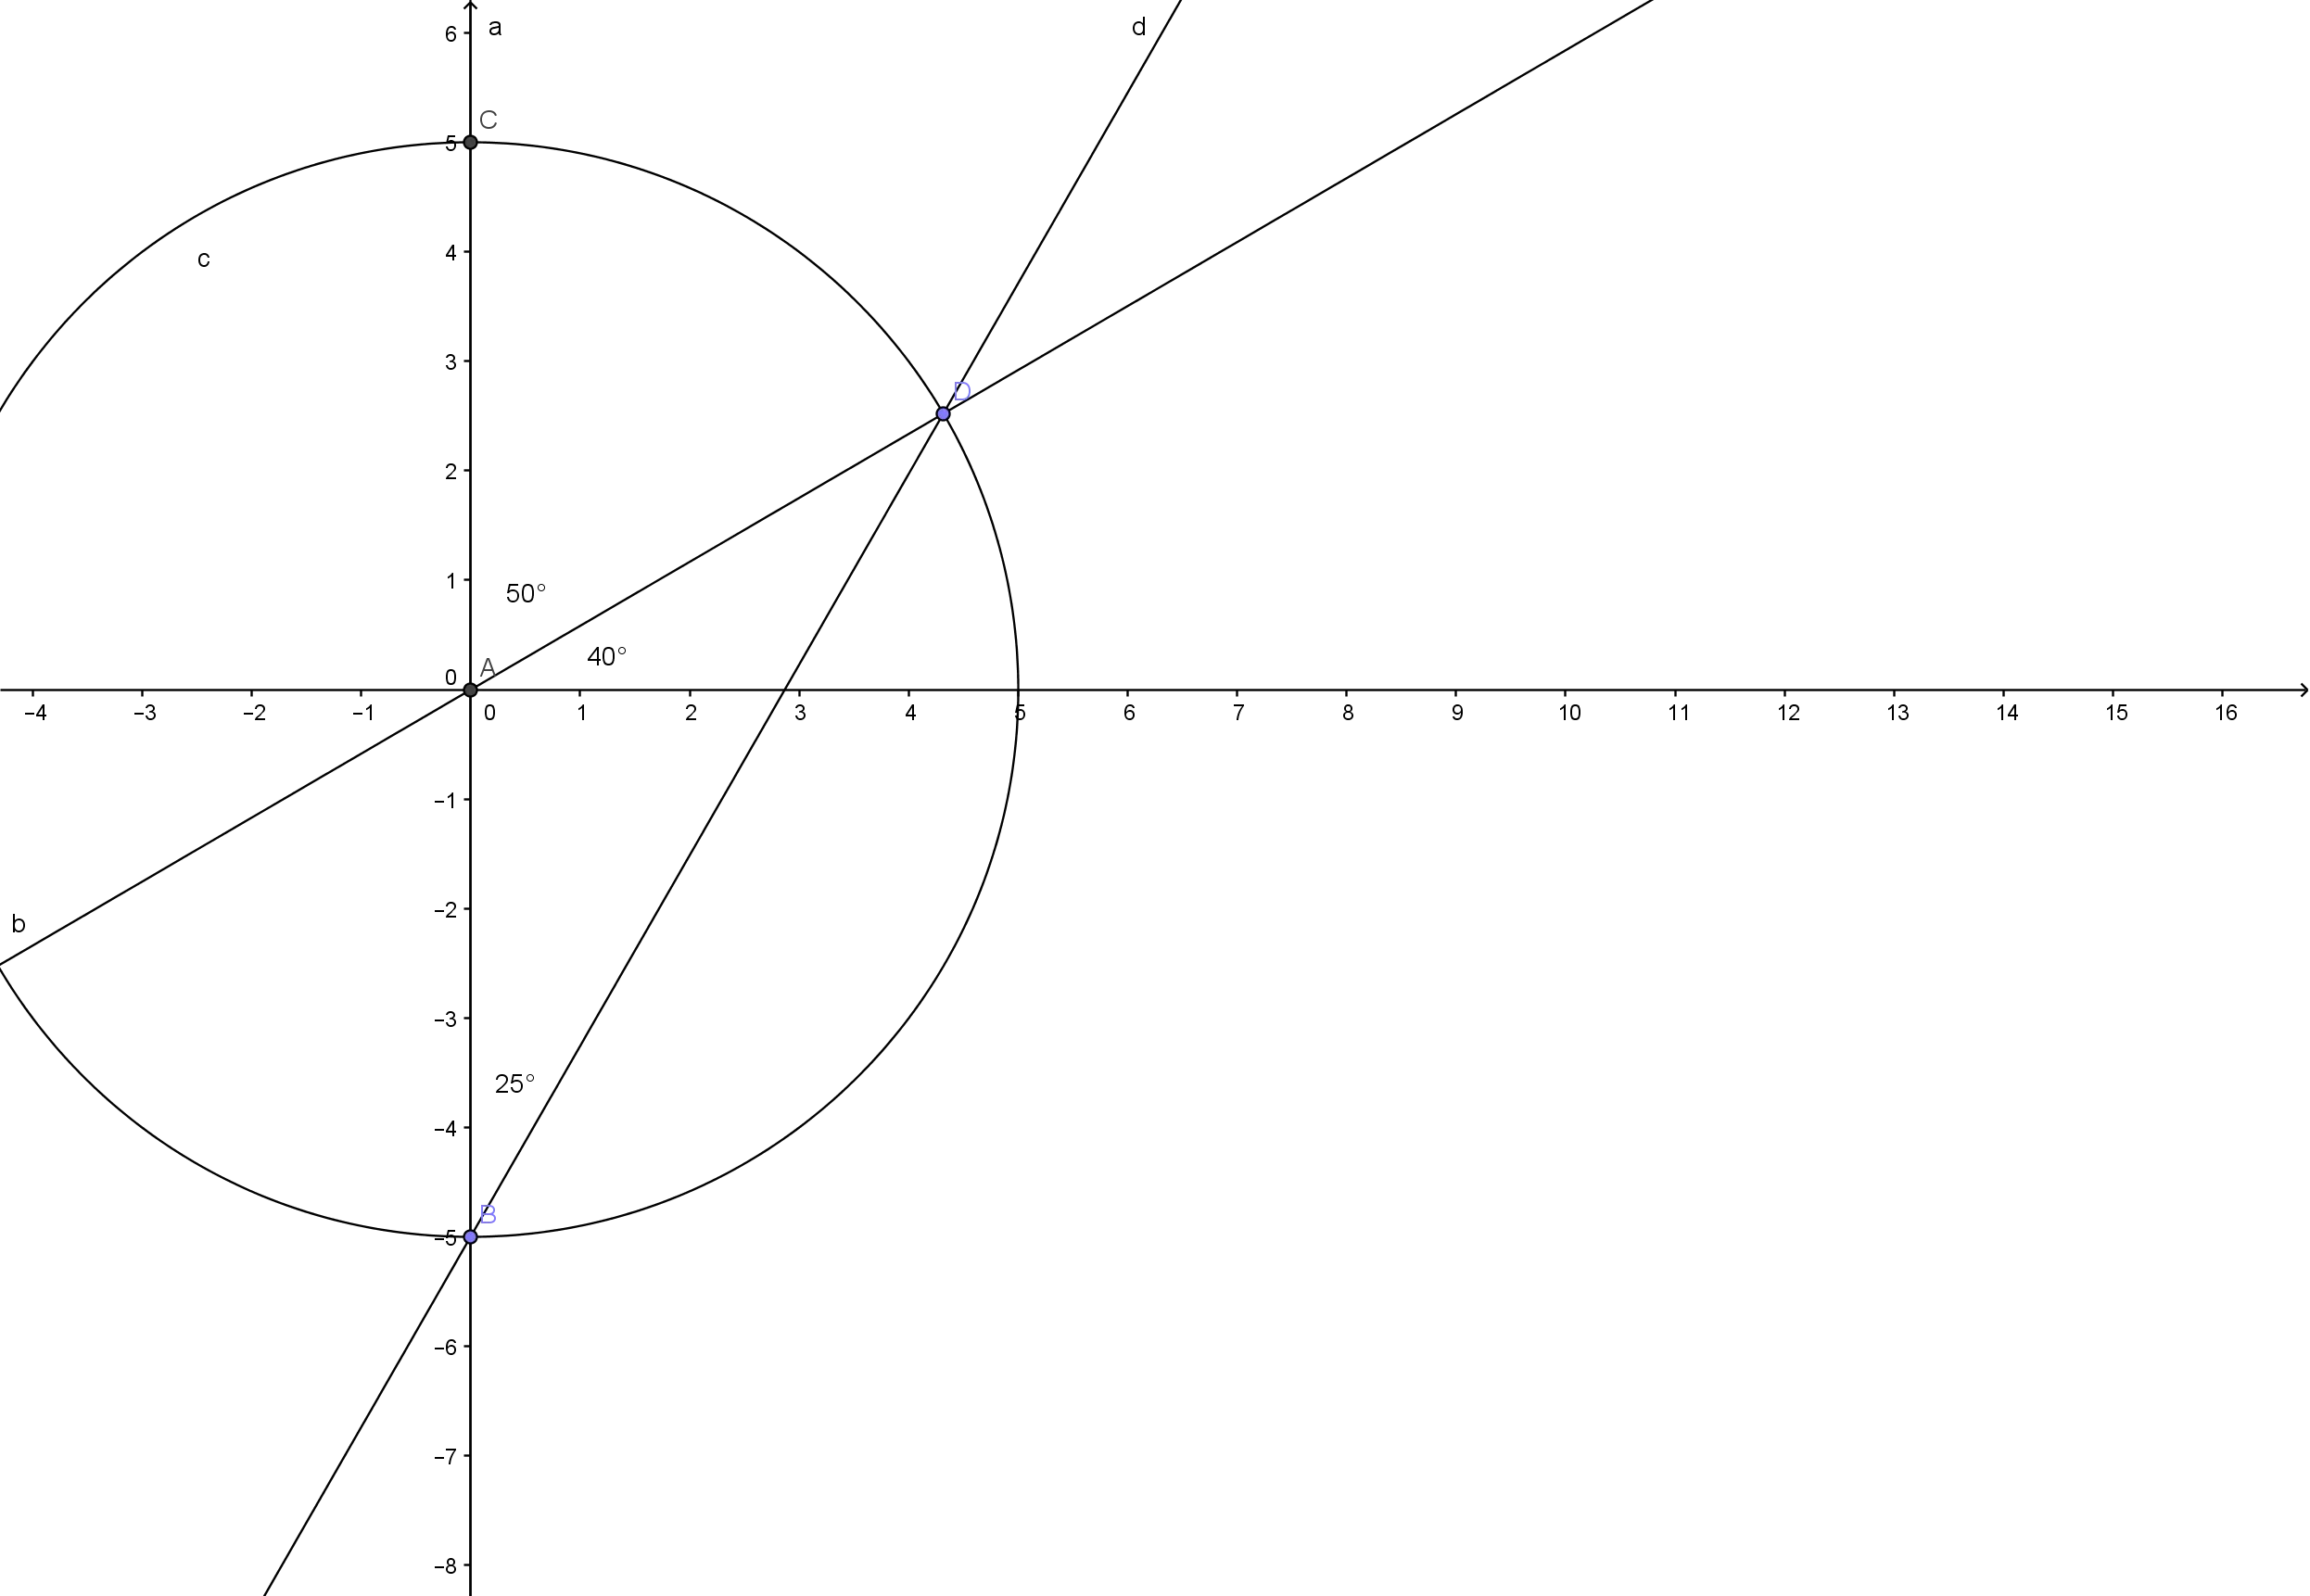
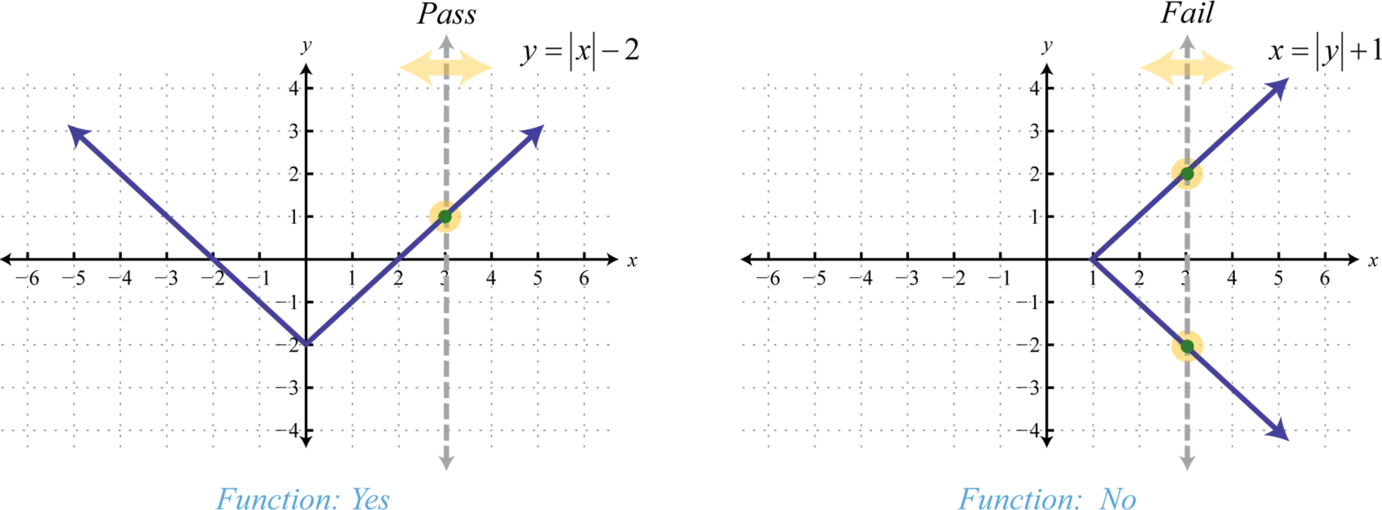
Mathematical Geometry and Graph Concepts -

Circular Thought Bubble Icon -
Geometric 3D Shape in Bold Colors -

Circus Lion Cartoon -

Vertical Double-ended Arrow -
Red Geometric Triangle Outline -

3D Coordinate System Illustration -
Black and Teal Circles Minimalistic Pattern -
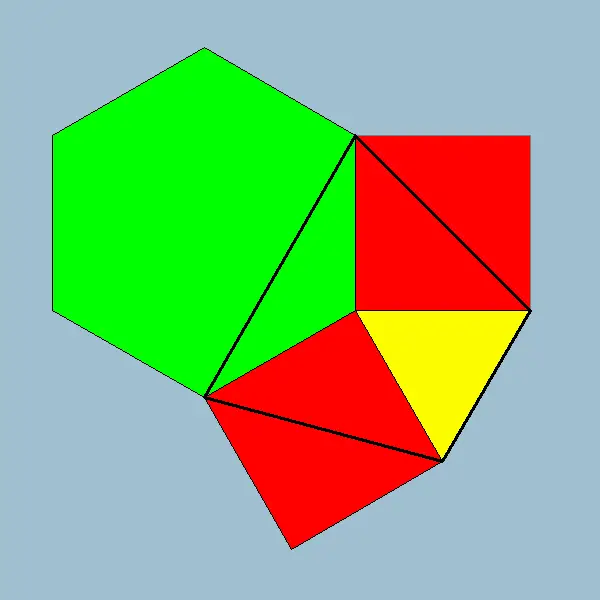
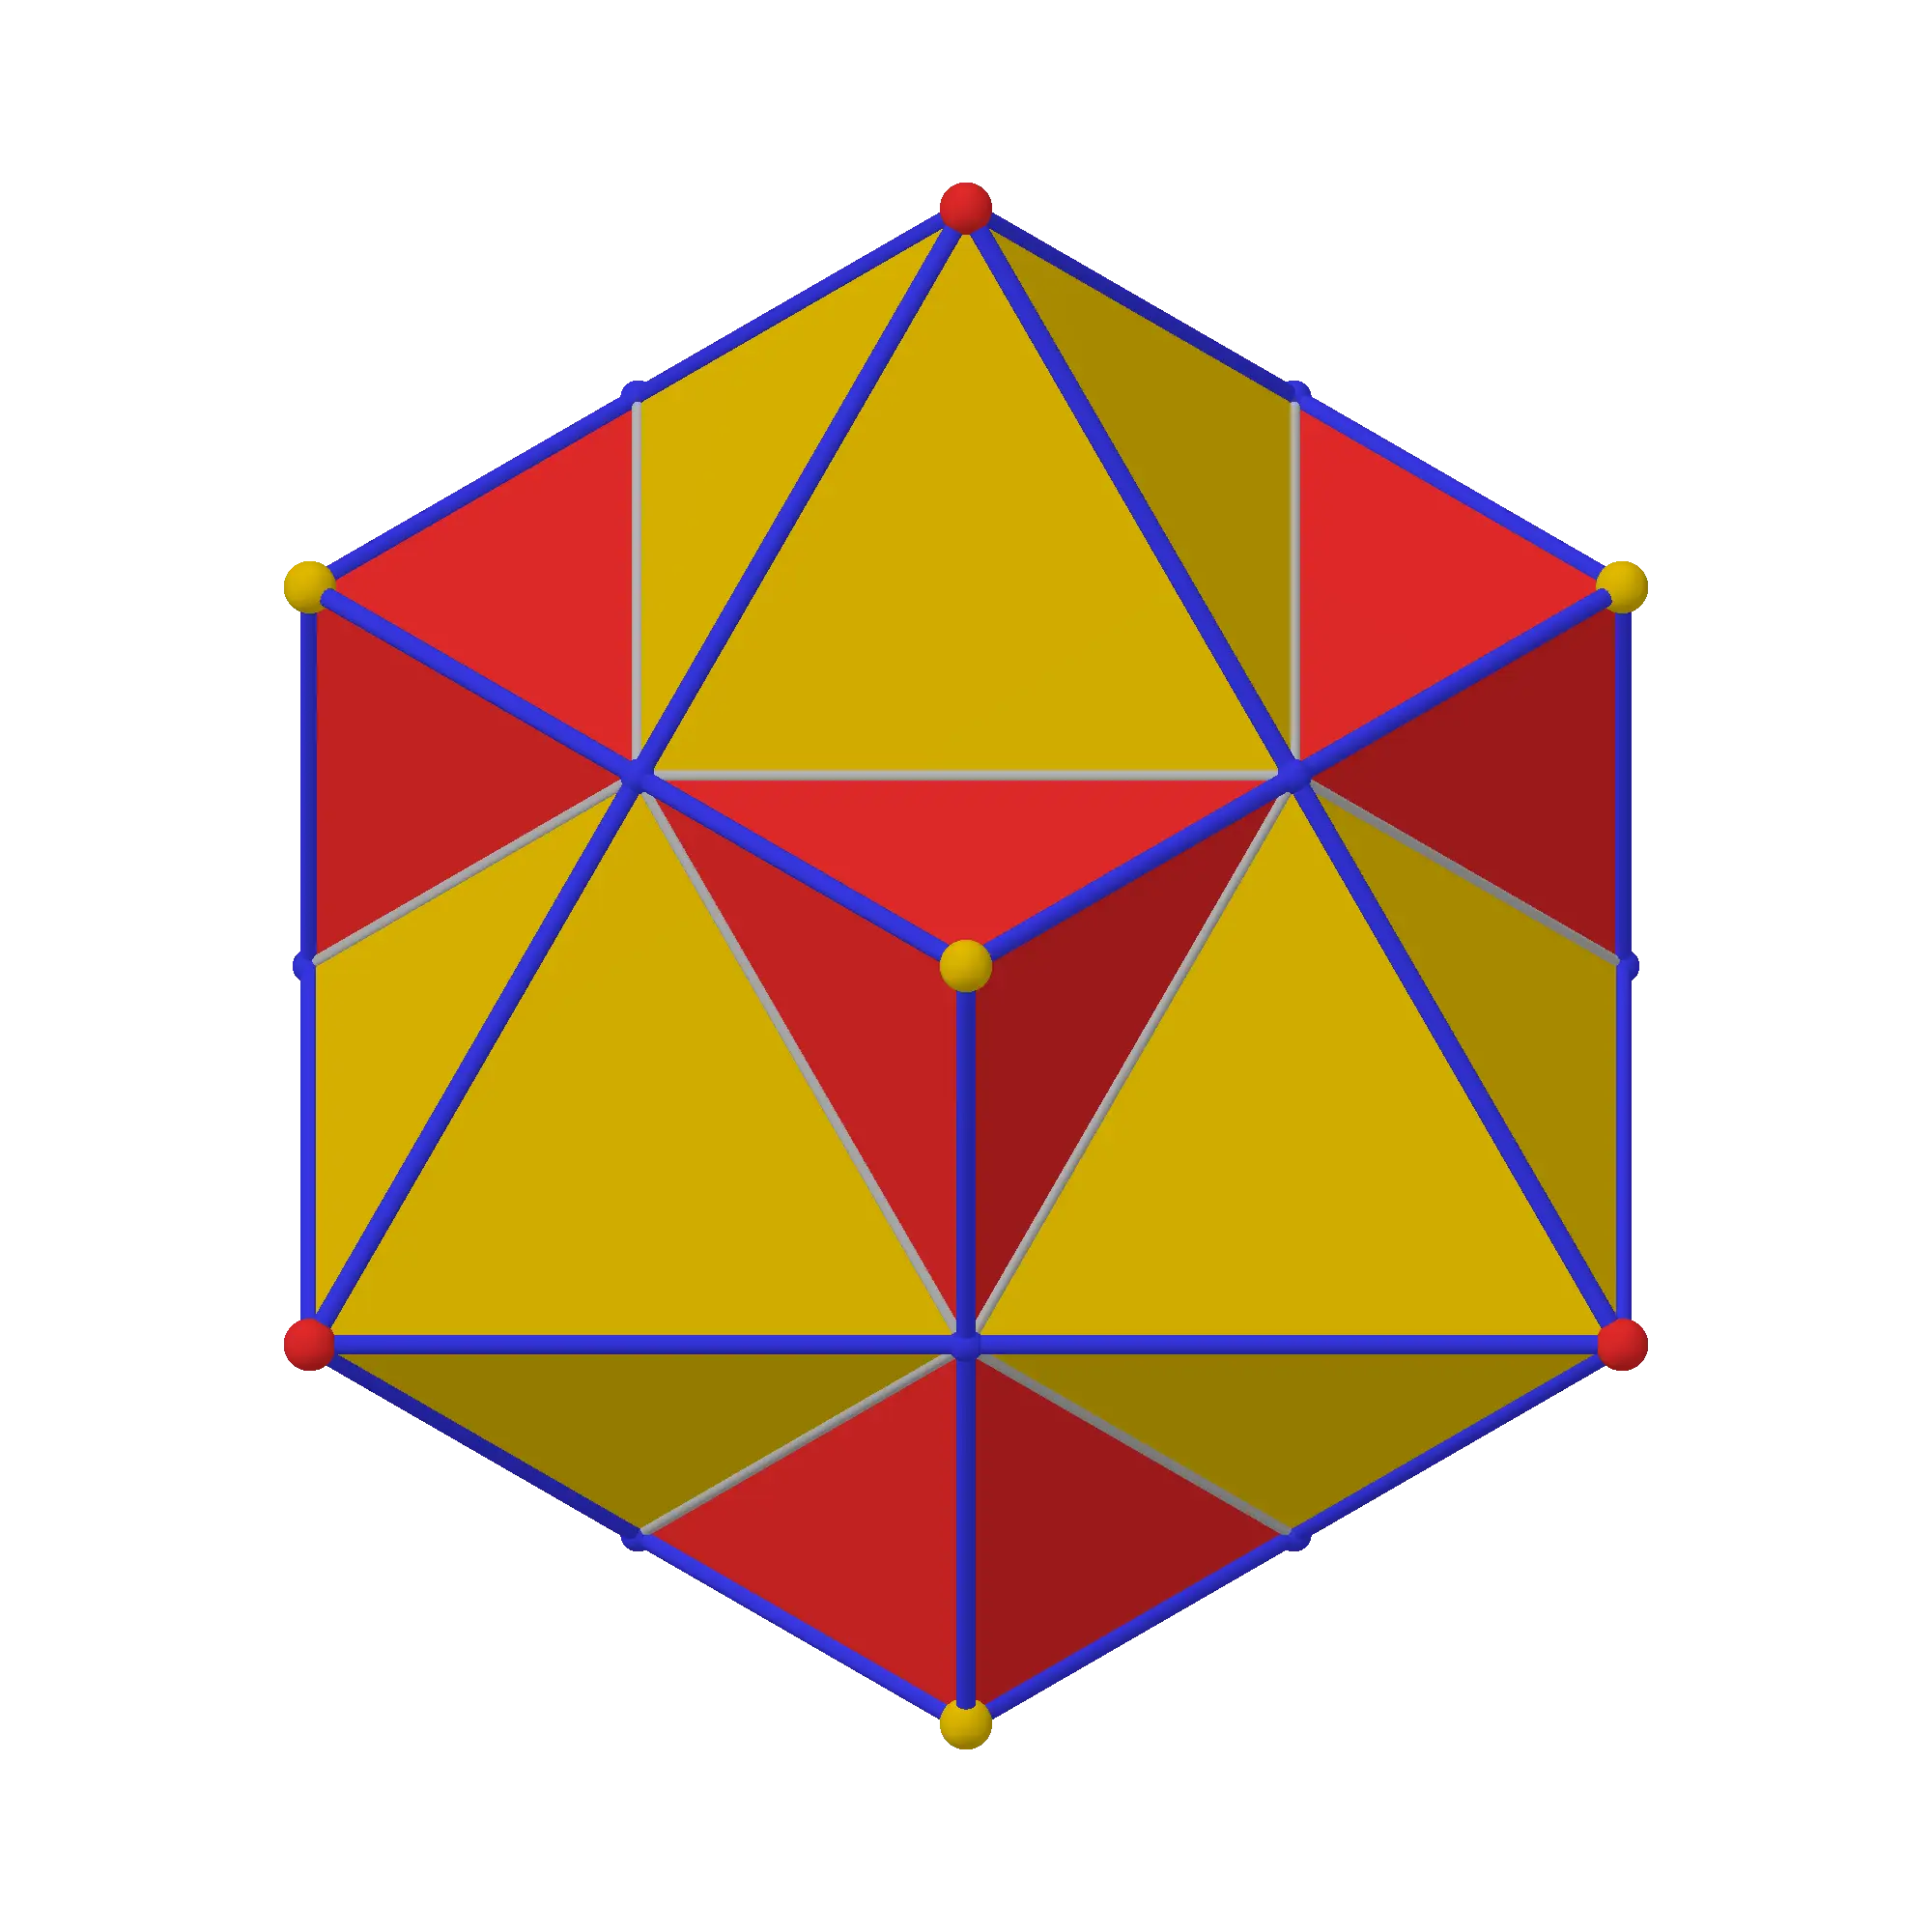
Abstract Colorful Polygon Geometric Design -
Simple Geometric Shape Outline -
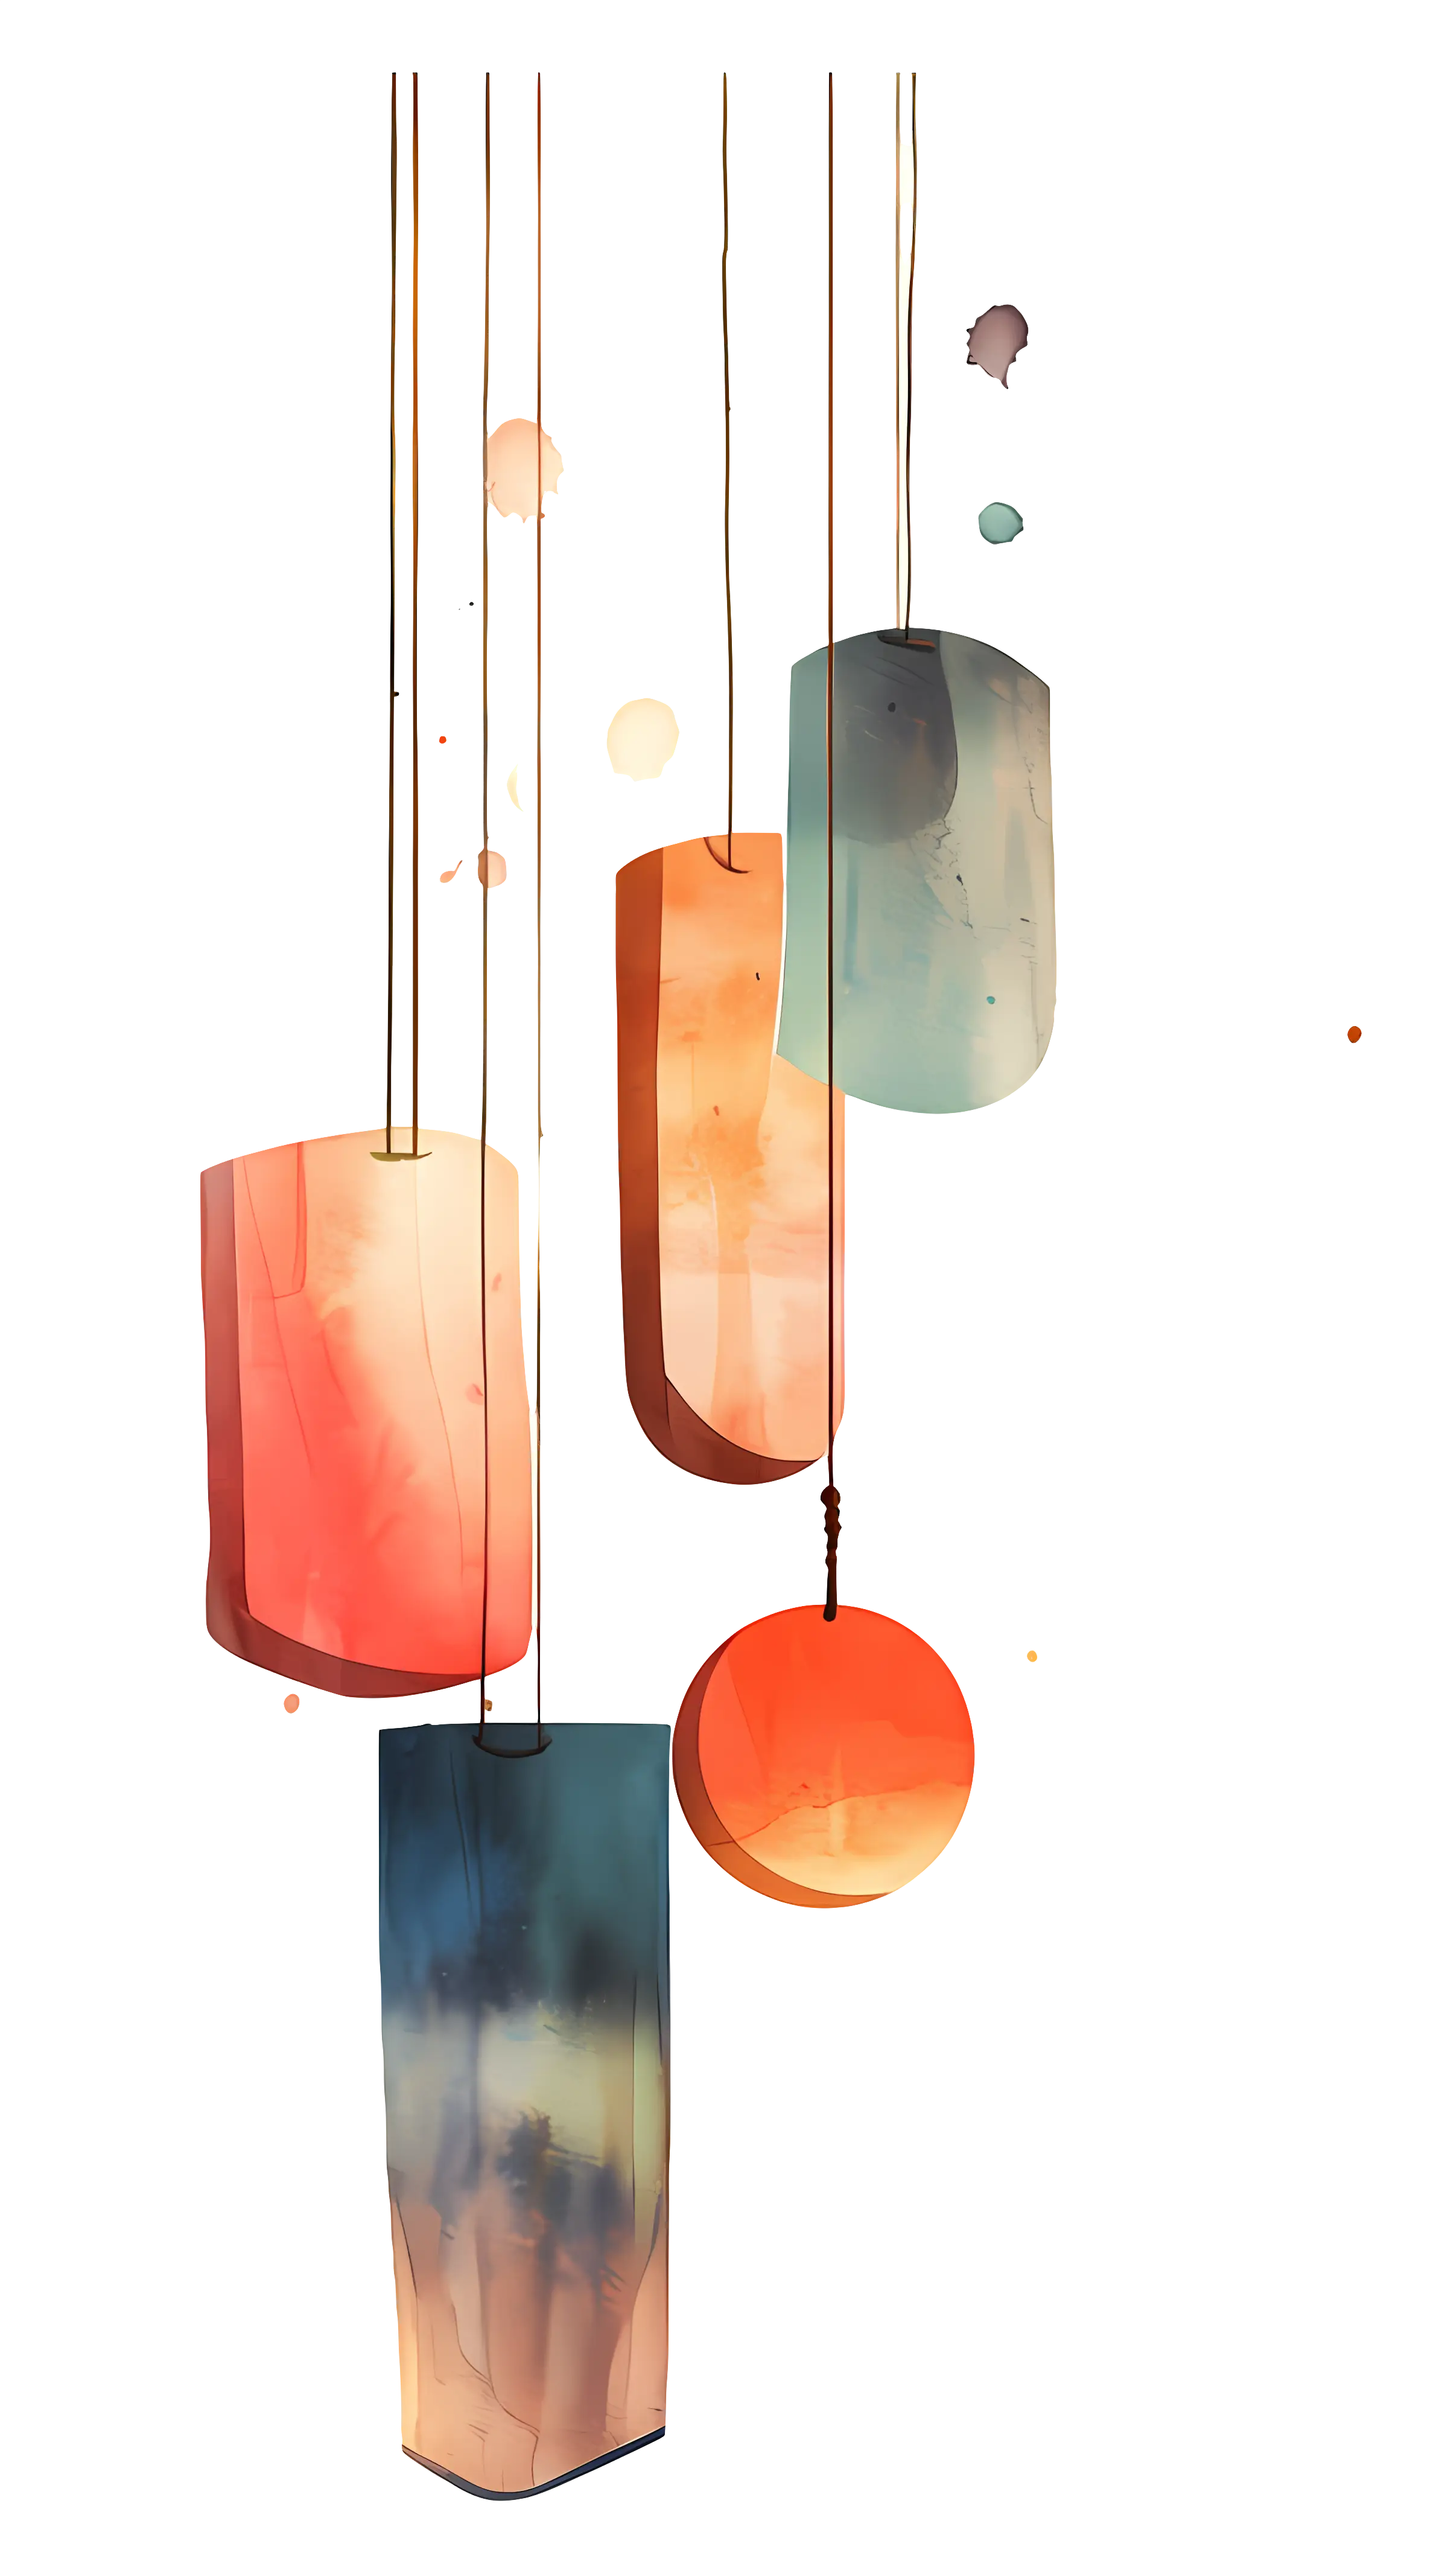
Colorful Hanging Lanterns -

Polygon Shapes in Abstract Black Design -
Monochrome Abstract Art -
Red and White Umbrella Symbol Design -
Black and White Impossible Triangle -
Black and White Rubik's Cube Illustration -
Colorful Spinning Top Toy -

Abstract Colorful Face in Modern Art Style -

People Relaxing in Nature Illustration -

Bold Black Equals Symbol -

Minimalist Black House Icon -

Colorful Abstract Arrow Design -
Abstract Red and Yellow Butterfly -
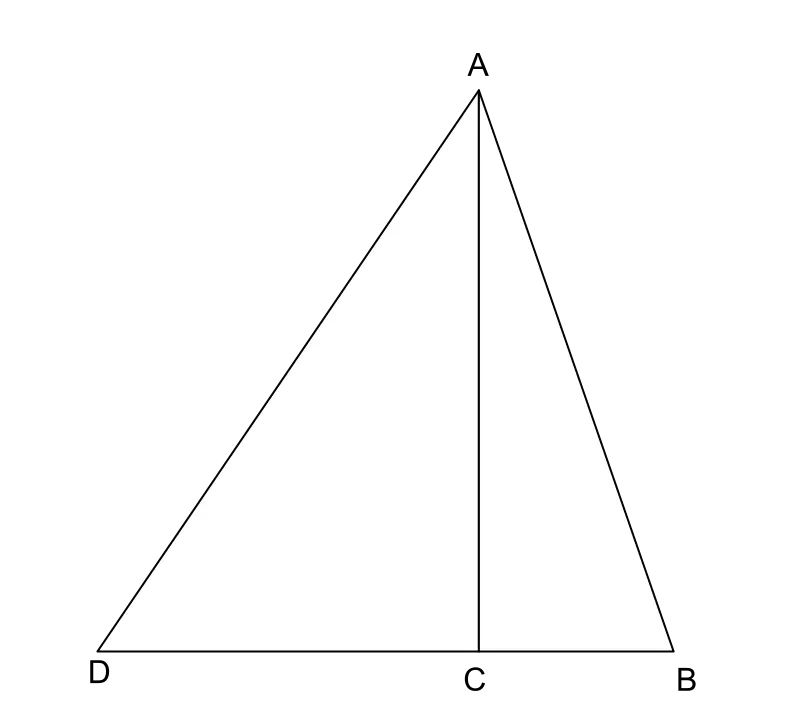
Triangle Diagram for Geometric Representation -
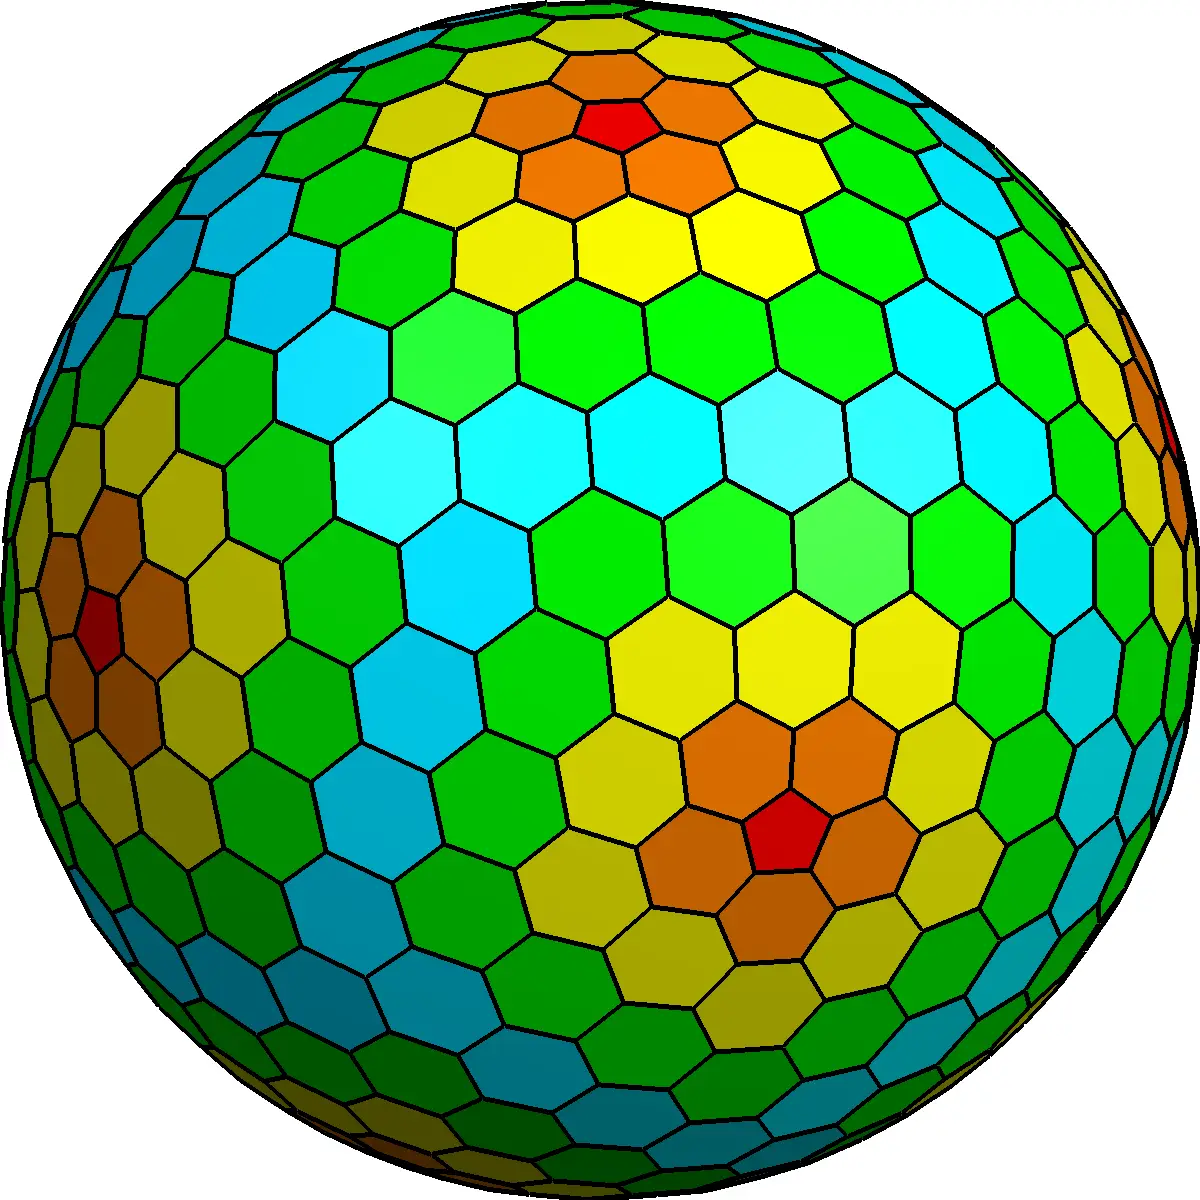
Colorful Hexagonal Sphere -

Diamond-Shaped Outline Icon