You Might Like
-

Curved Right Arrow -

Colorful Abacus for Learning and Counting -
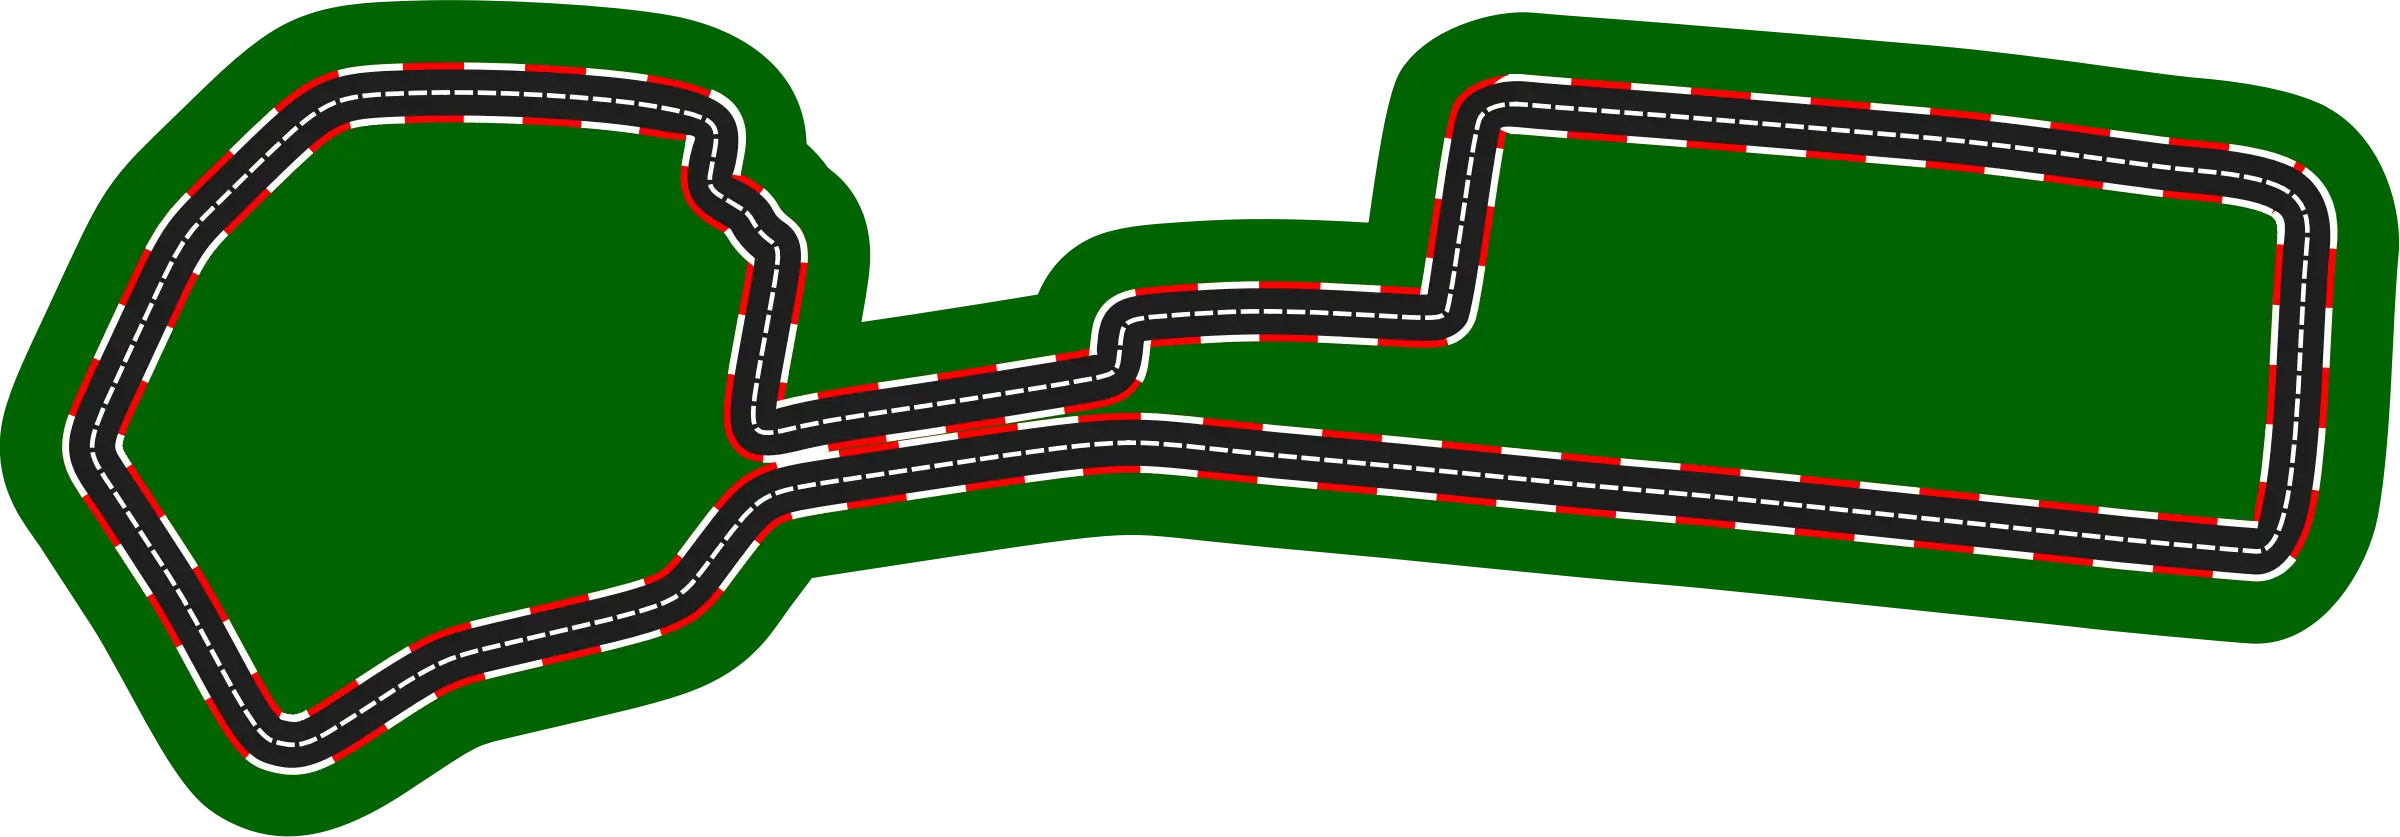
Race Track Circuit -

Red Abstract Logo with Modern Pattern -

Zigzag Down Arrow Icon for Decline Representation -

Red Boomerang Toy -

Purple Curved Right Arrow -

Curved Black Stripe Design Element -

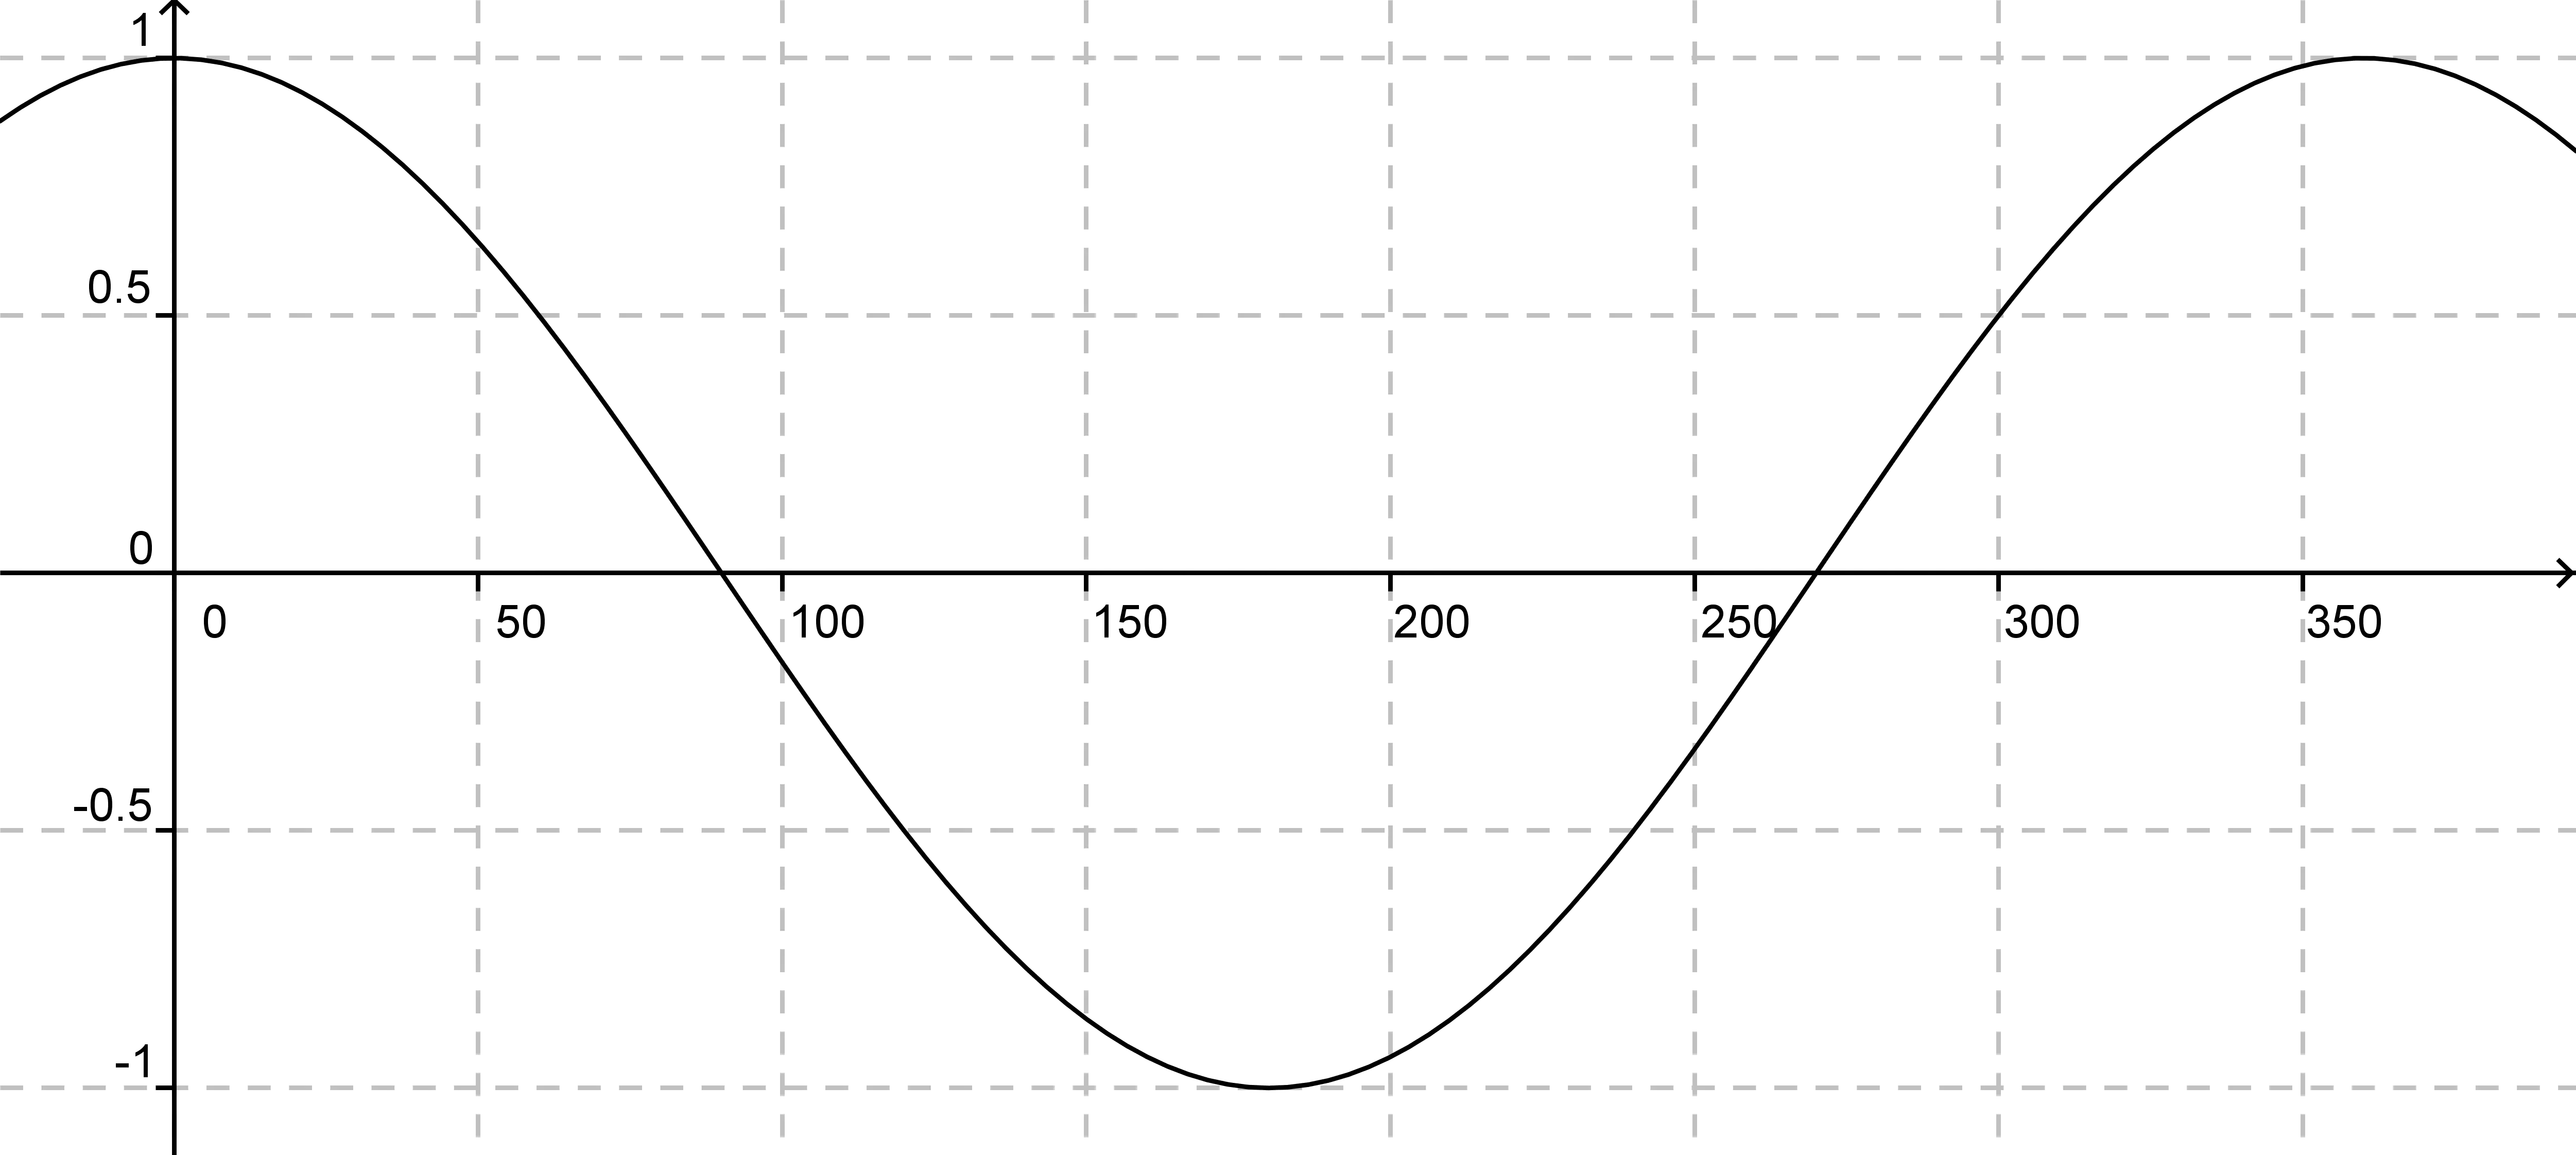
Graph Plot with Blue Curve Illustration -

Curved Arrow Down -

Red Curved Banner Design -

Curved Black Upward Arrow -

Blue Declining Bar Graph with Arrow -

Circle Pie Chart Icon -

Pink Arrow Pointing Downward Illustration -

Playful Cartoon Number 5 Illustration for Kids -

Minimalist Equal Symbol Icon -
Golden Crescent Moon -

Declining Chart Illustration -

Simple Black Wind Symbol -

Bold Black Equals Symbol -

Blue Triangular Abstract Logo -
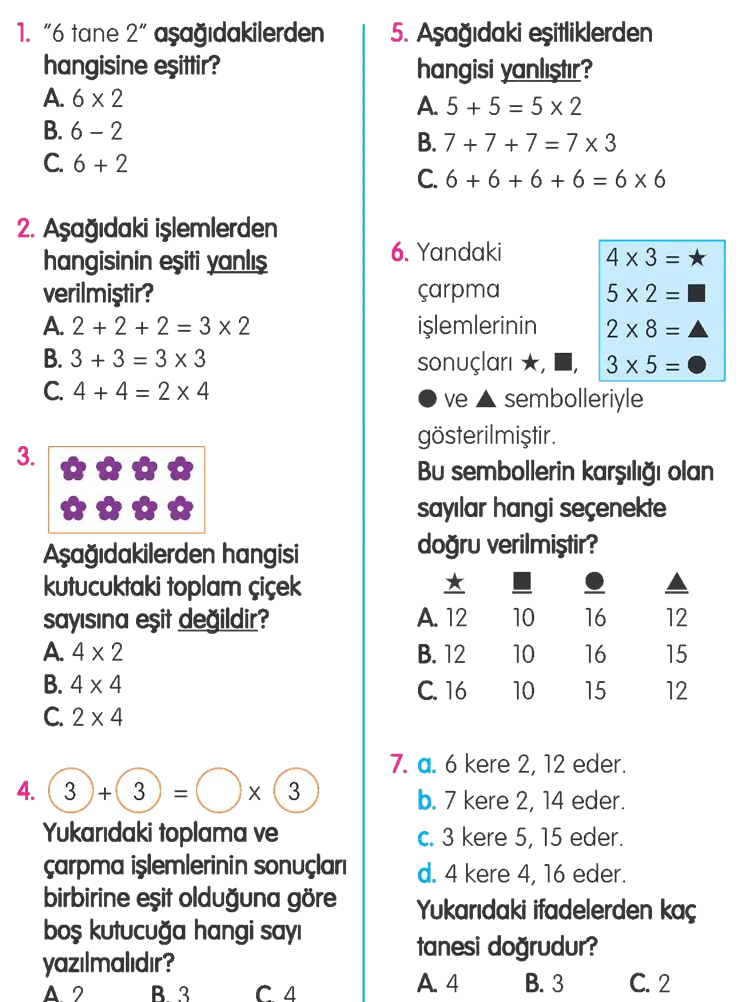
Math Worksheet with Questions -
Blue Electronic Calculator for Office and School -

Glittery Gold Spiral Decoration -

Black Ocean Wave Silhouette -
Colorful Spiral Line for Creative Design -

Magnifying Glass with Graph Illustration -

Purple Curved Decorative Swirl Art -
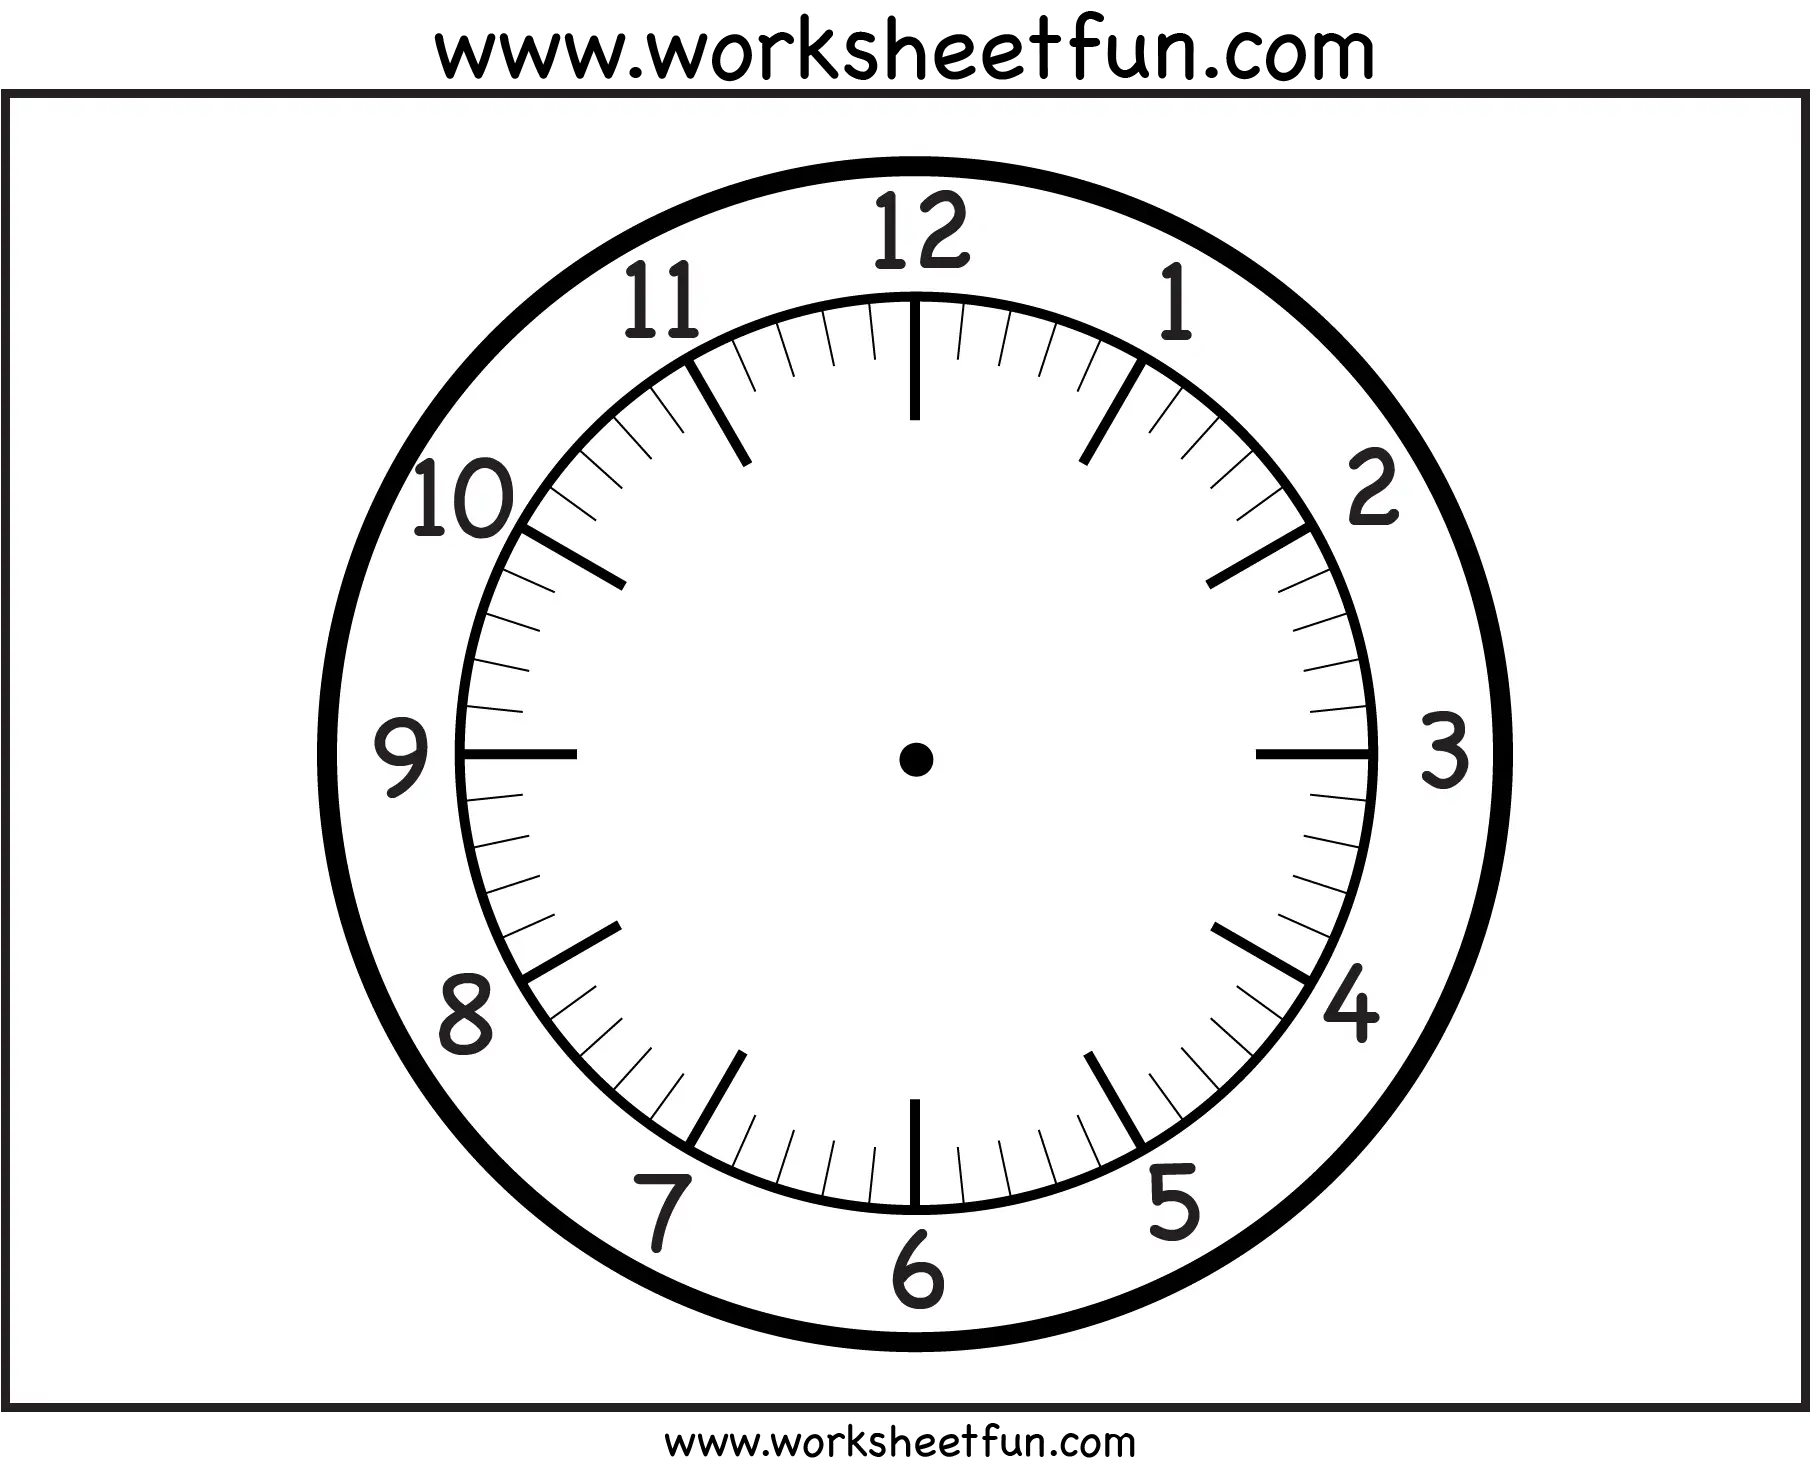
Blank Clock Face Worksheet