
You Might Like
-
Black Exercise Mat -
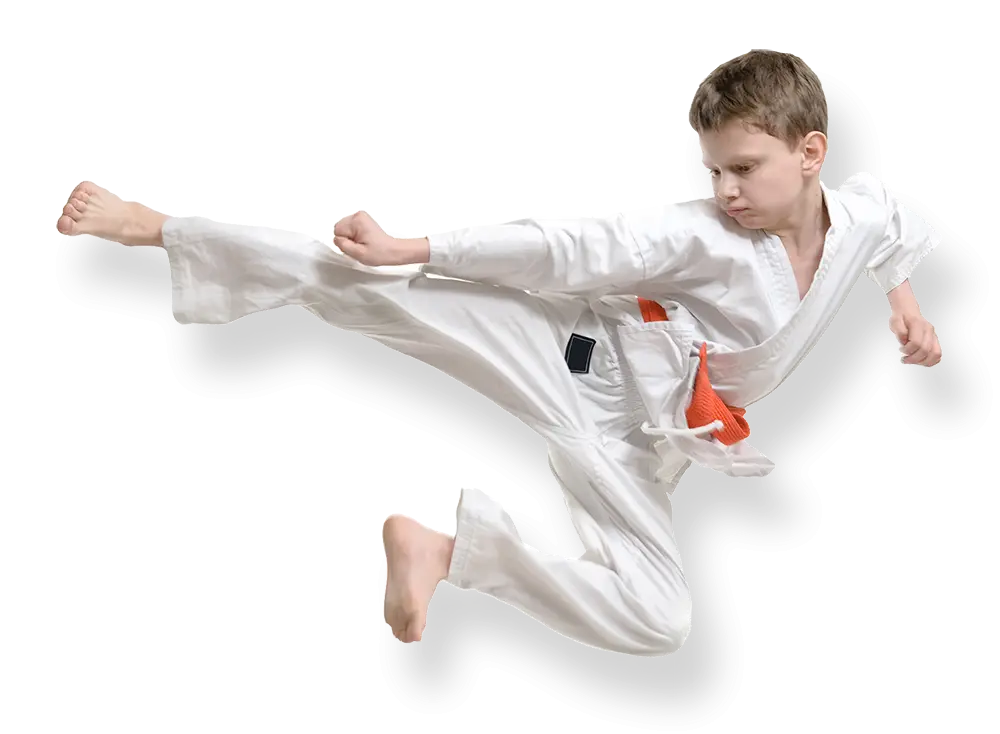
Karate Kid Performing a Kick -
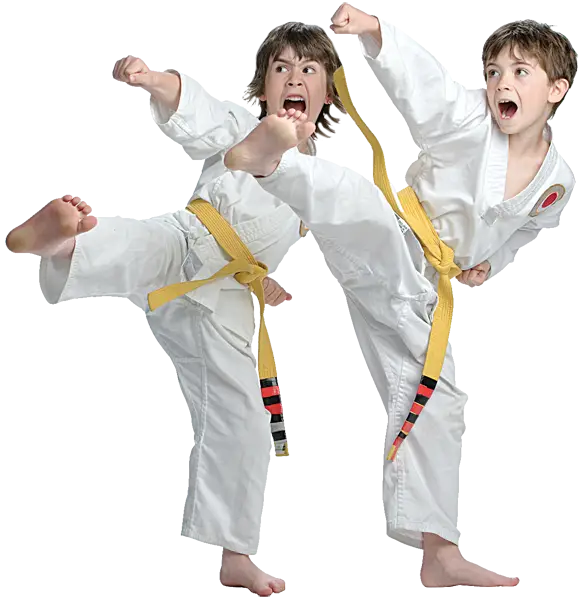
Karate Kids in Action -
Red Sports Shorts with Black Design -
Red Toy Car with Steering Wheel -
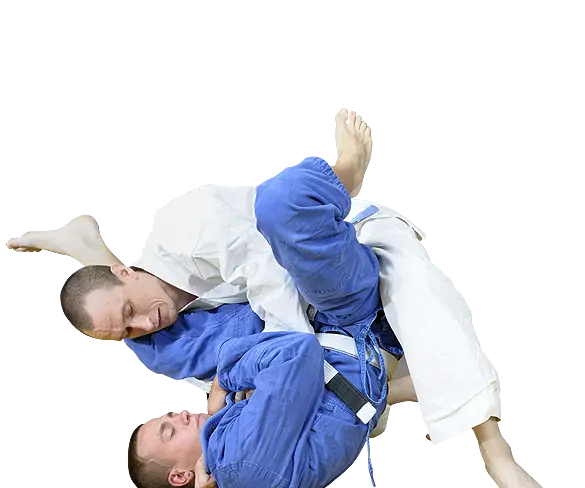
Judo Practice Training Session -
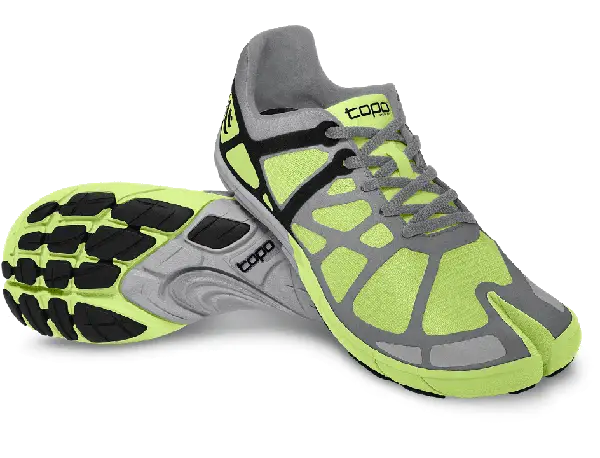
Lime Green and Gray Running Shoes for Athletes -

Dumbbell Icon in Circular Shape for Fitness -

Inter Academy Florida Logo -
Boxing Gym Logo -
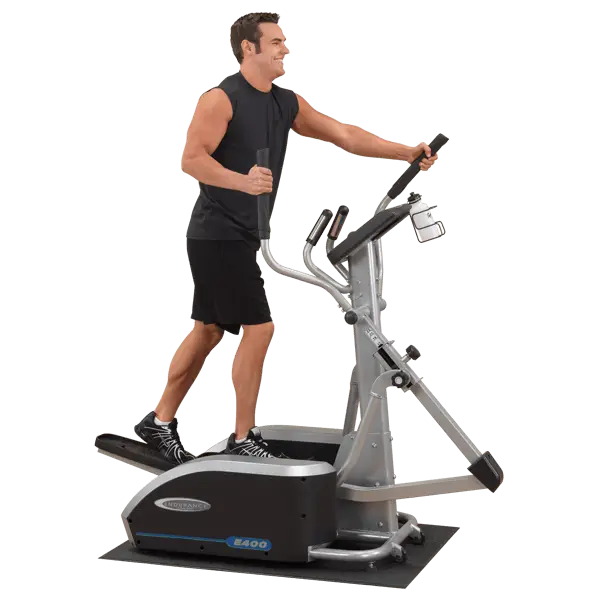
Man Using Elliptical Trainer for Exercise -
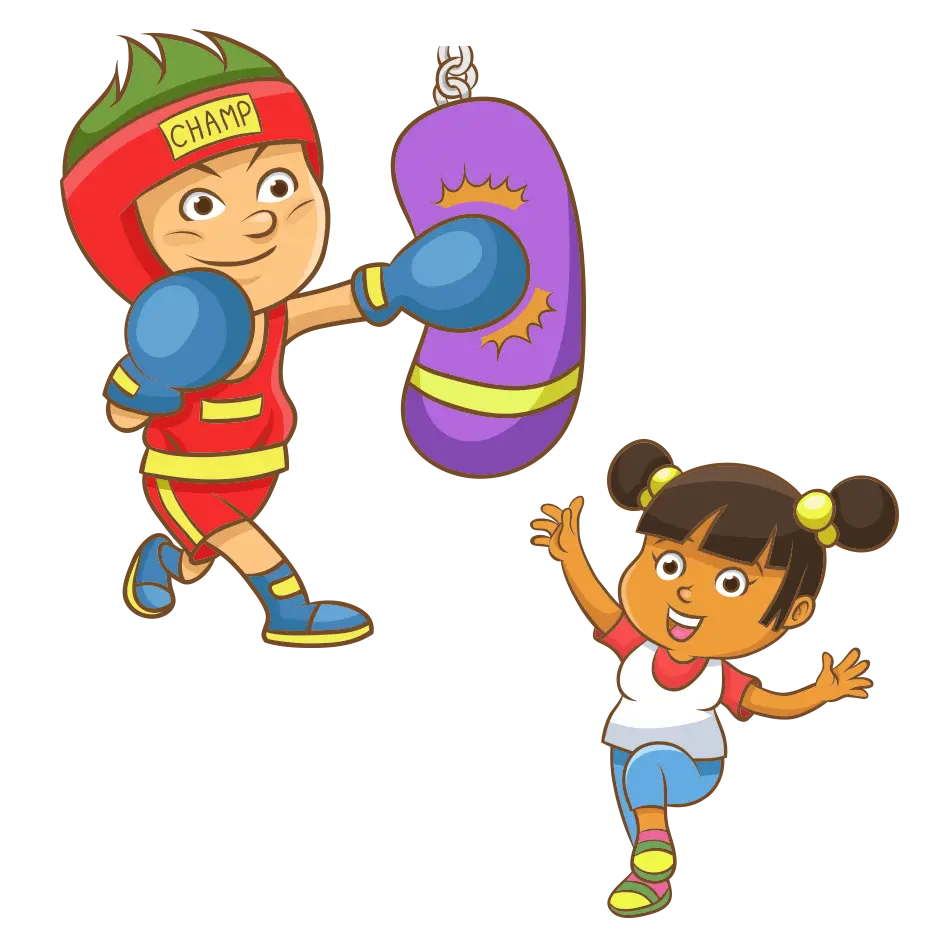
Boxing Kid and Happy Girl Cartoon -

Presenter with Board and Pointer -
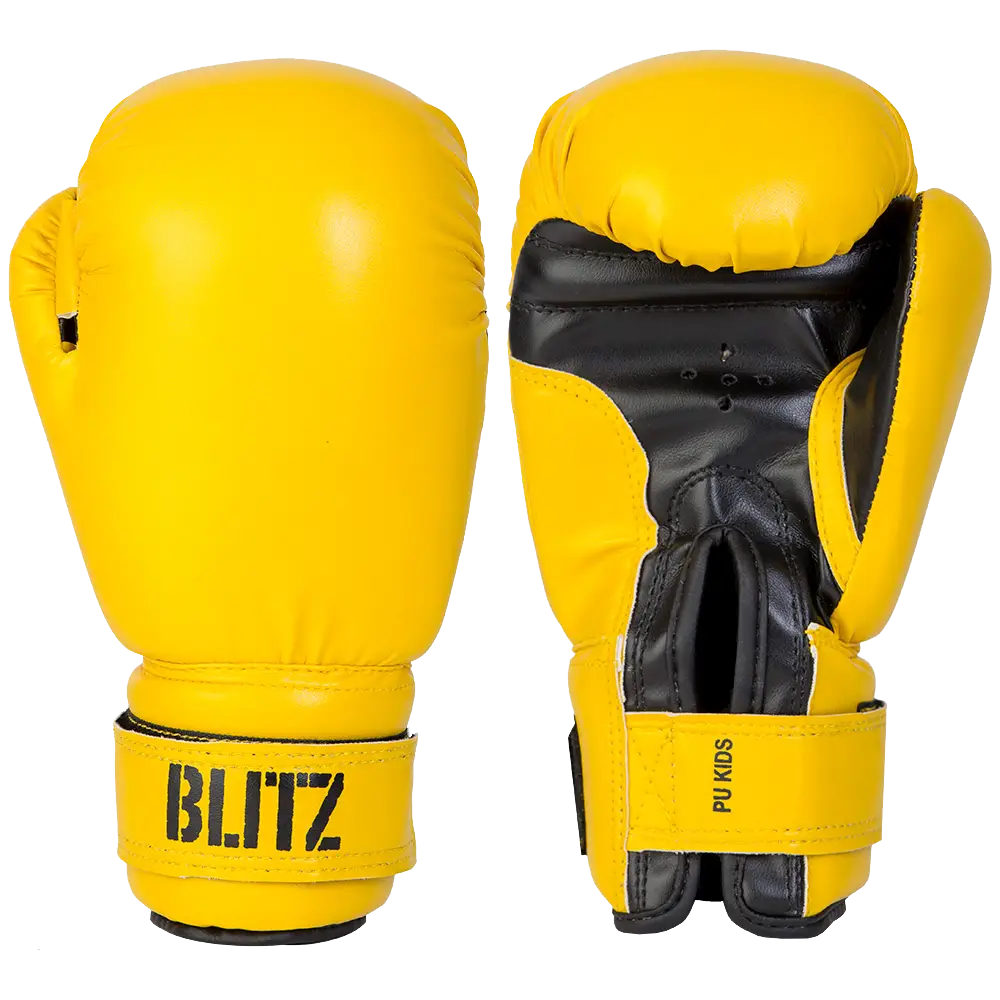
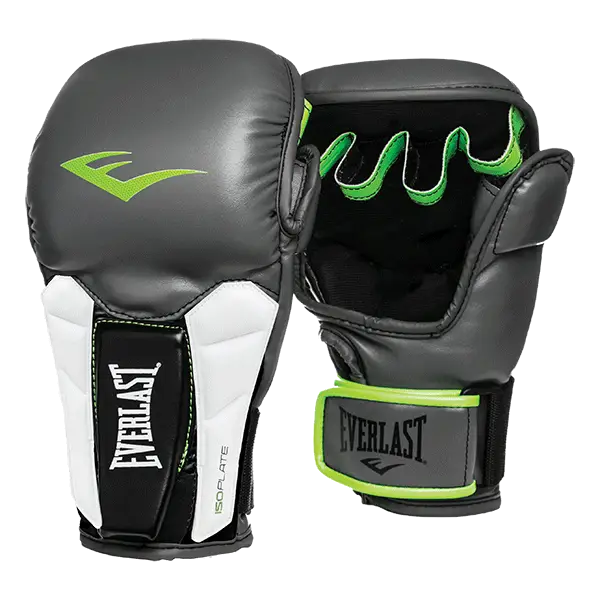
Yellow Boxing Gloves for Training -
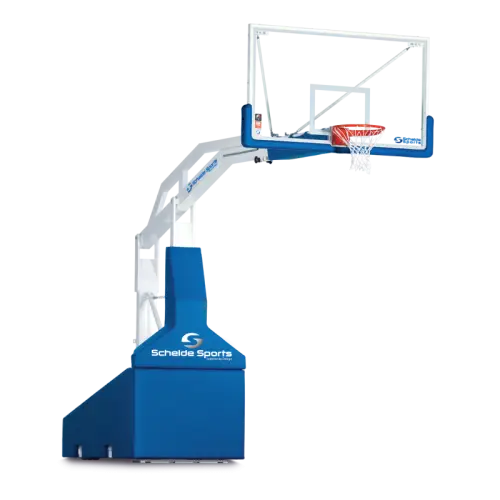
Blue and white basketball hoop system -
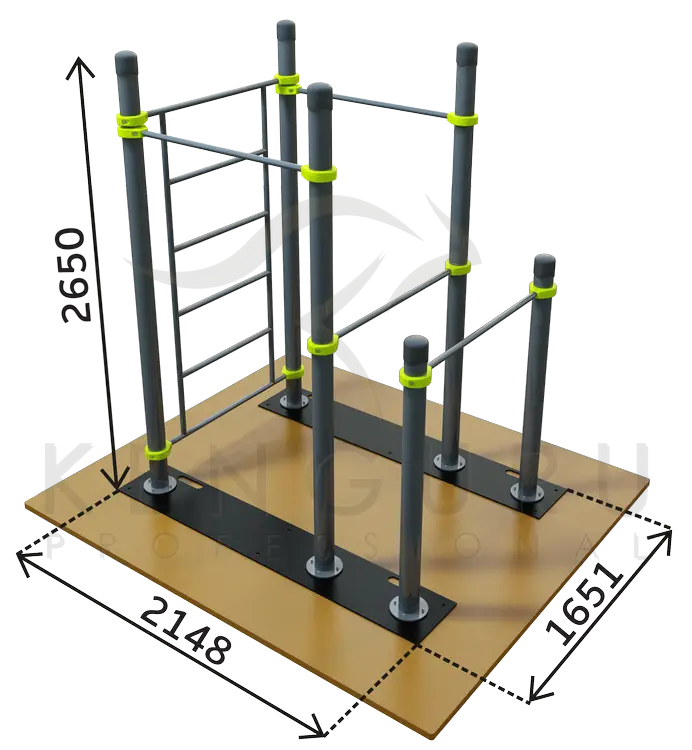
Exercise Equipment with Measurements -
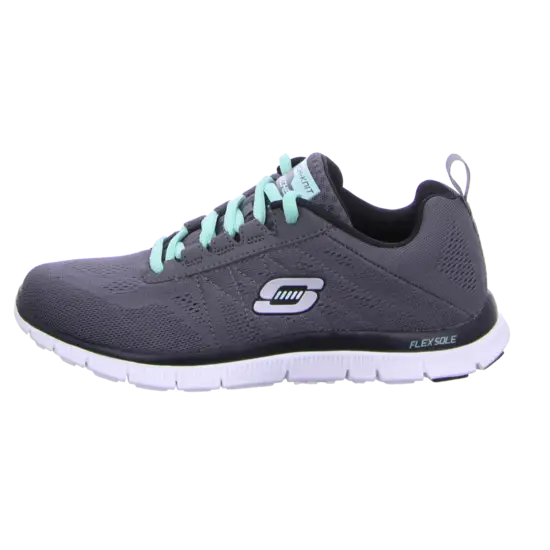
Gray and Aqua Running Sneakers -

Treadmill Icon for Fitness Concept -
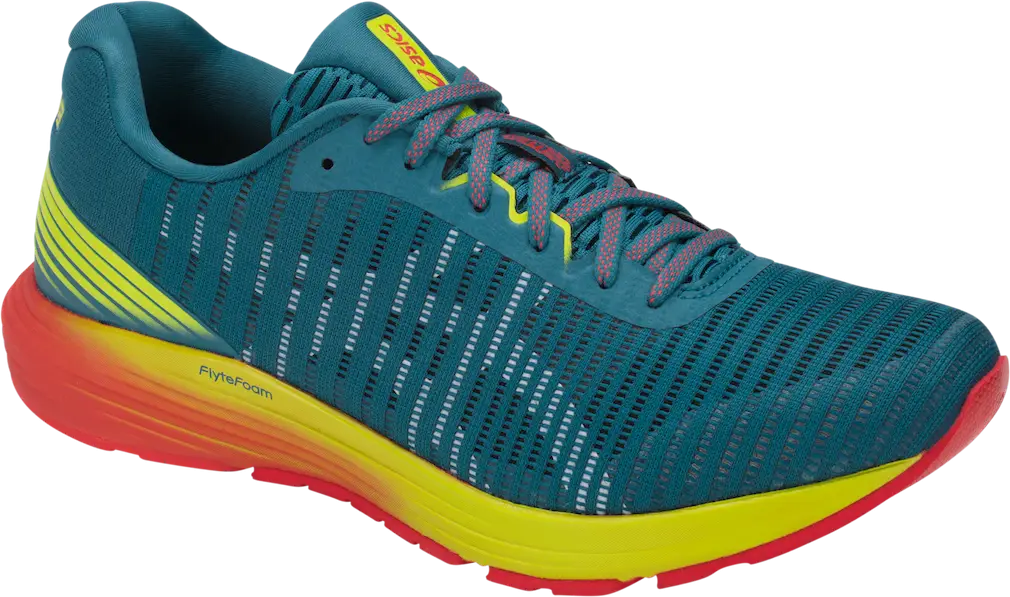
Colorful Running Shoe for an Active Lifestyle -
Pair of Boxing Gloves -

Mobile Data Analysis Graph -
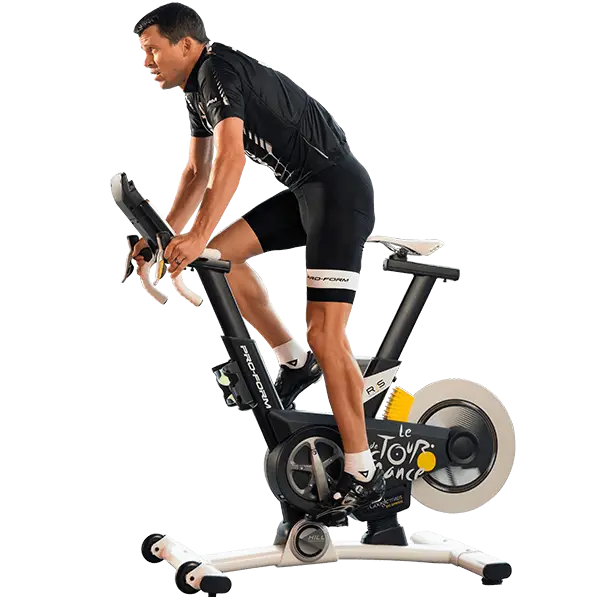
Man Performing Indoor Cycling Workout -
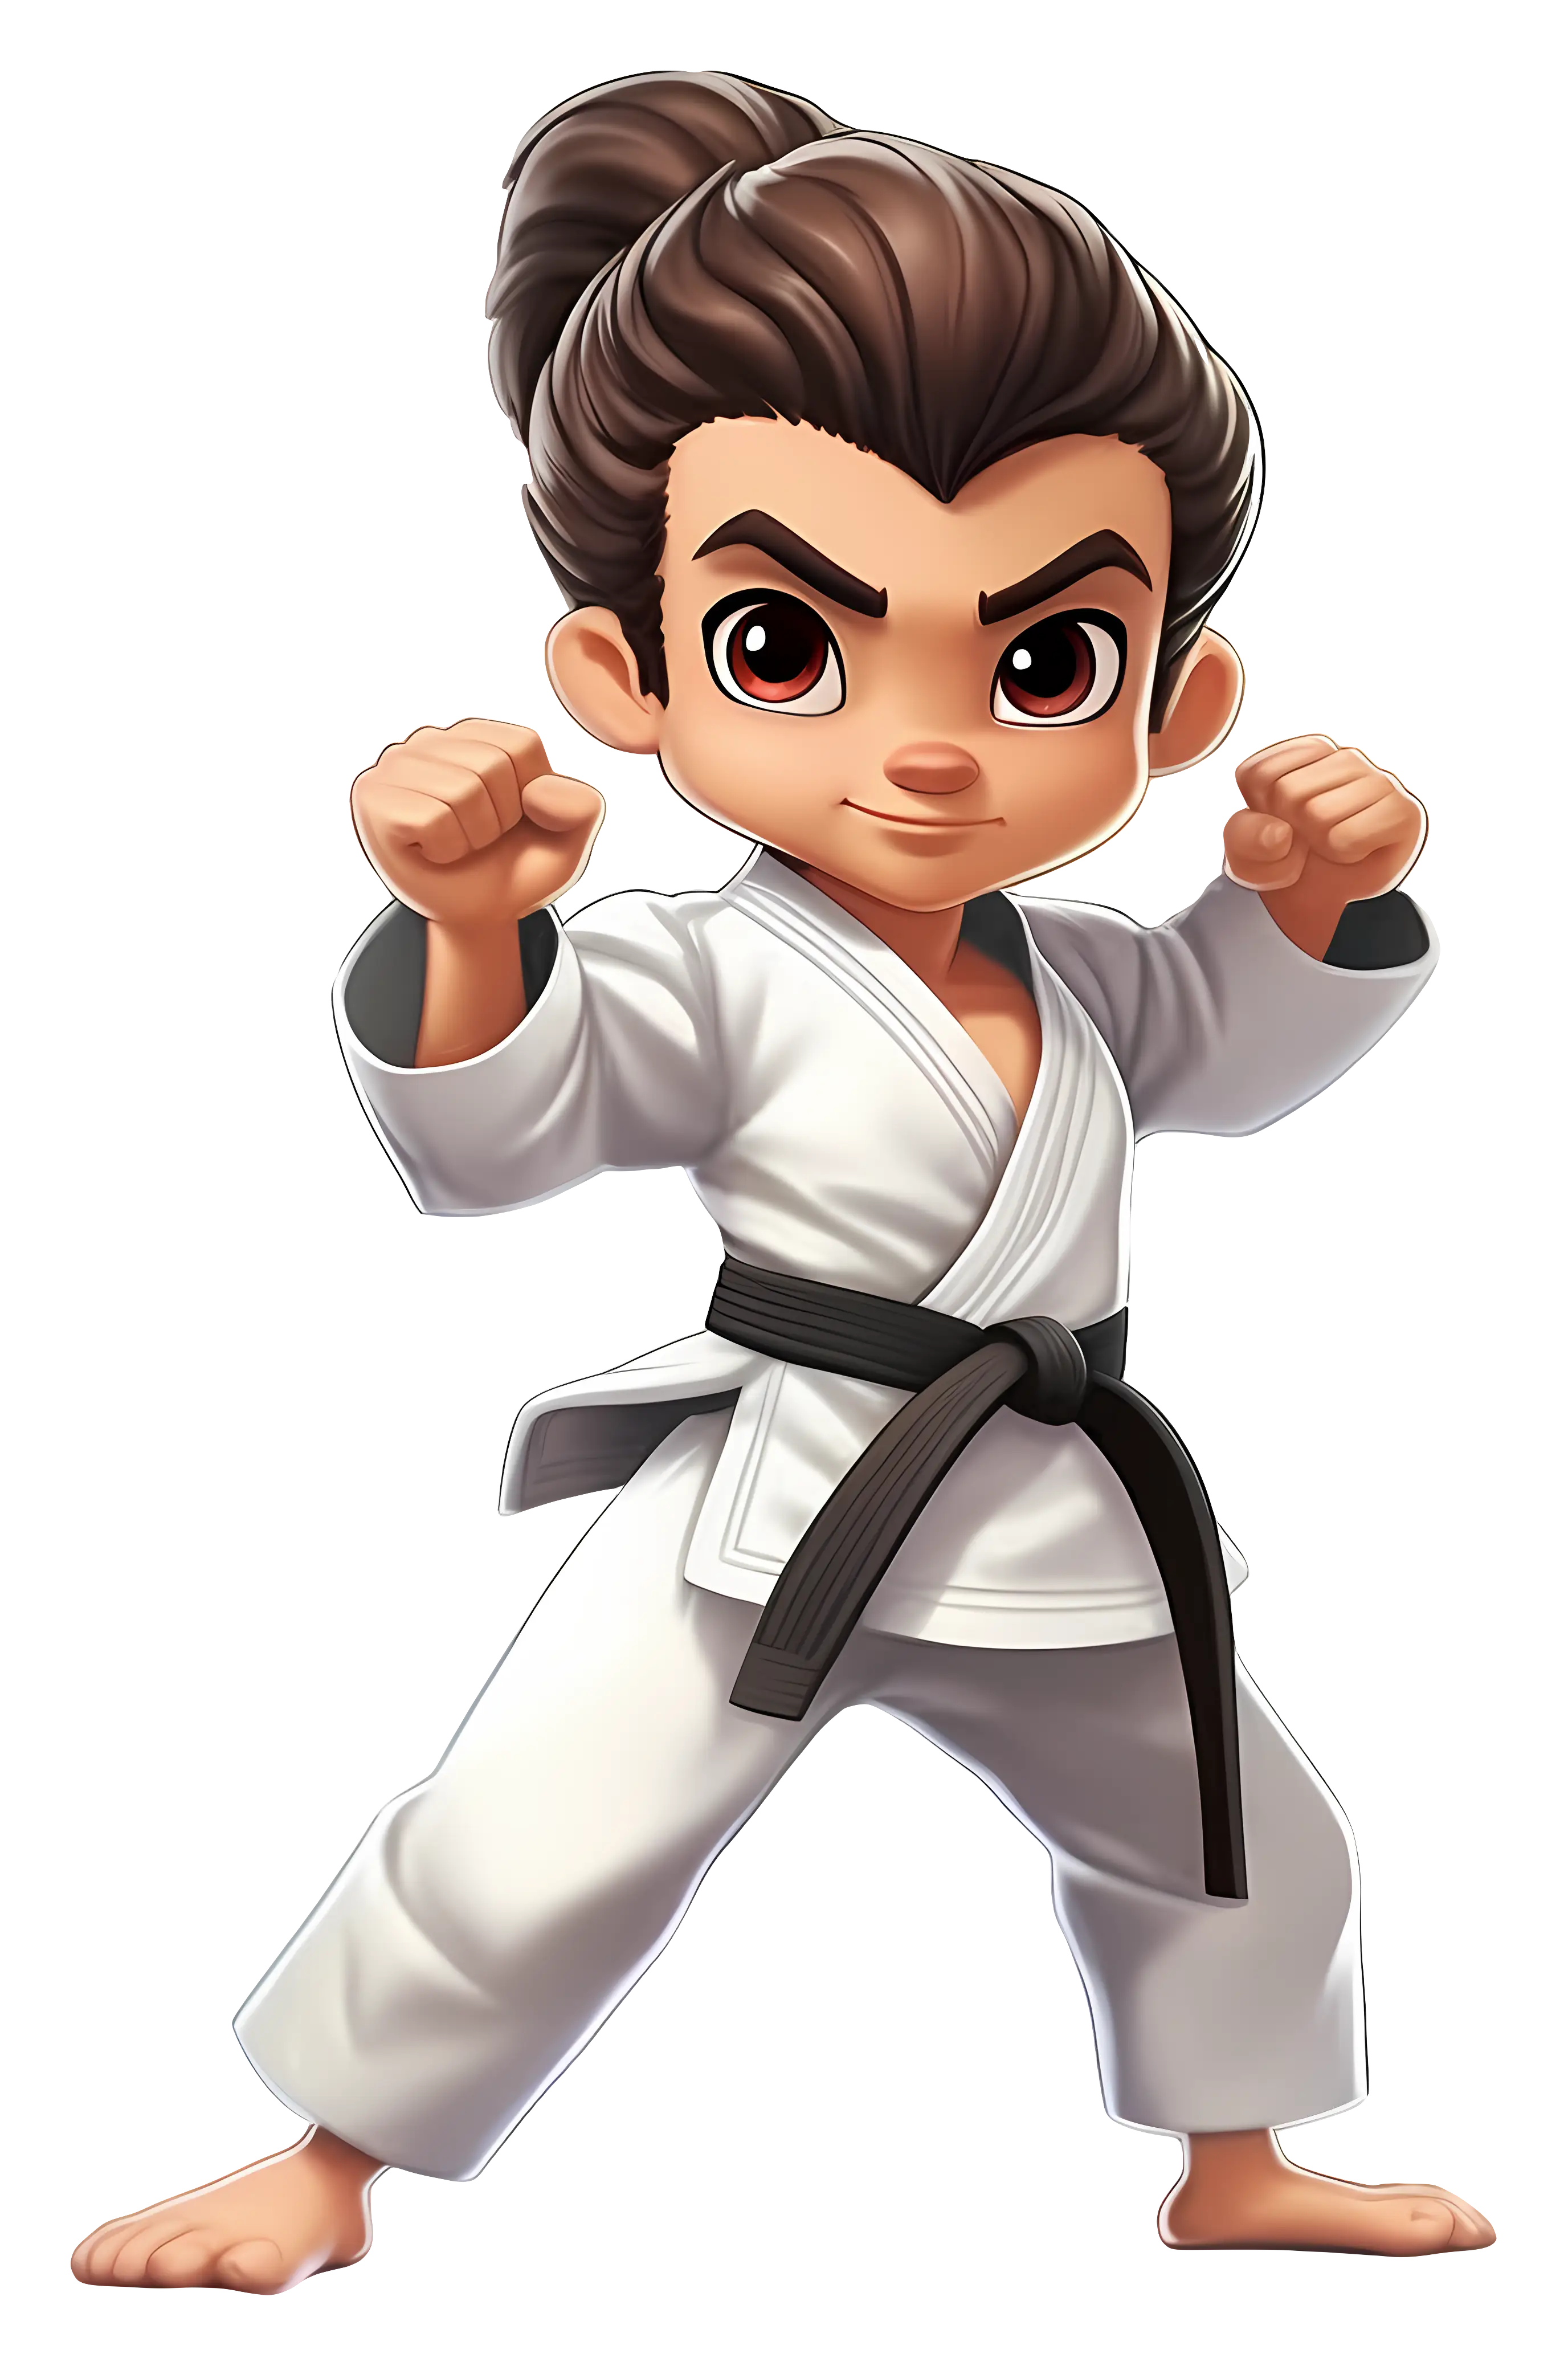
Cartoon Martial Arts Boy in Karate Gi -

Woman Kicking Punching Bag -
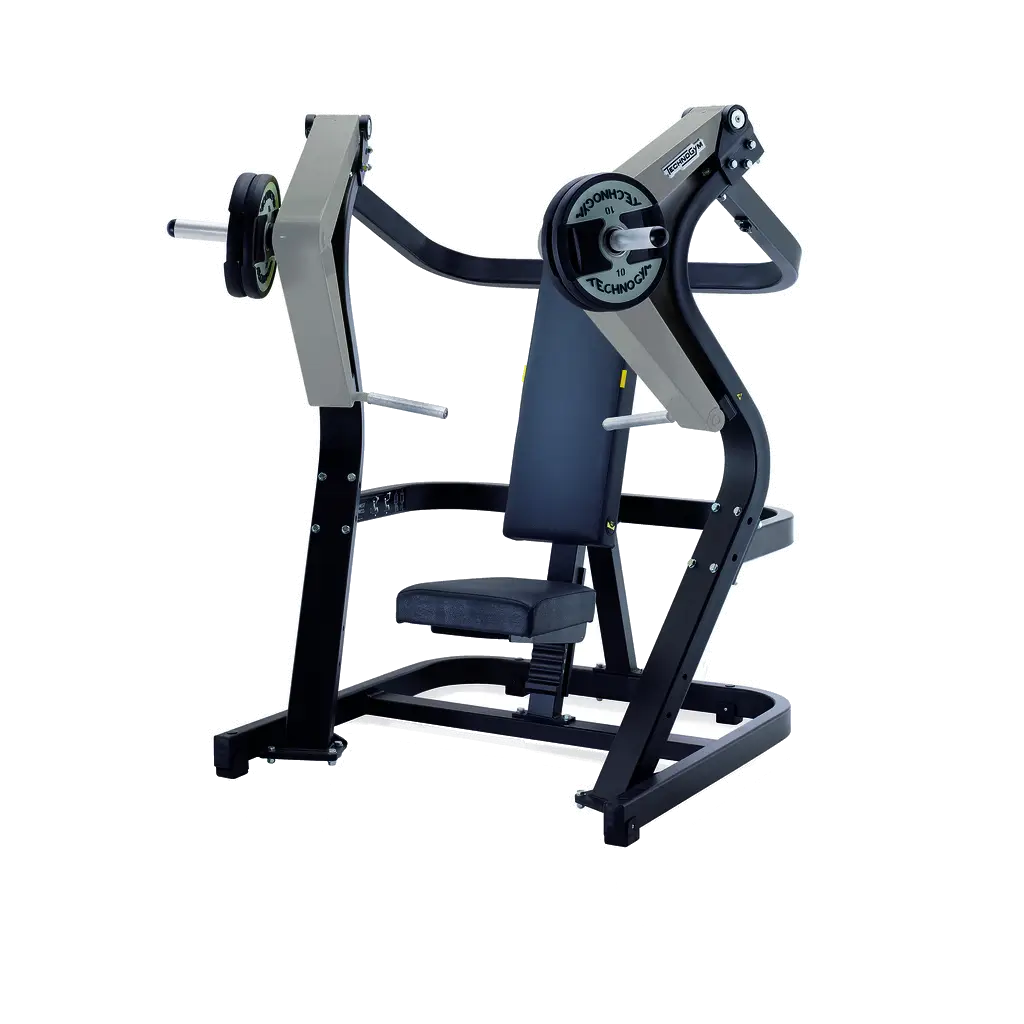
Modern Gym Machine for Strength Training -

Arabic Text Logo with Gear and Pen -
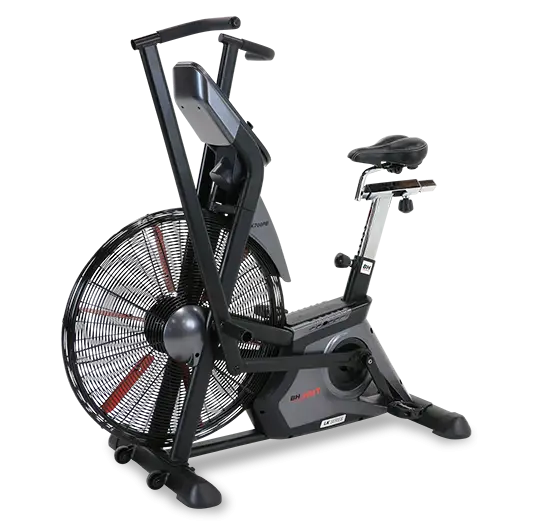
Black Exercise Bike for Indoor Fitness -
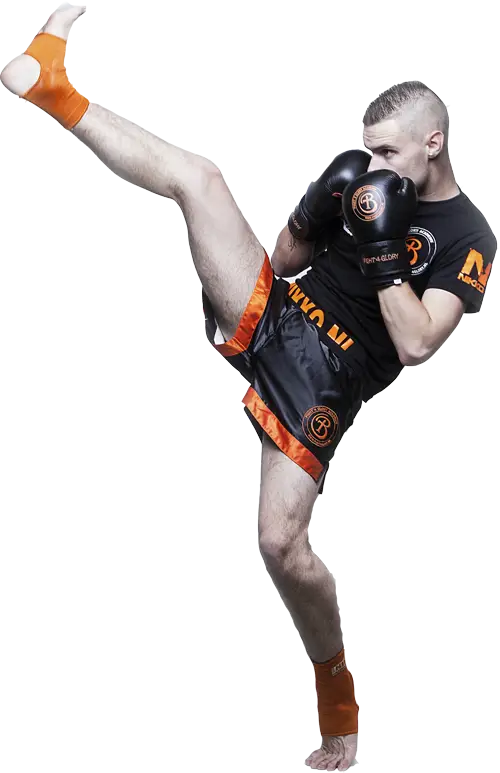
Kickboxer in Action -
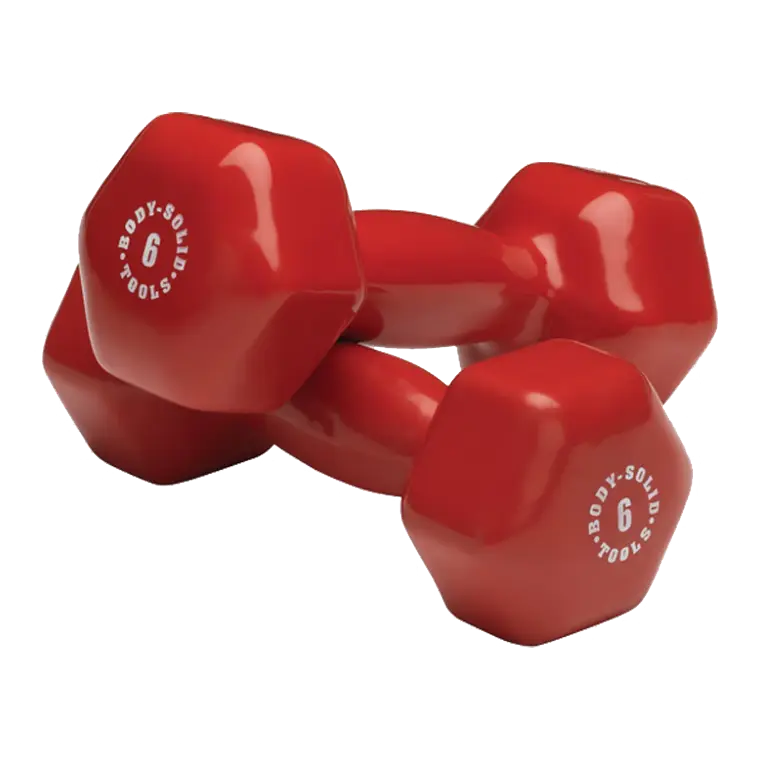
Red Dumbbells for Fitness Training -
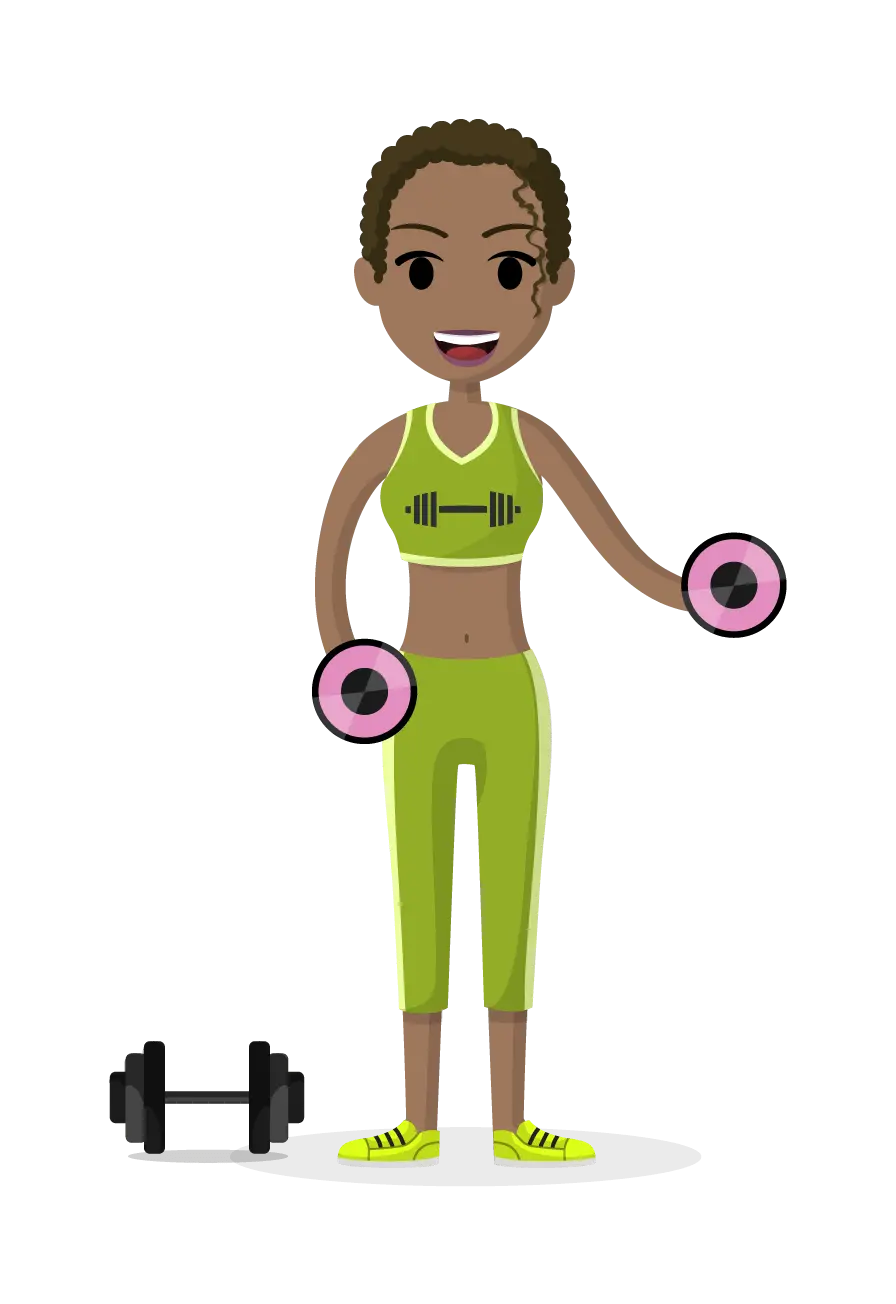
Fitness Woman with Dumbbells