You Might Like
-

Colorful Stack of Books with Decorative Leaves -

Team with Growth Graph Illustration -

Stack of Colorful Books for Learning -

Blue Globe Model for Geography Learning -

Sales and Marketing Funnel Diagram -
Book Illustration with Back to School Text -
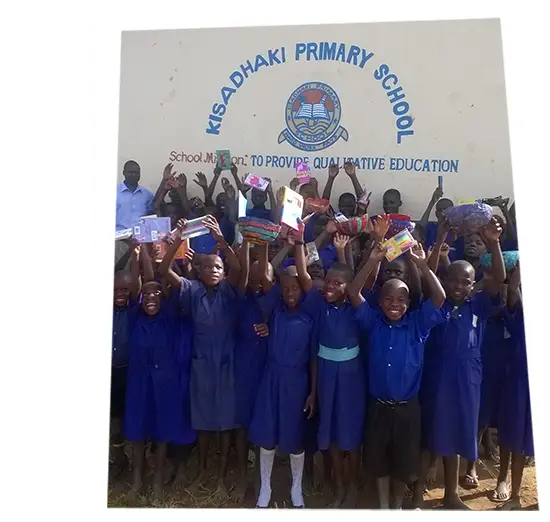
Group of Students at School -

Cartoon Teacher with Book Illustration -

Girl Reading Braille for World Braille Day -

Icon of KPI Dashboard with Graph and Person -
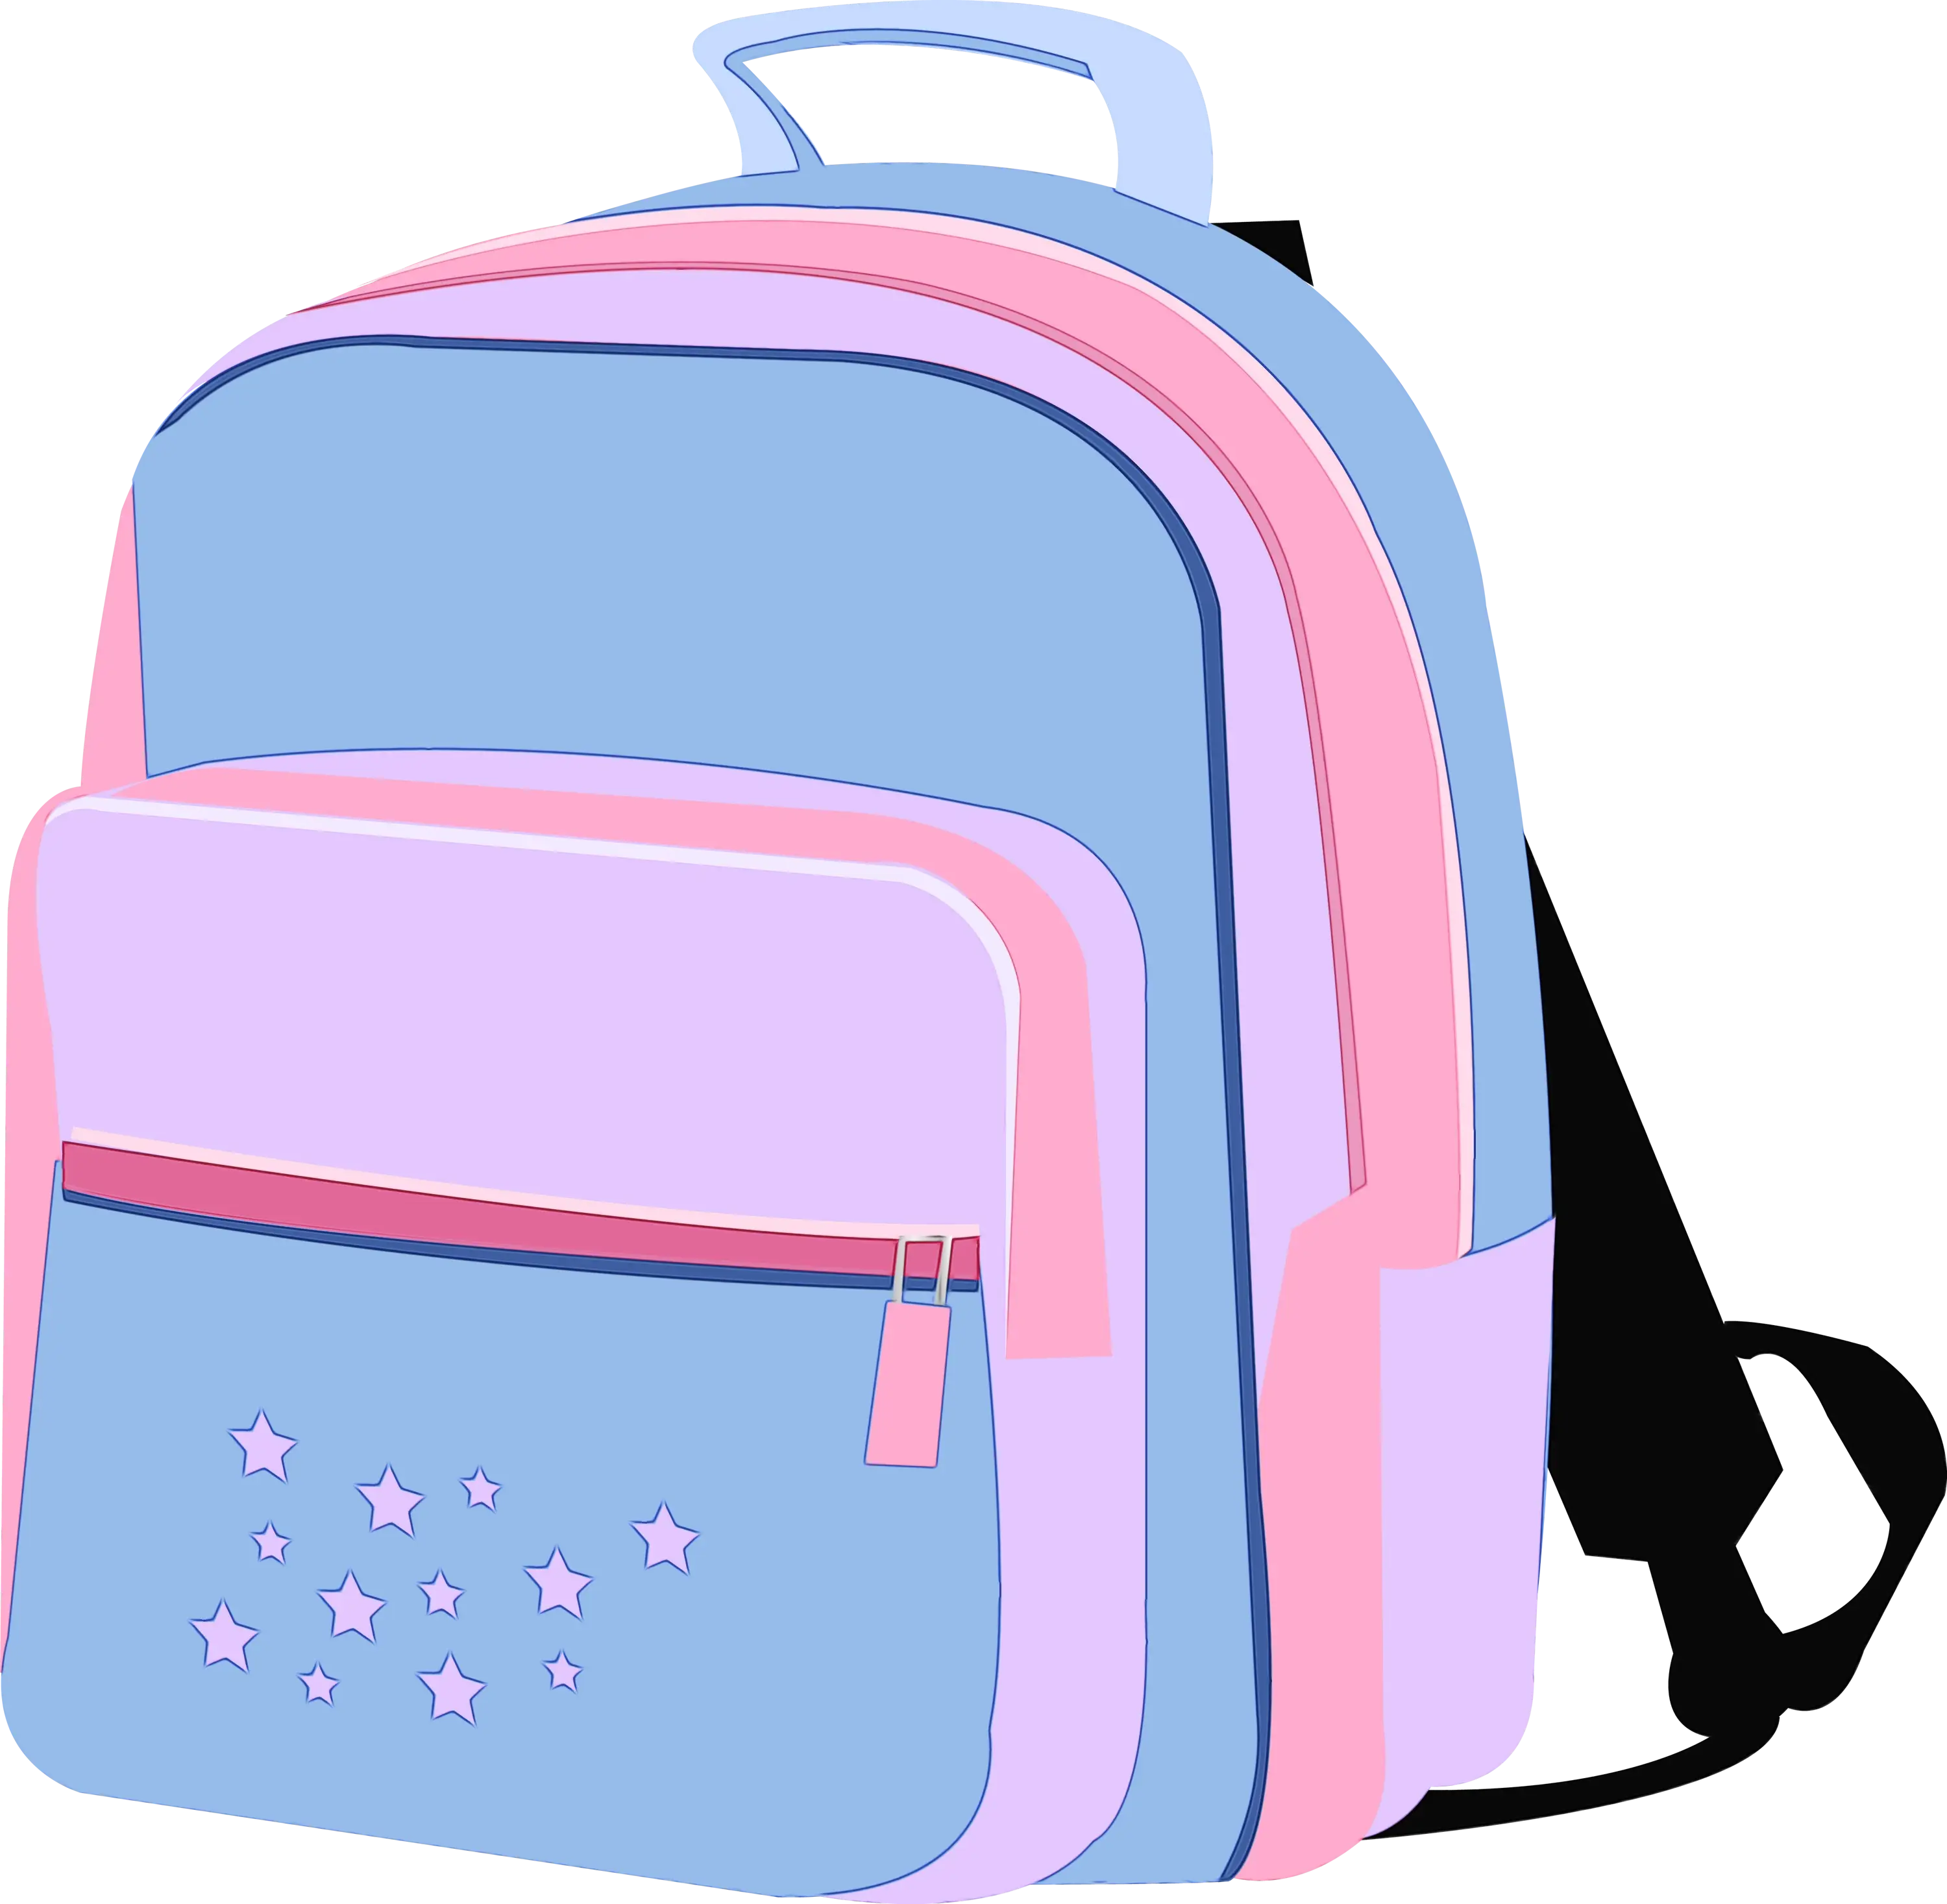
Blue and Pink Backpack with Star Details -

Watercolor Illustration of Graduation Cap and Books -

School Building with Clock on Facade -

Yellow Ethernet Cable for Network Connections -

Bar Chart with Upward Arrow -

Graduation Cap on Stack of Books -

Graduation Cap Symbol for Education -

Young Student with Glasses and Backpack -

Child Reading Book Illustration -

Search Growth Icon -

Back to School Sale Poster with Stationery Items -

Illustration of Growth Chart with Upward Arrow -

Concordia University Logo -

Boy Reading Orange Book Cartoon Illustration -

Student Studying at Desk -
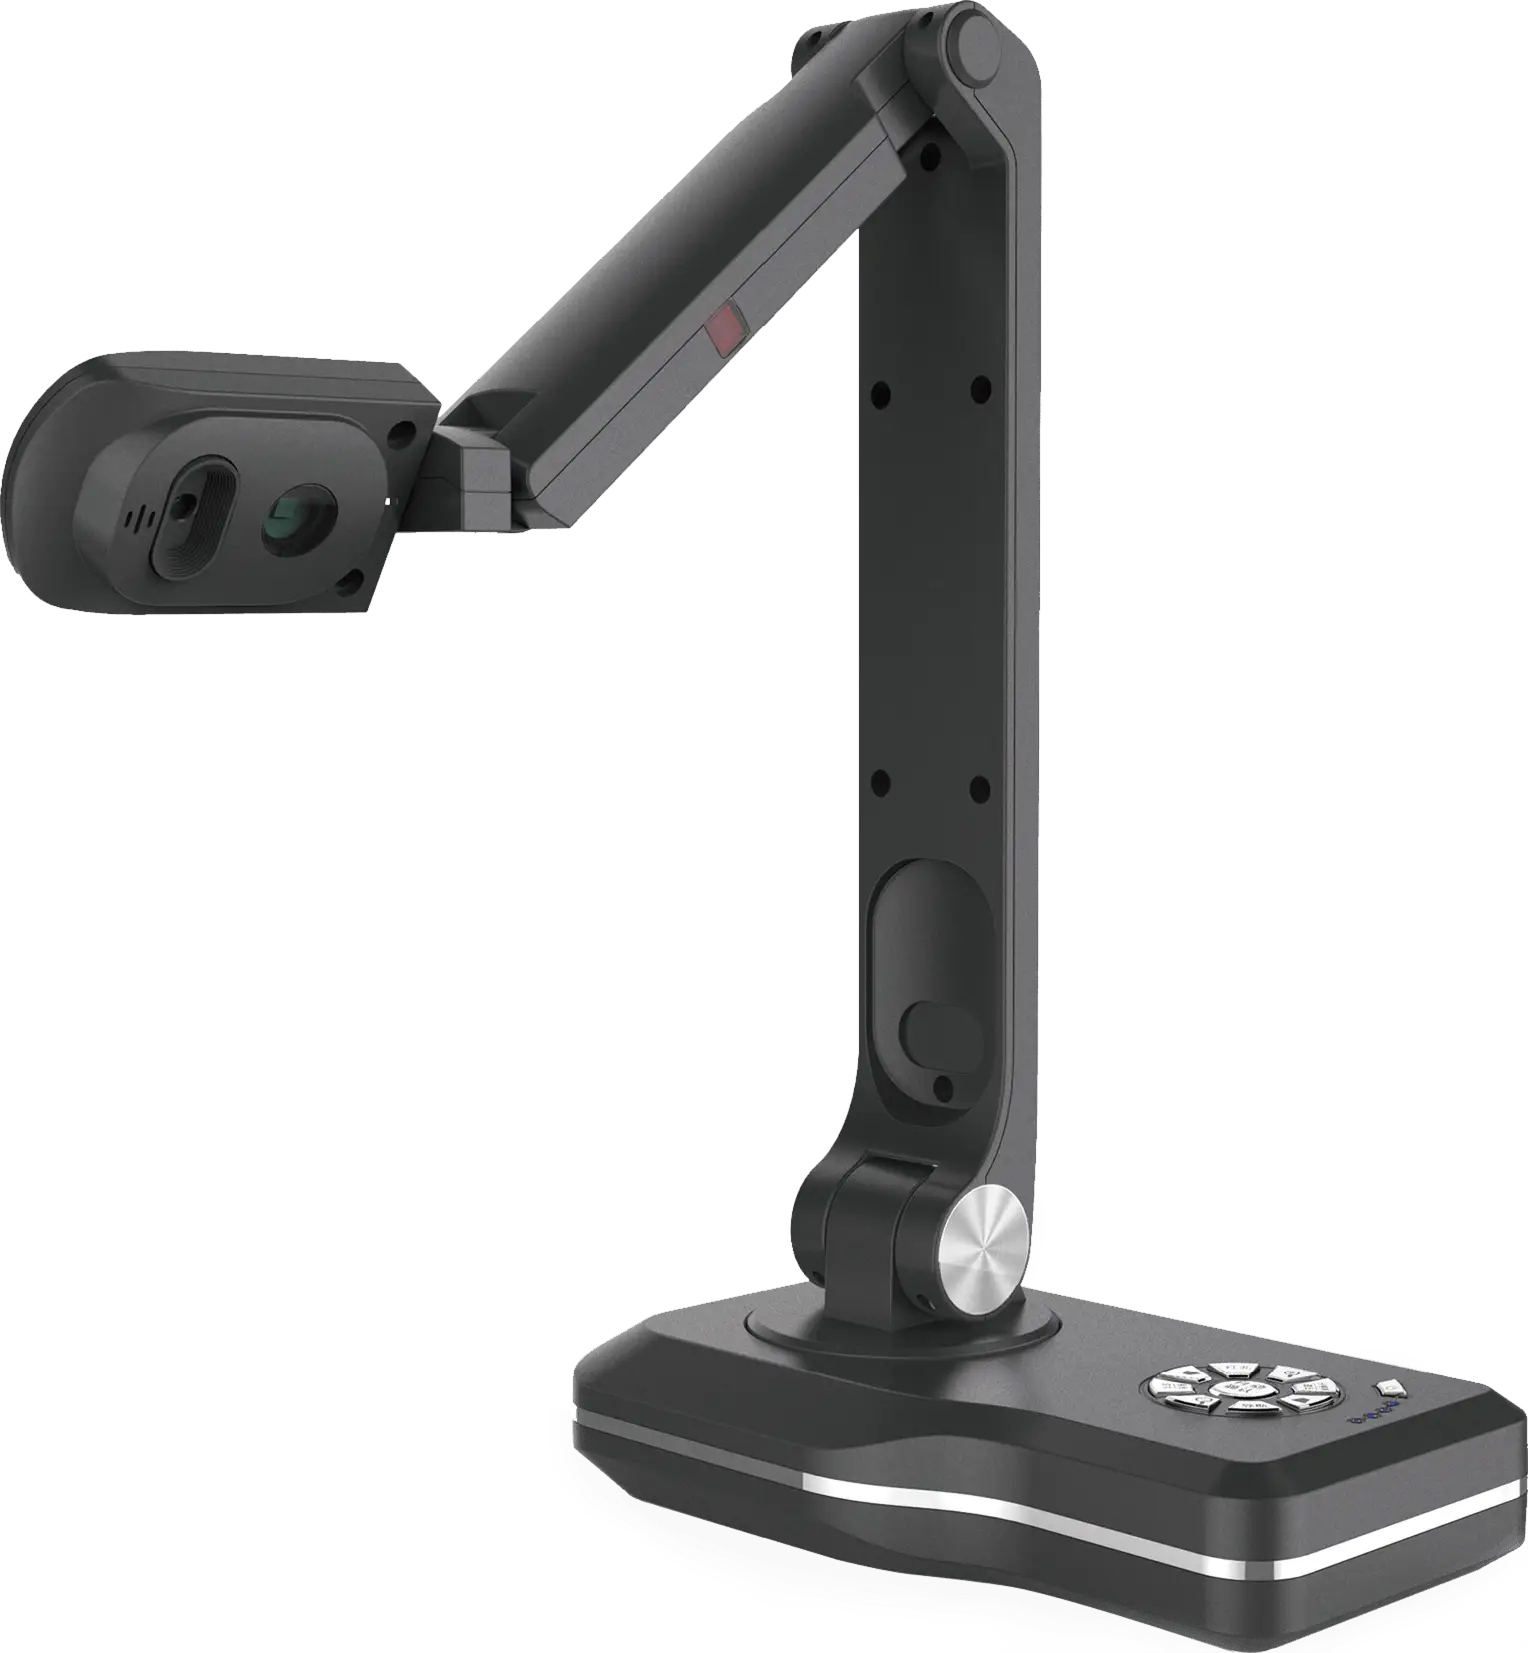
Modern Document Camera -
Morehouse College Seal -

Back to School Banner with Stationery Icons -

Business Icons Set for Digital Workflows -

Circle Pie Chart Icon