You Might Like
-
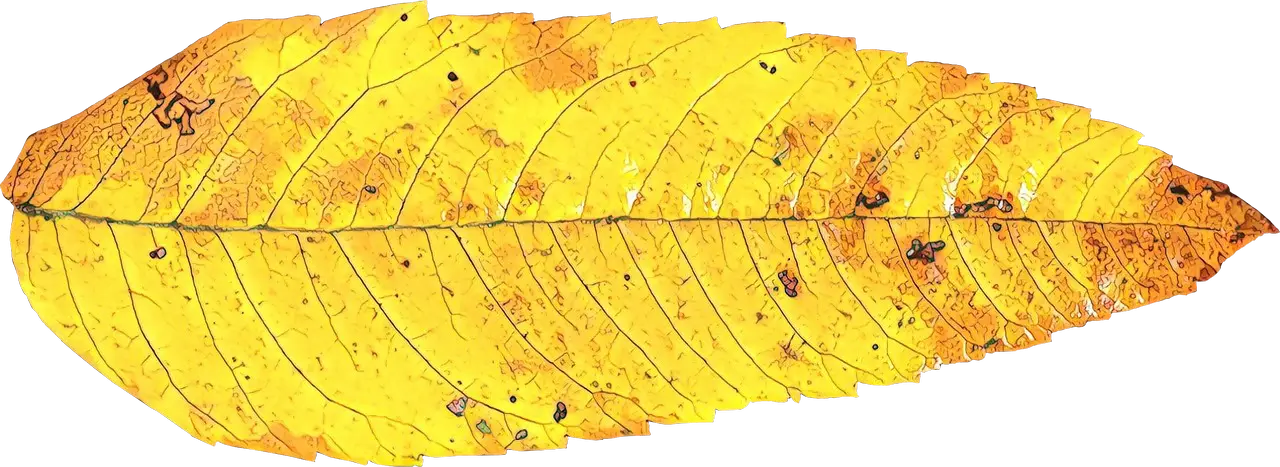
Yellow Autumn Leaf -
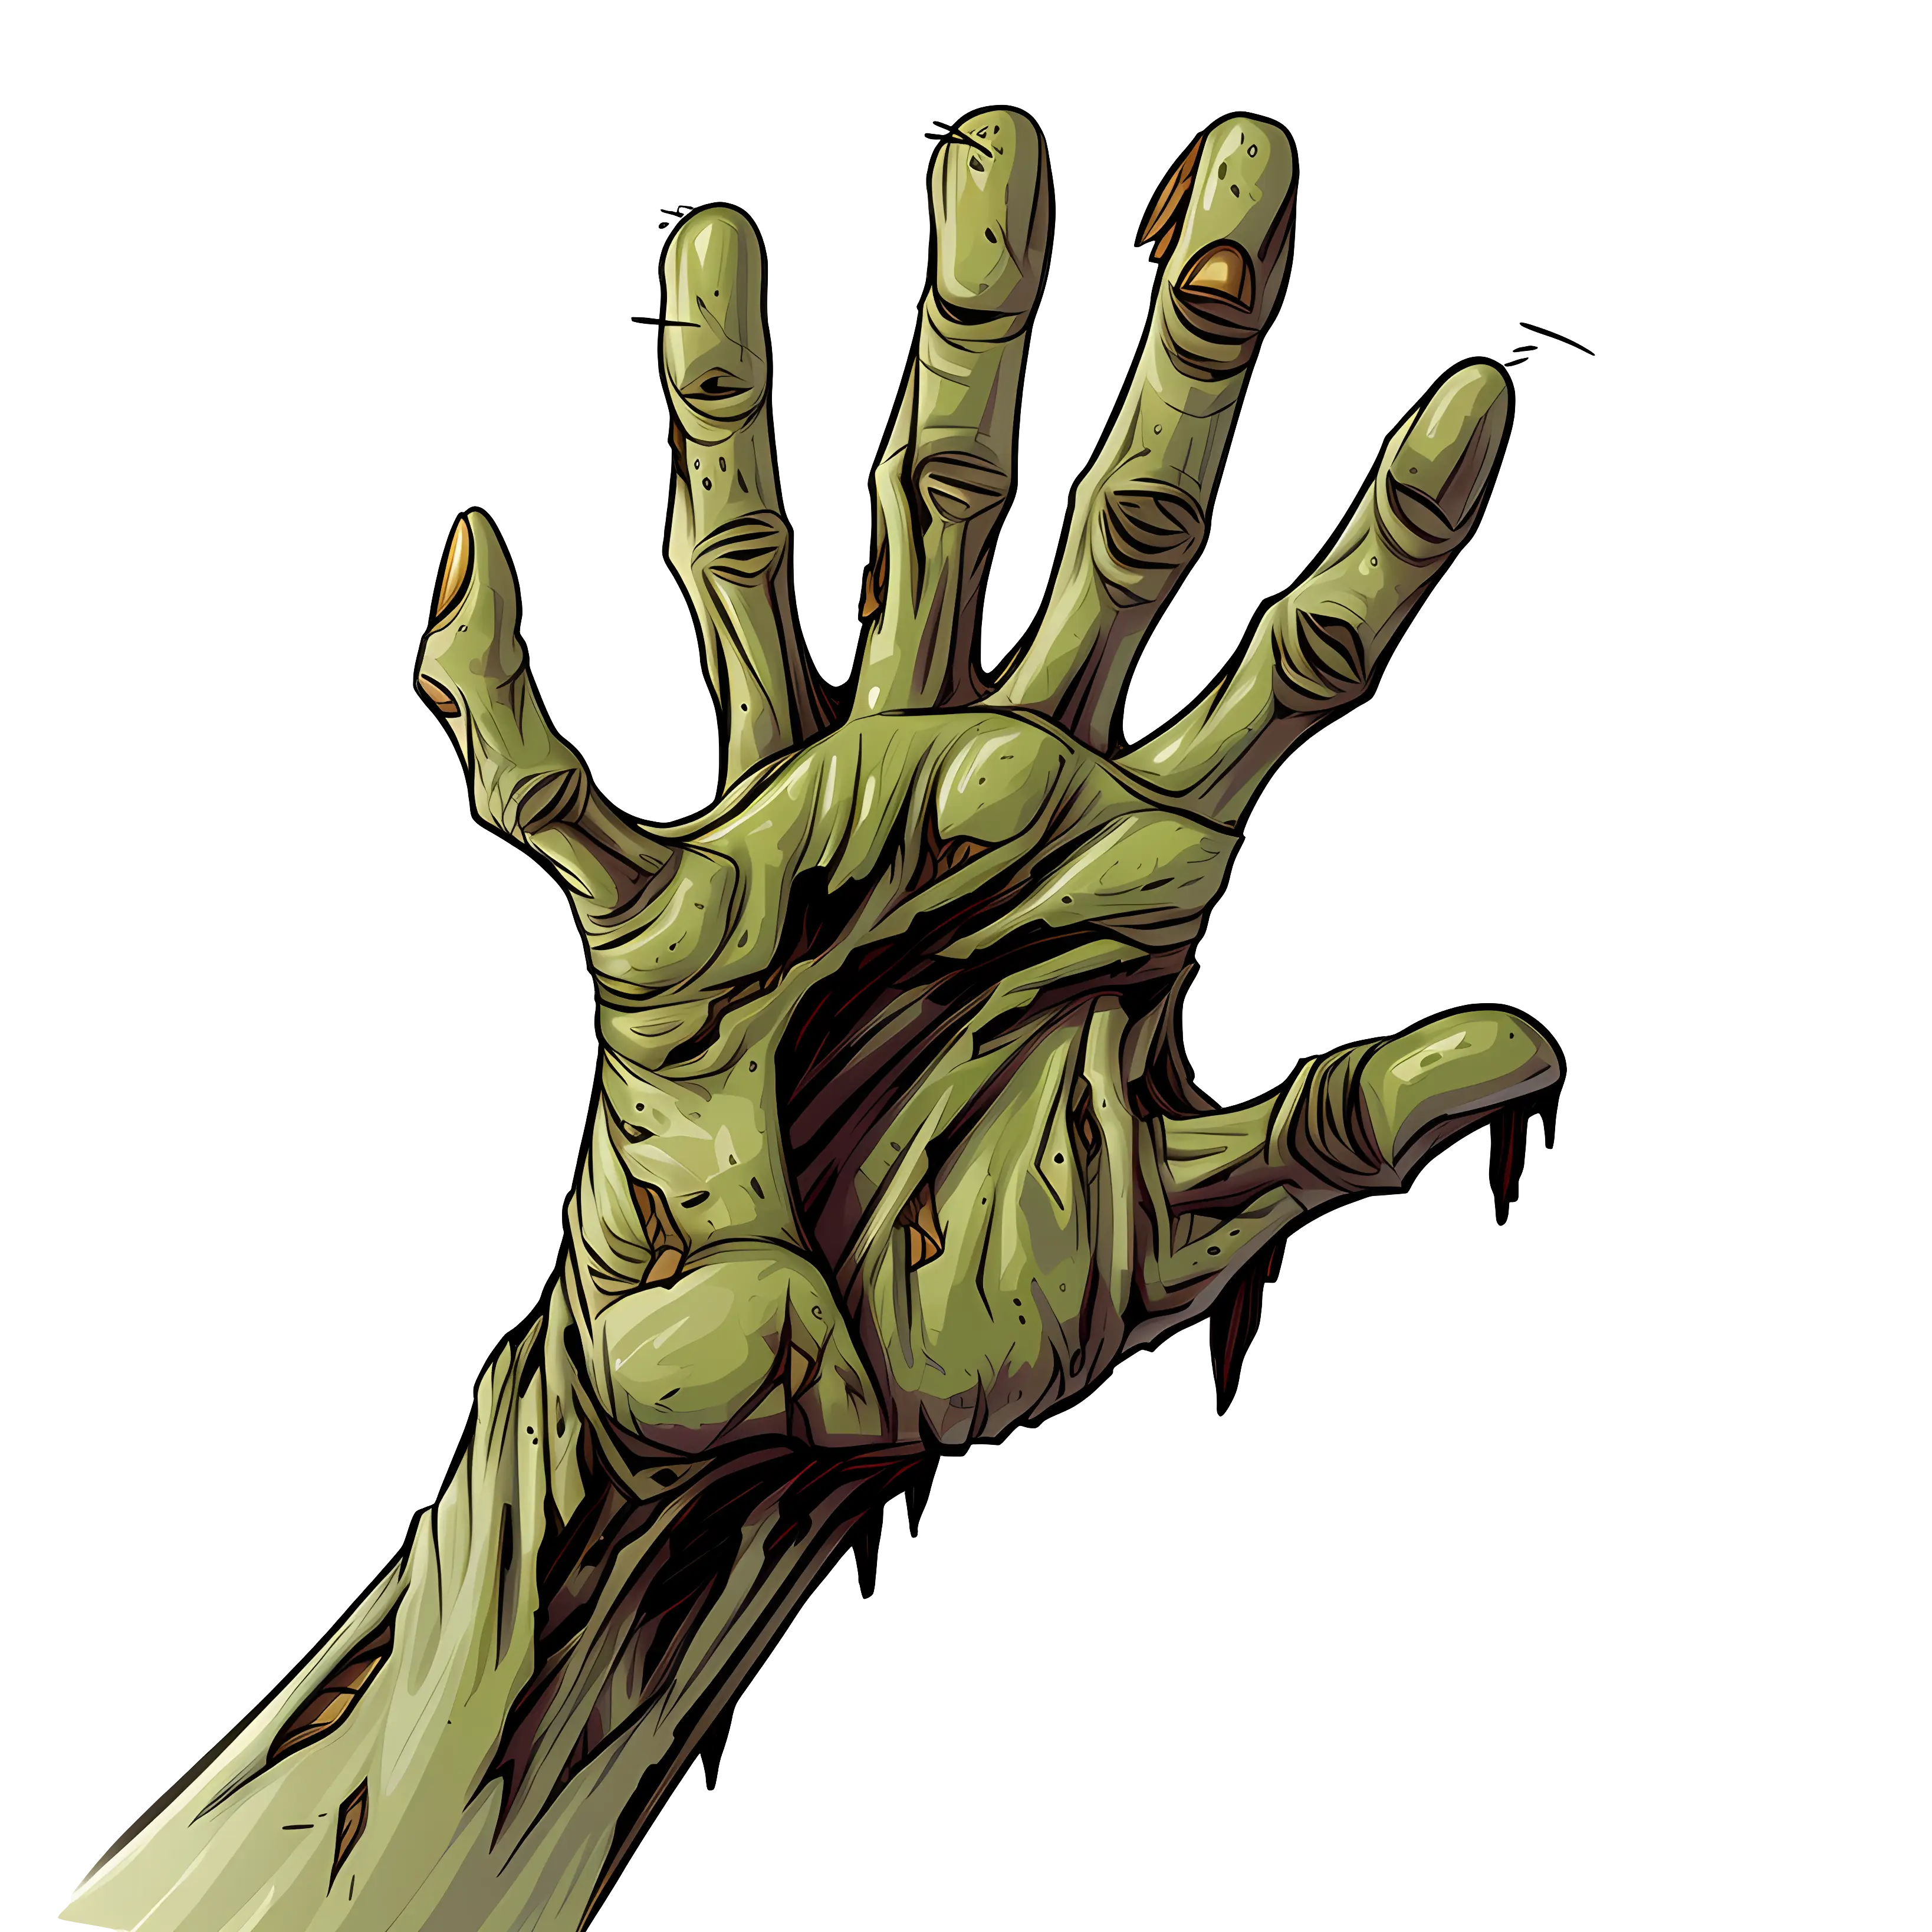
Zombie Hand Reaching Up -
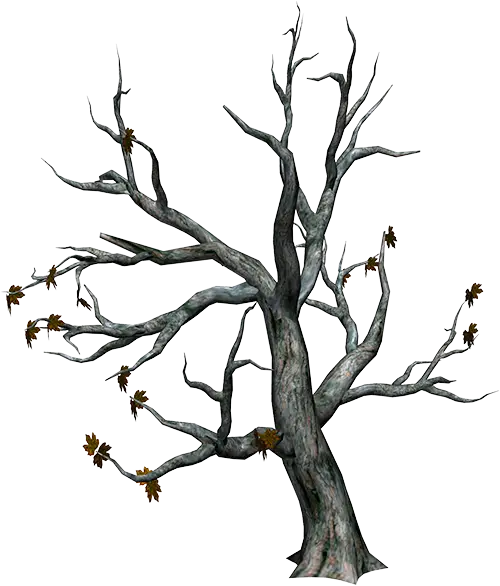
Bare Tree with Sparse Leaves Illustration -
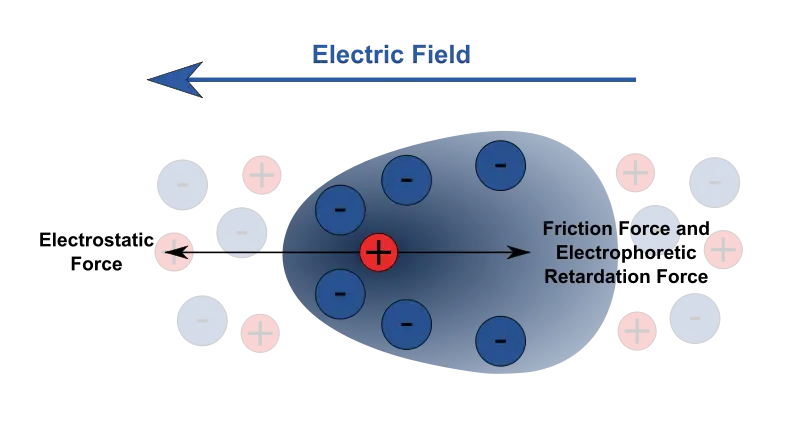
Electric Field and Electrostatic Force Diagram -
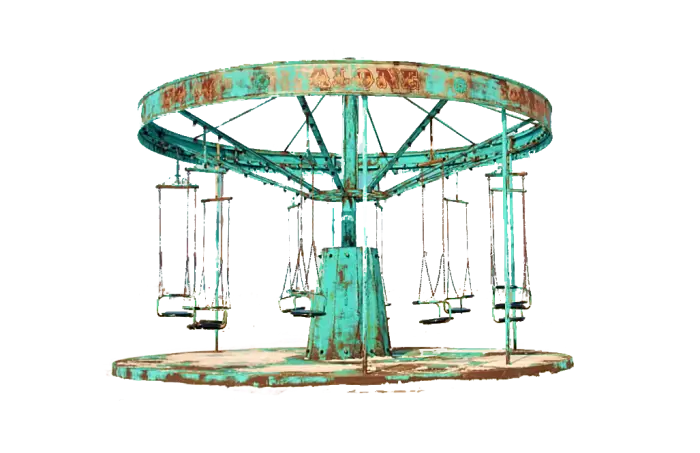
Rusty Old Carousel -

Autumn Leaf Illustration -
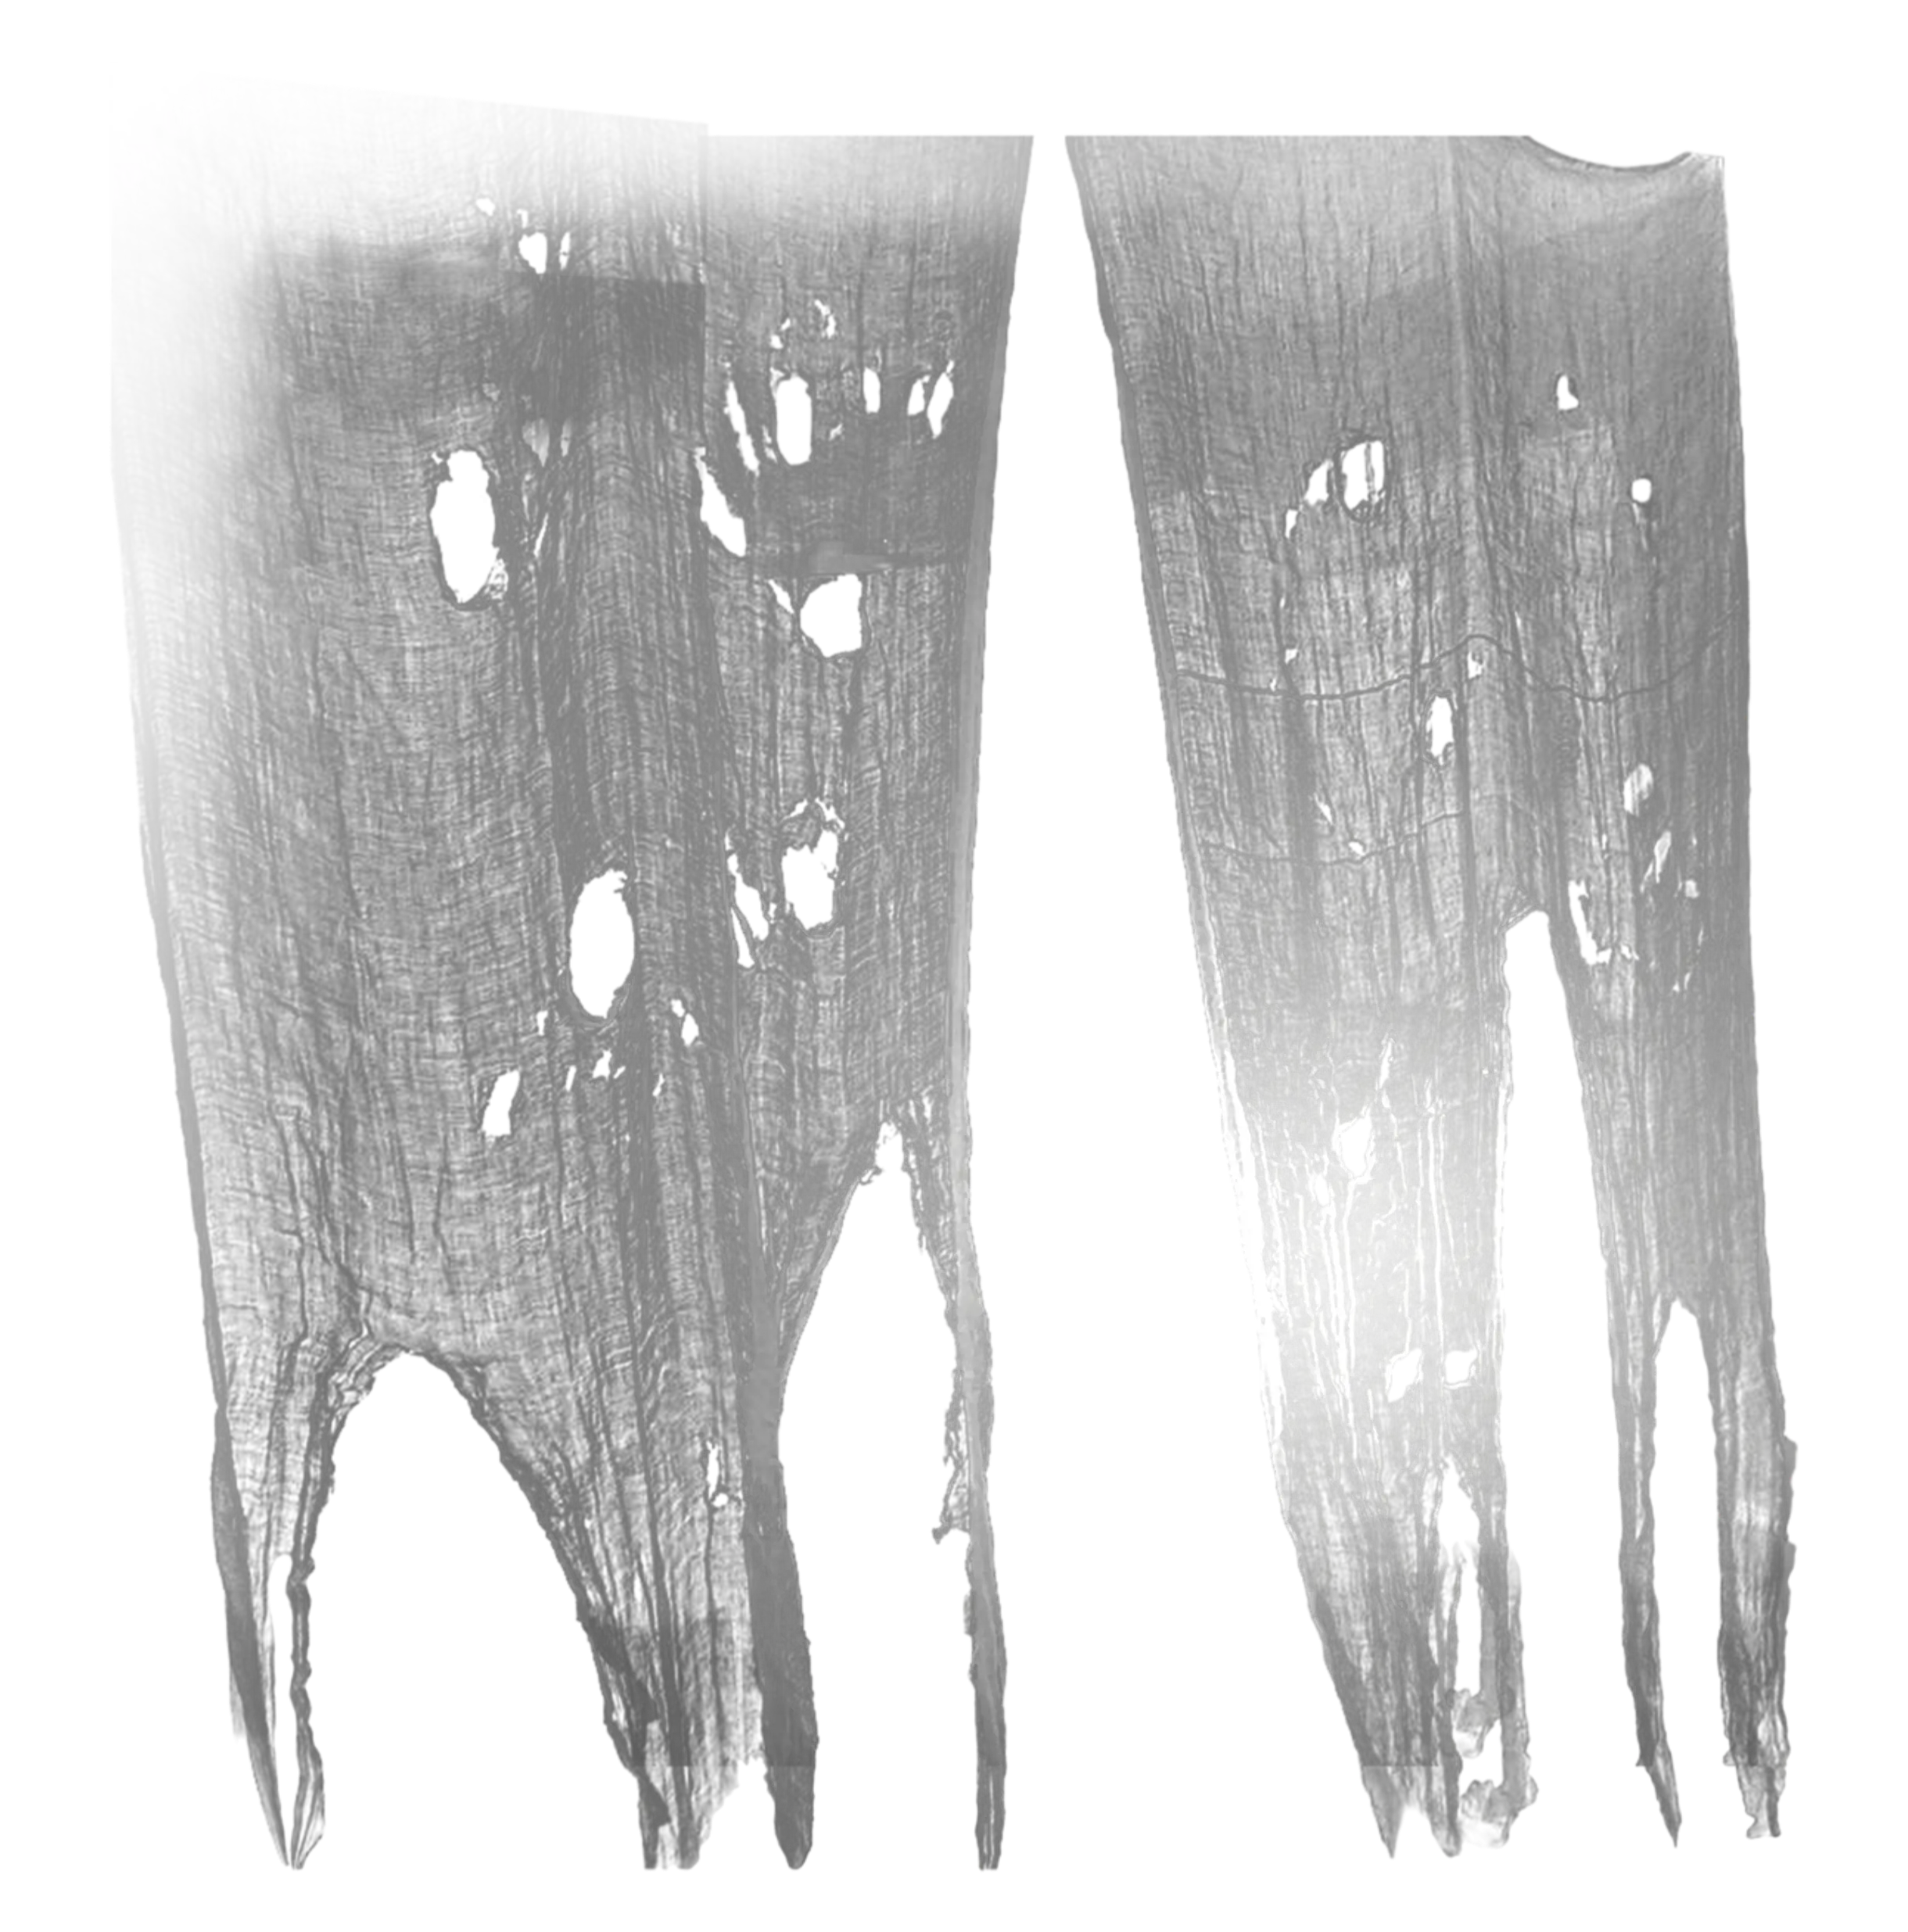
Tattered Cloth Pieces -
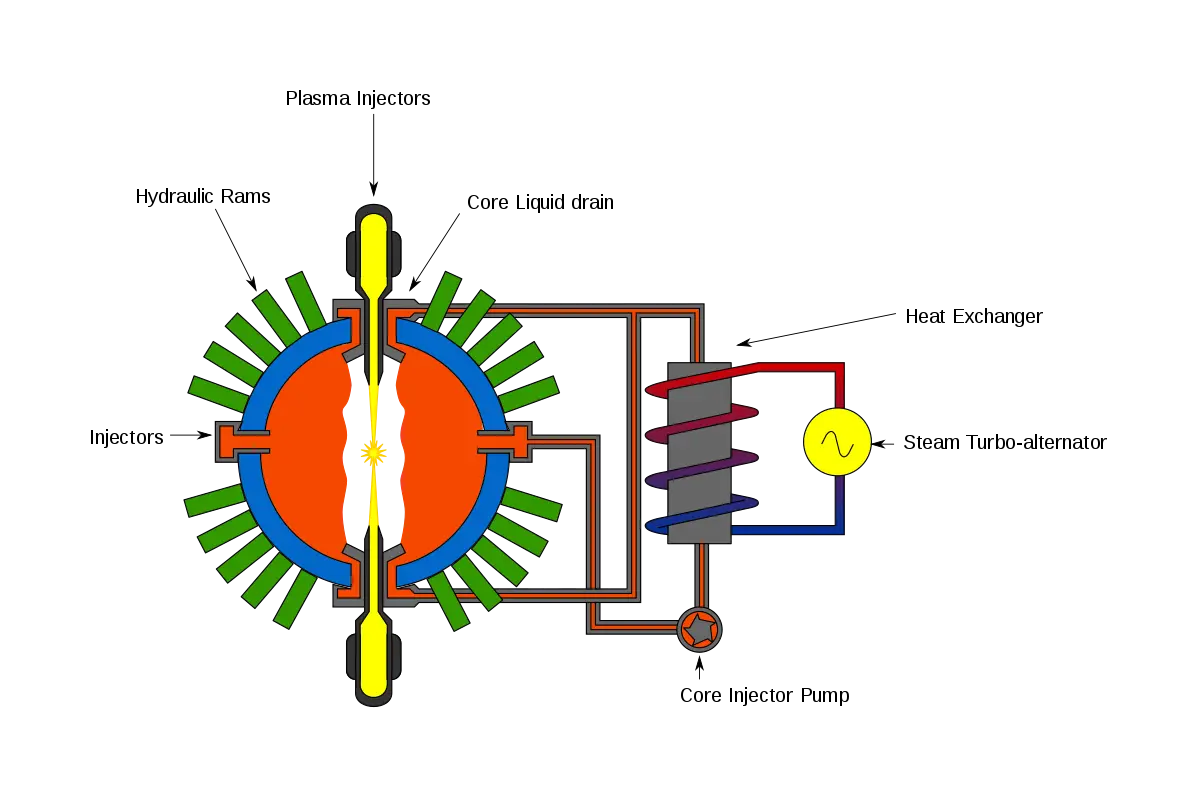
Fusion Reactor Diagram -

Red Atom Symbol for Science -
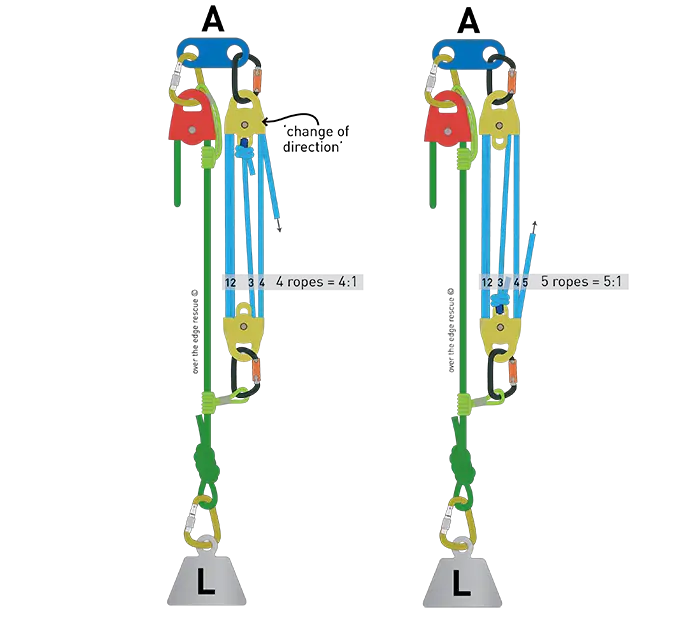
Pulley System Diagram -
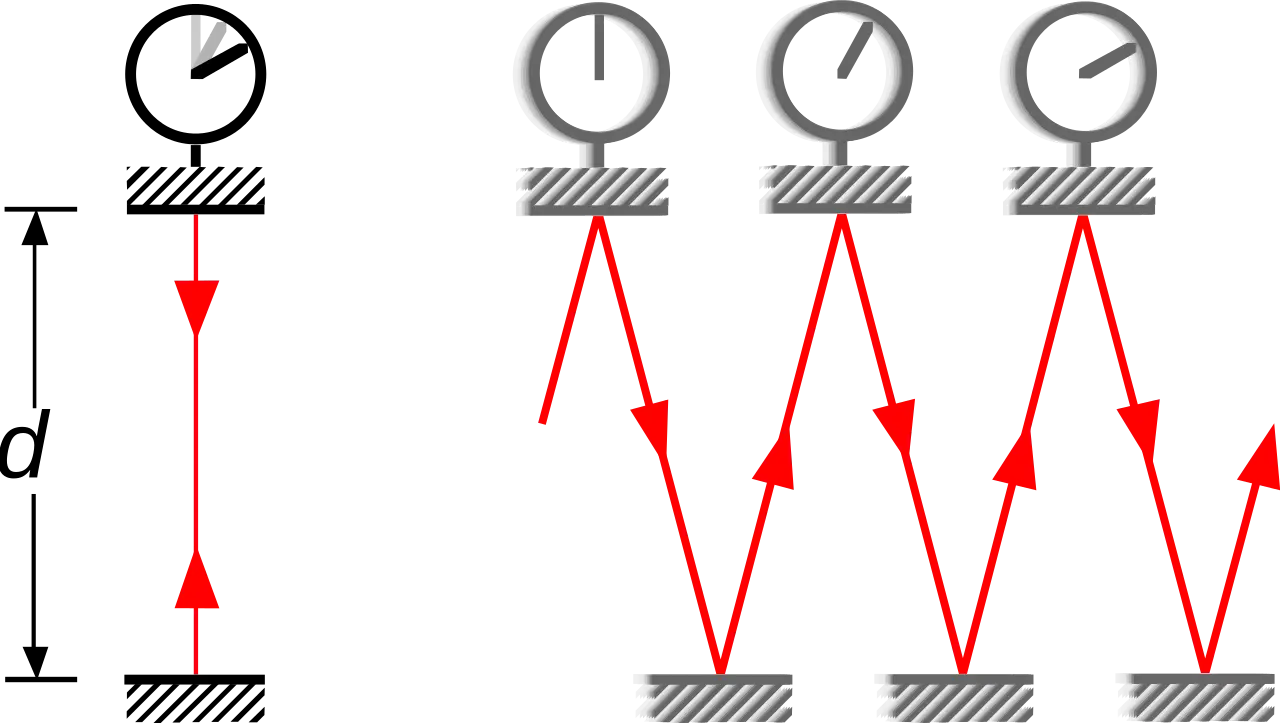
Pendulum Motion Diagram -
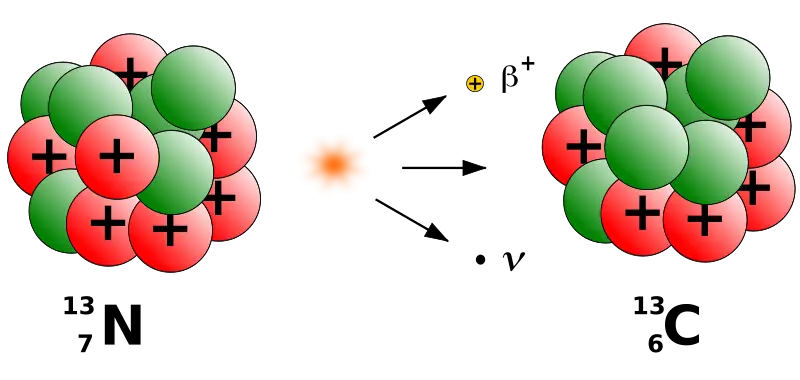
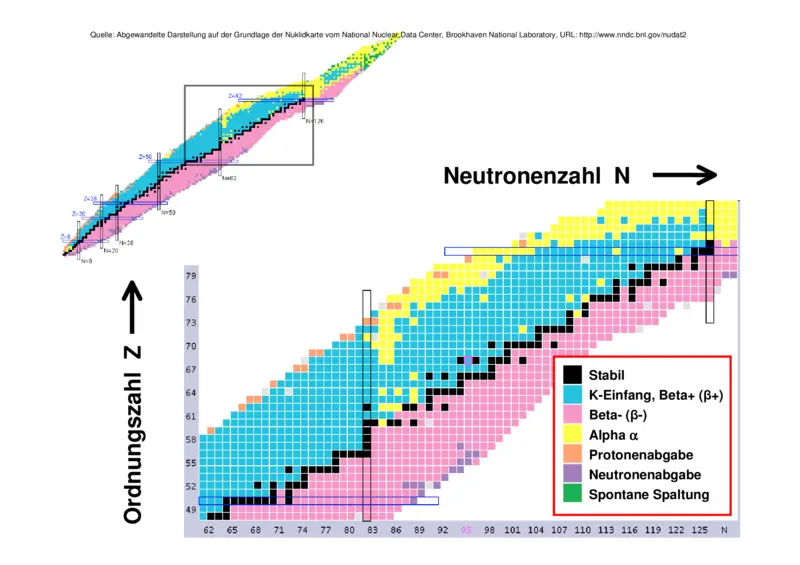
Nuclear Reaction Diagram Representation -

Diffraction Pattern Diagram -

Atomic Symbol Icon Illustration -

Golden Atom Symbol Illustration -

Moss-covered natural wooden log -

Silver Anchor Icon -
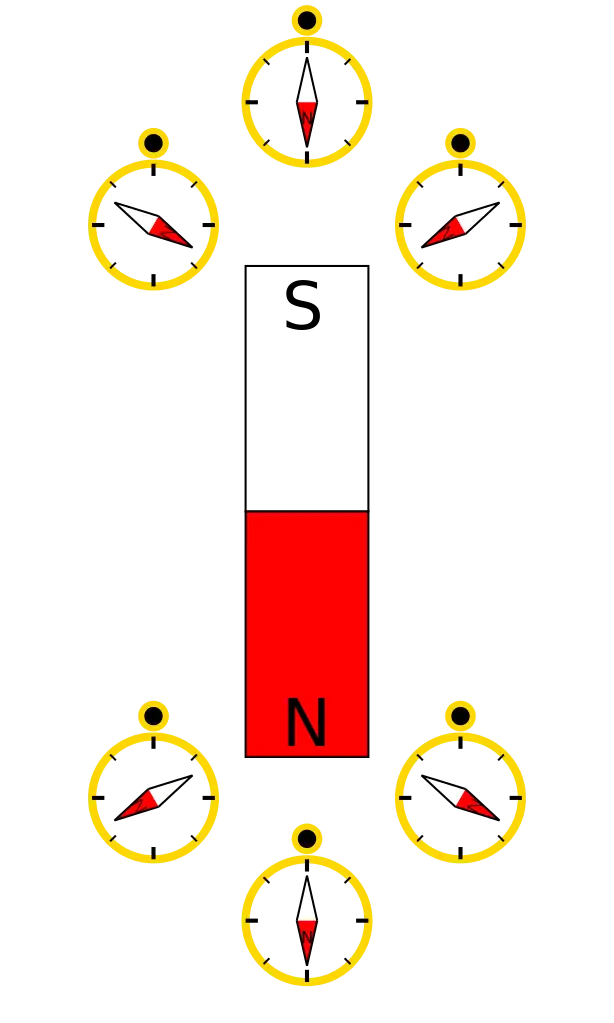
Magnet and Compasses Illustration -

Atomic Structure Symbol -

Greek Mu Symbol -
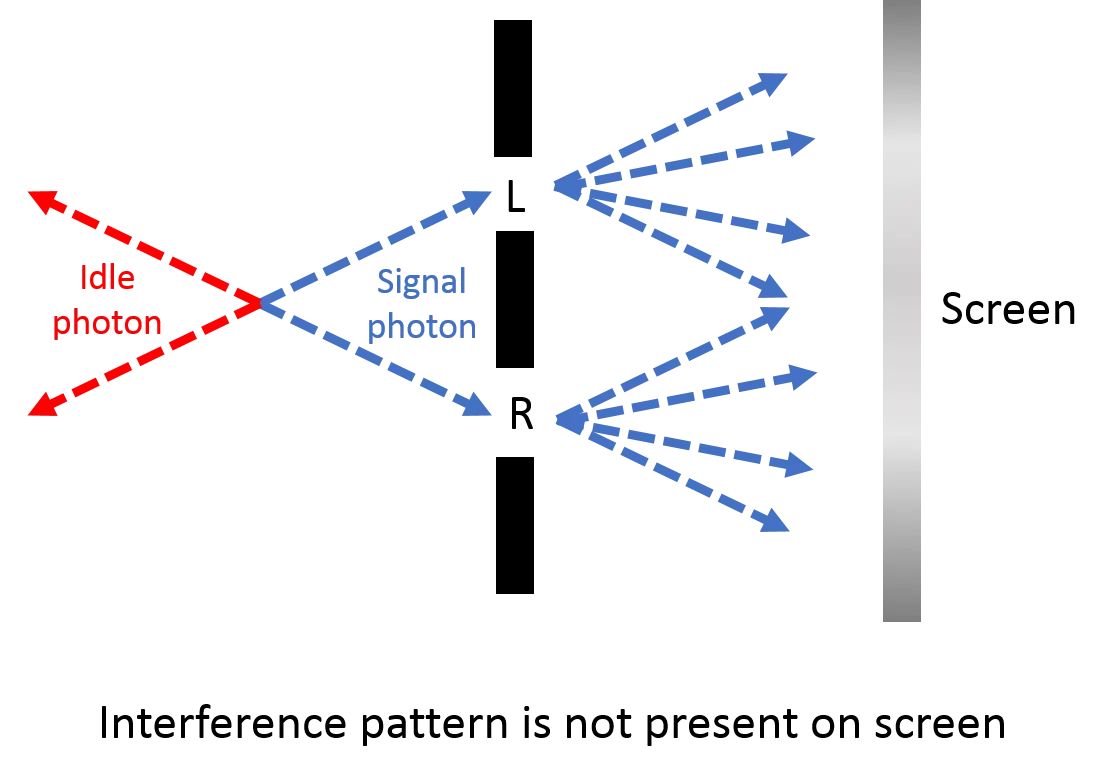
Photon Interference Pattern Diagram -

Mathematical Lambda Symbol -
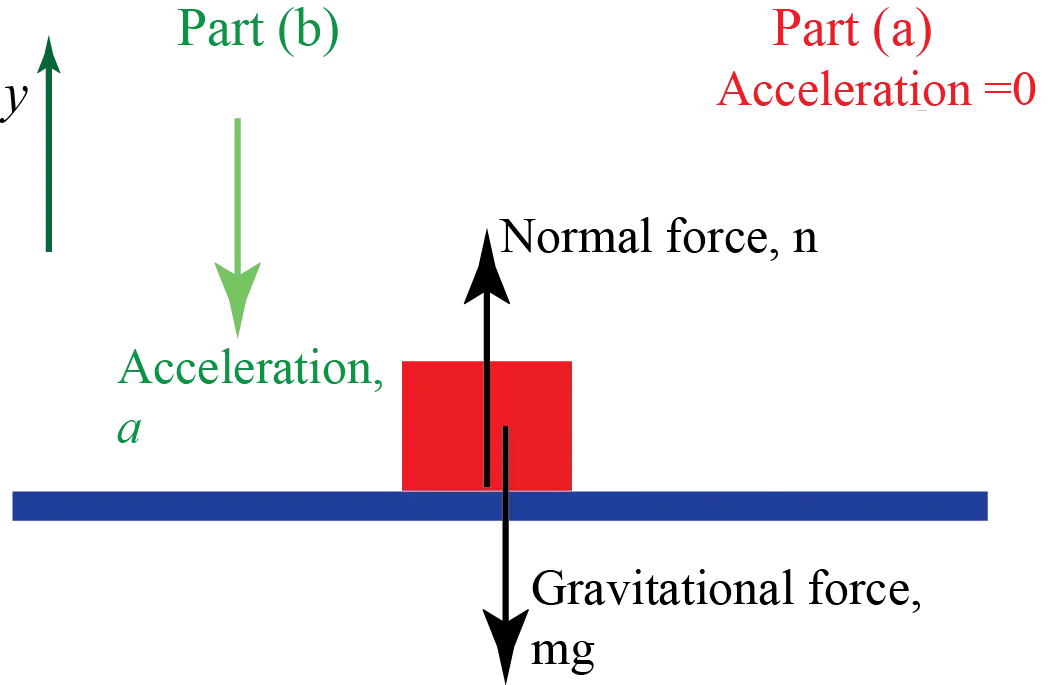
Physics Free Body Diagram with Forces -

Black Anchor Nautical Symbol -

Horseshoe Magnet Illustration for Physics -

Electromagnet Illustration -

Atomic Structure Illustration with Colored Orbitals -

Atomic Structure Symbol for Science Illustration -
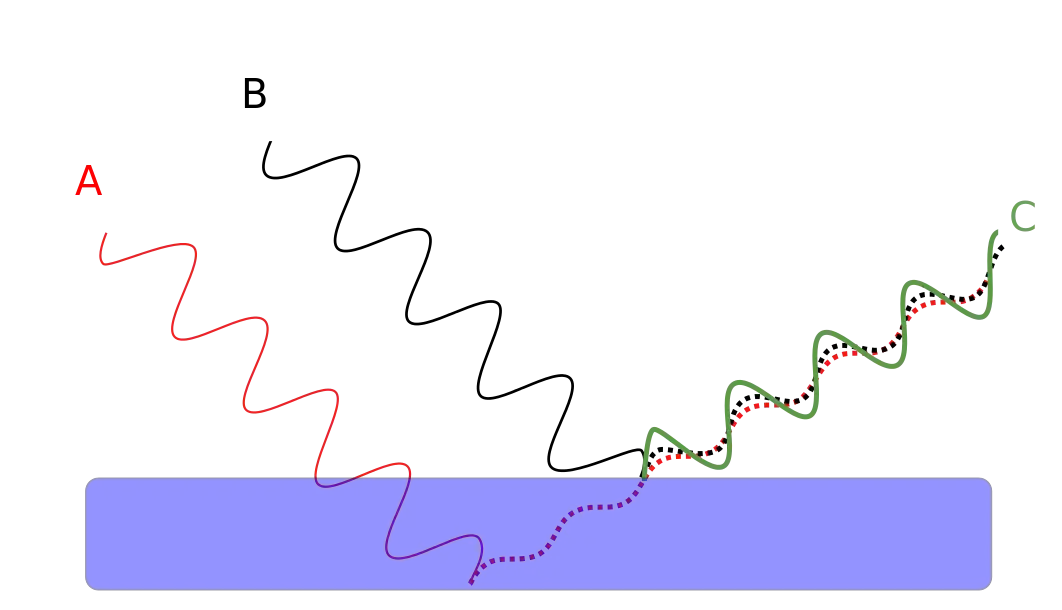
Light Waves Refraction Diagram -
Camera Tripod for Photography