You Might Like
-

Red Virus Illustration Representing Pathogen -

Cross Made of DNA Strands -
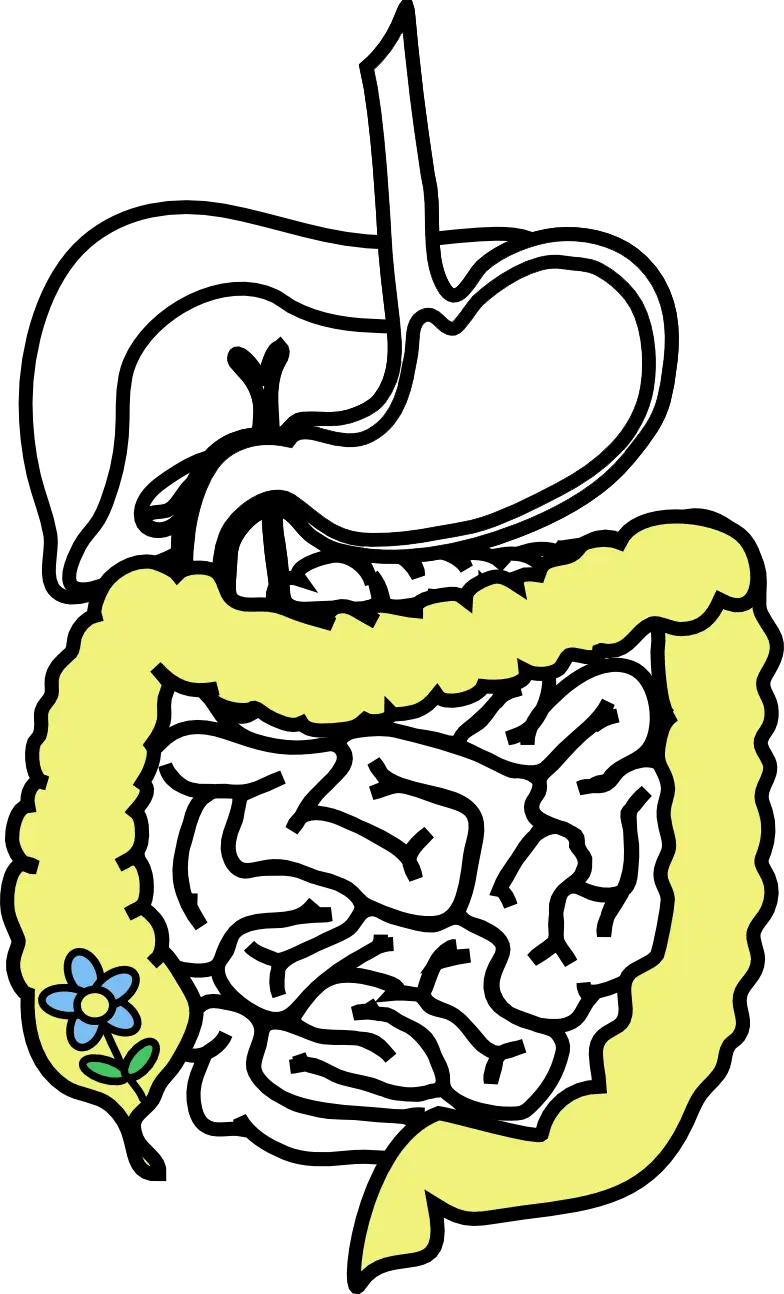
Digestive System Diagram -
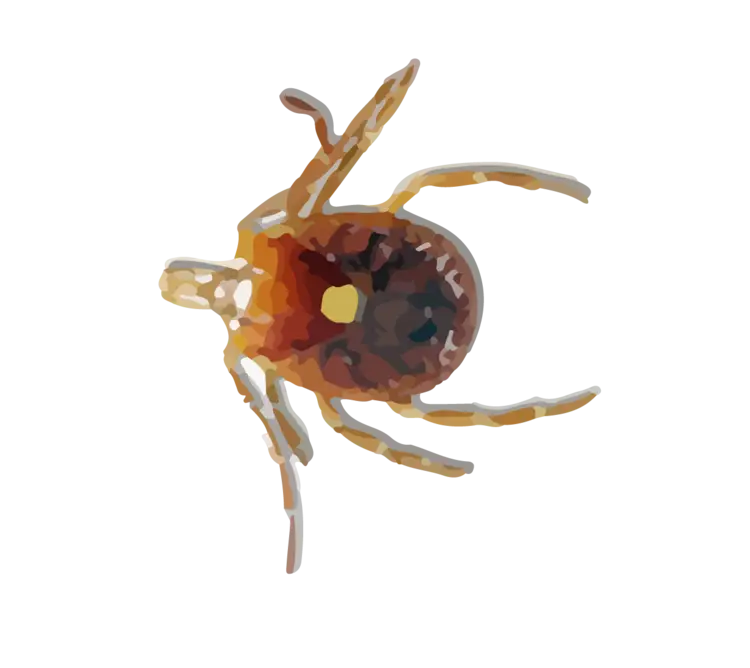
Brown Tick Close-Up Illustration -
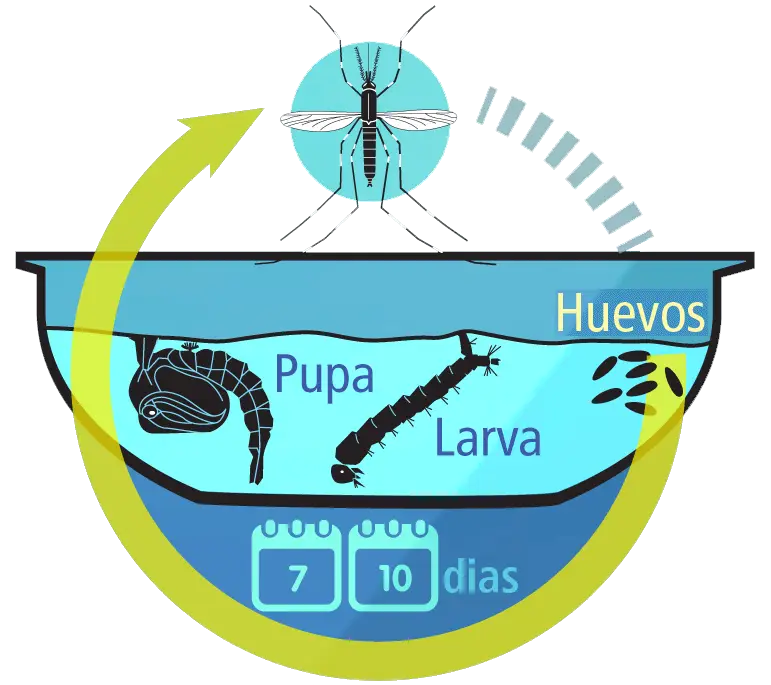
Mosquito Life Cycle Diagram -
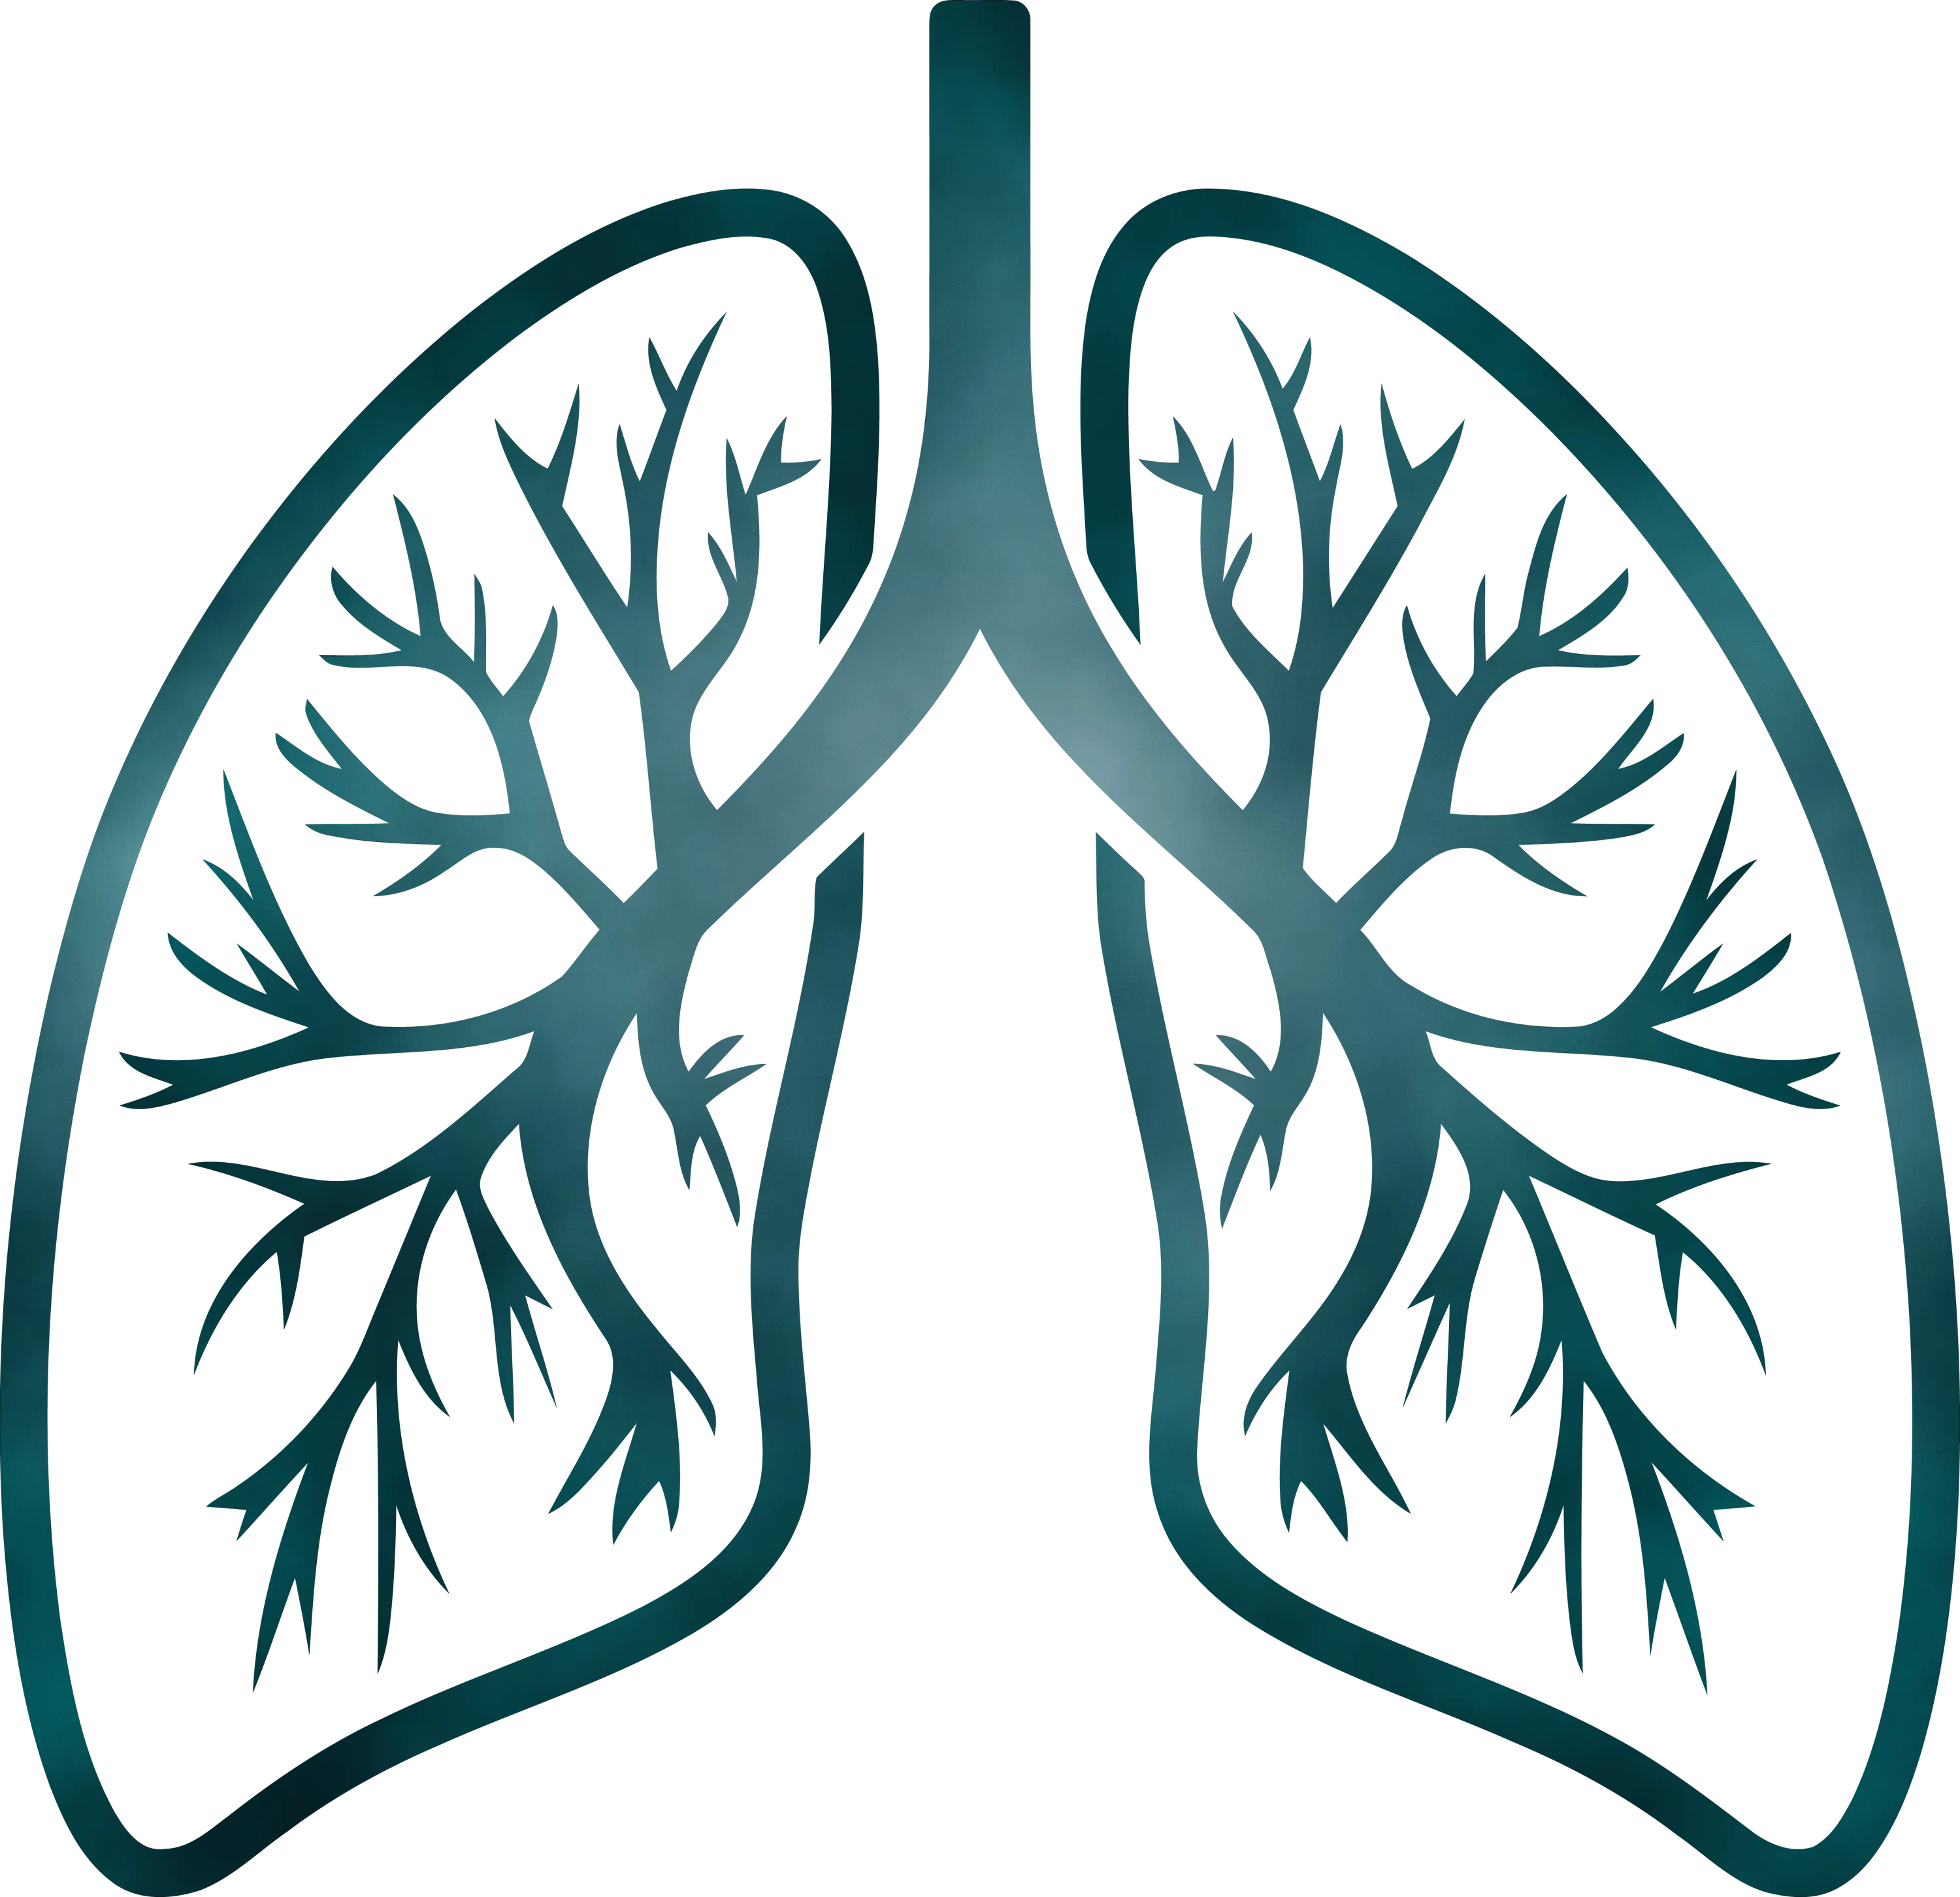
Detailed Lungs Diagram Illustration -
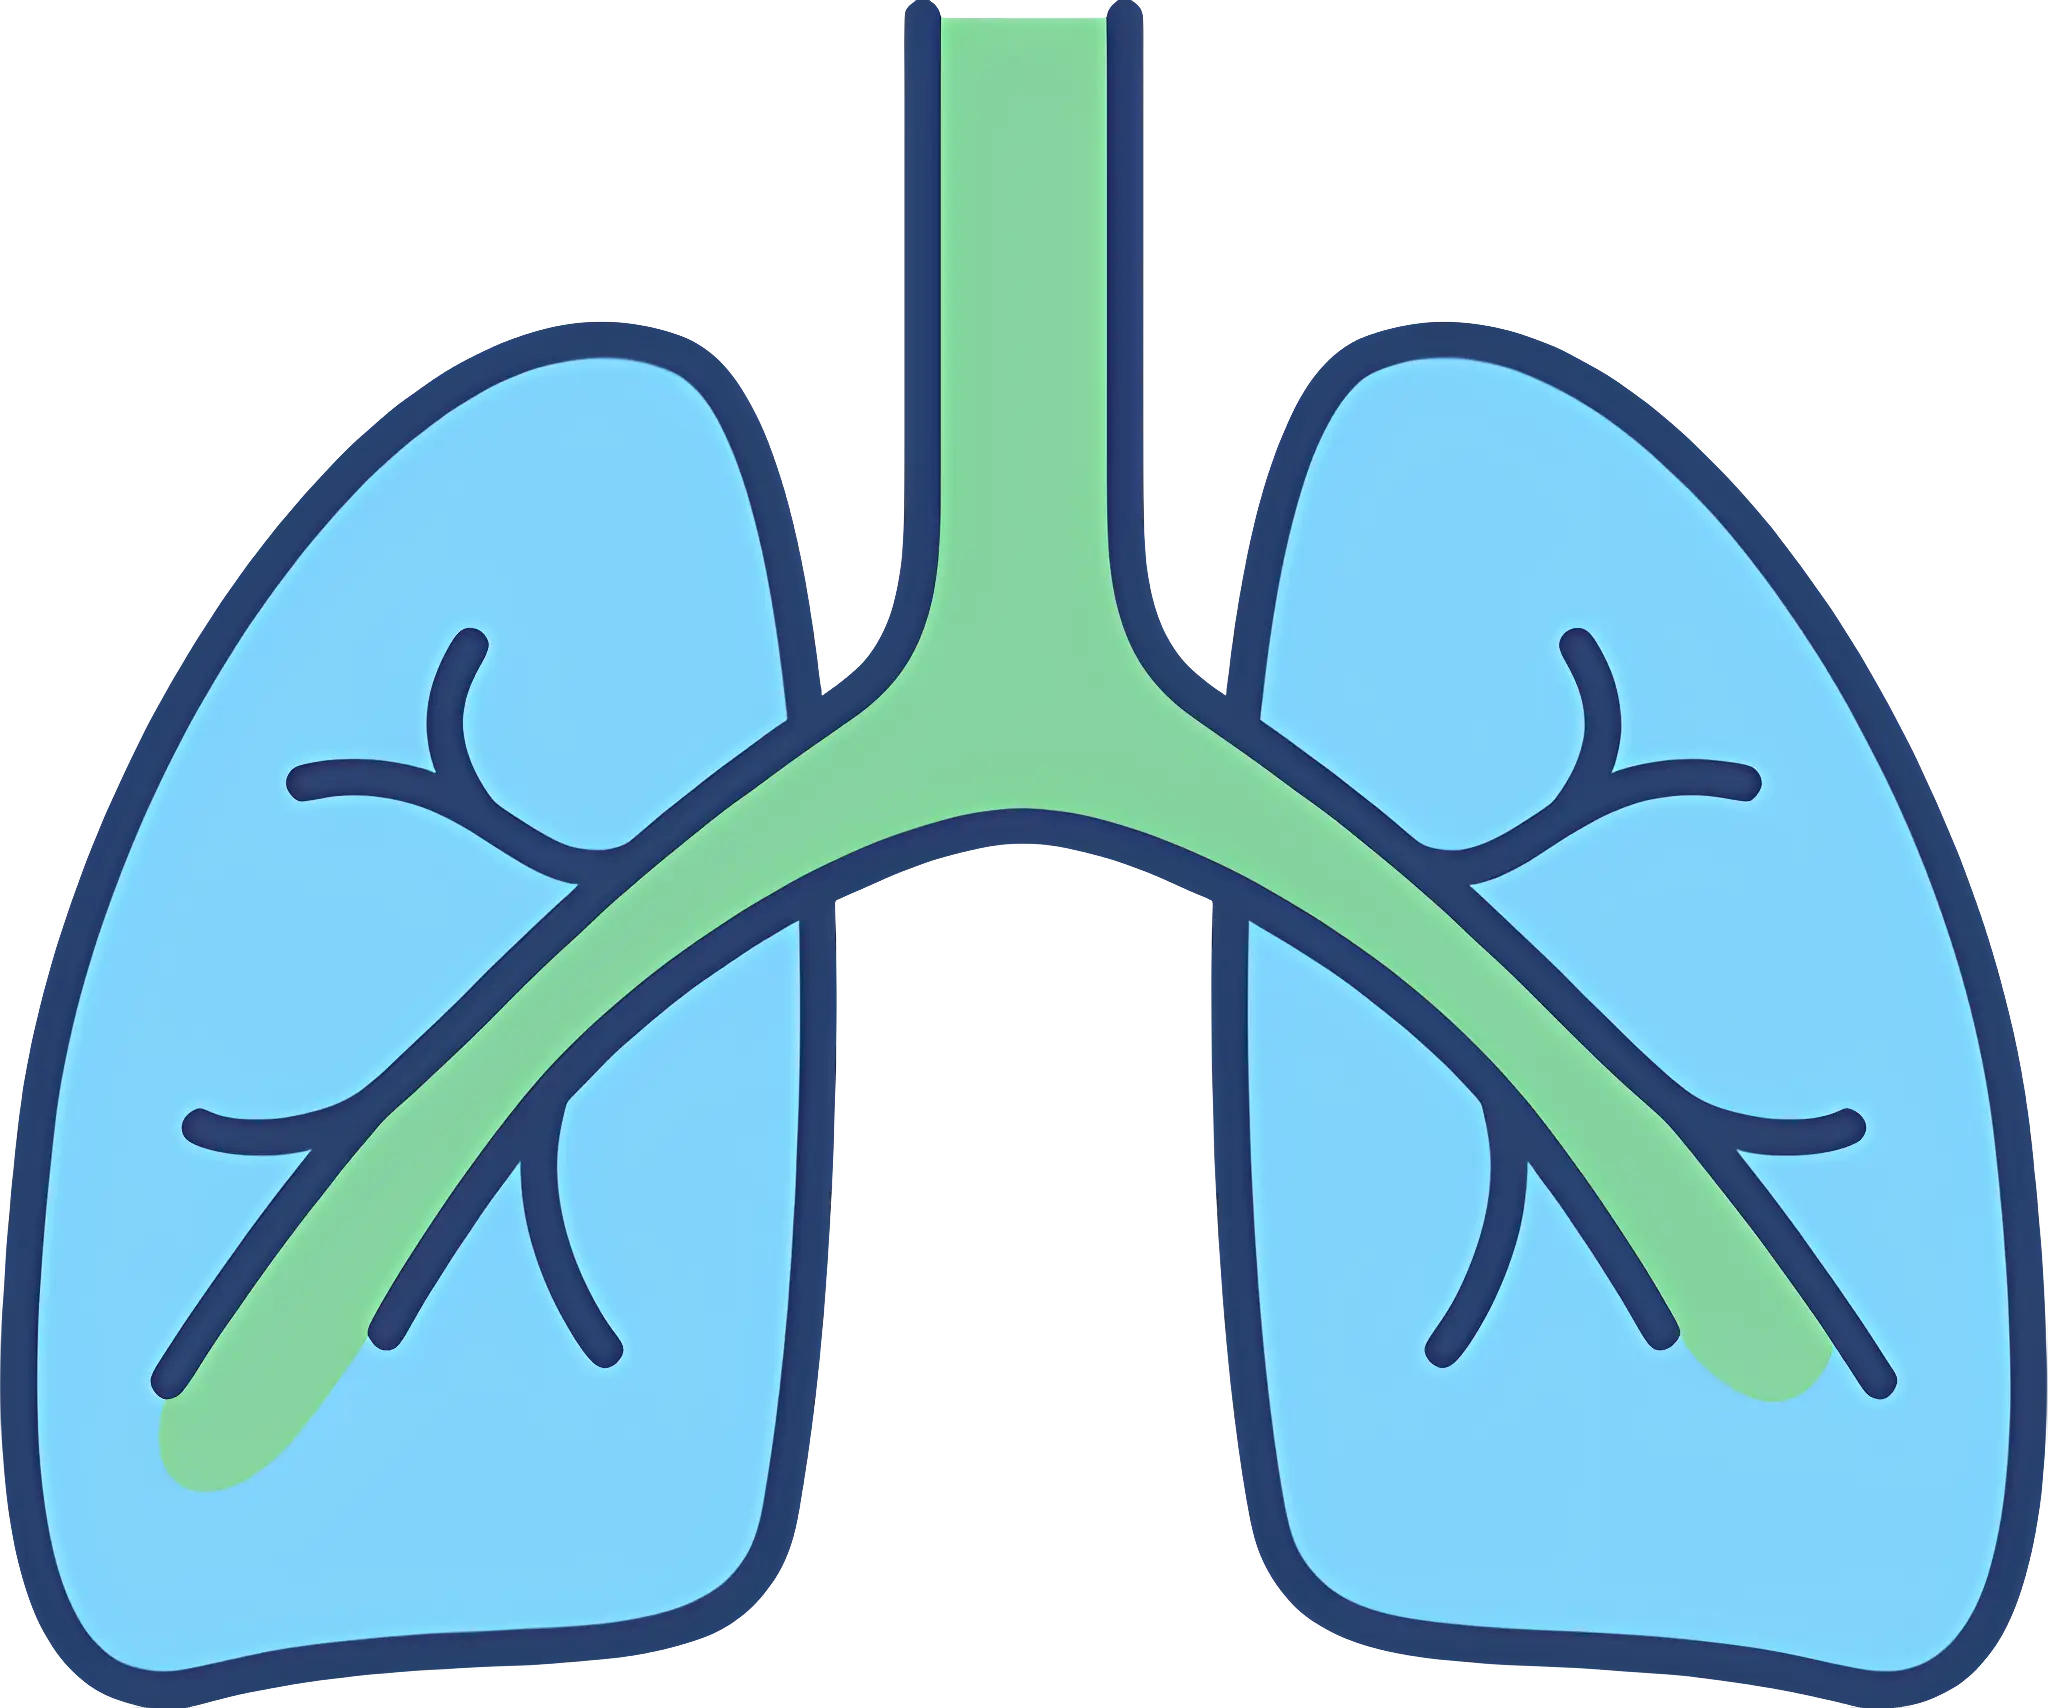
Medical Illustration of Human Lungs -
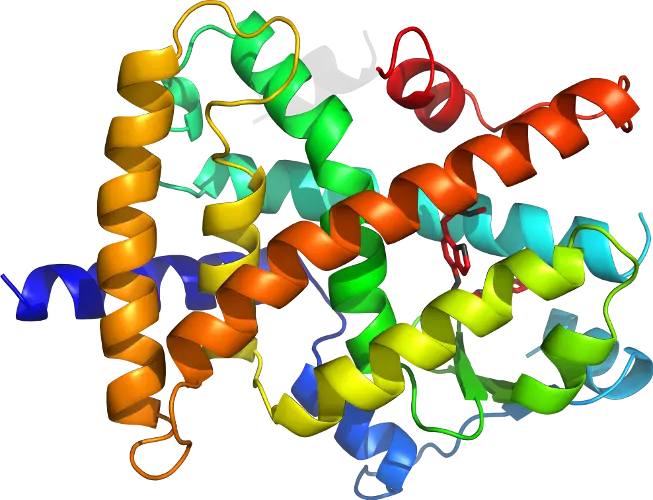
Protein Molecular Structure Model -
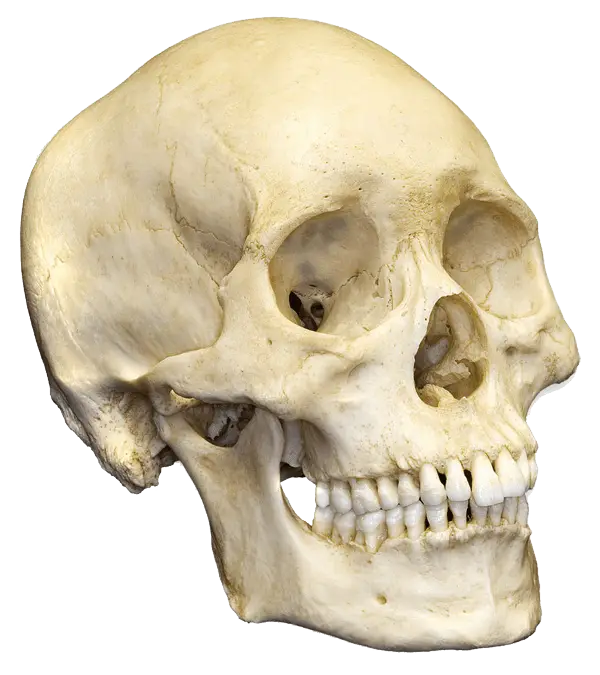
Human Skull Model for Anatomy Study -
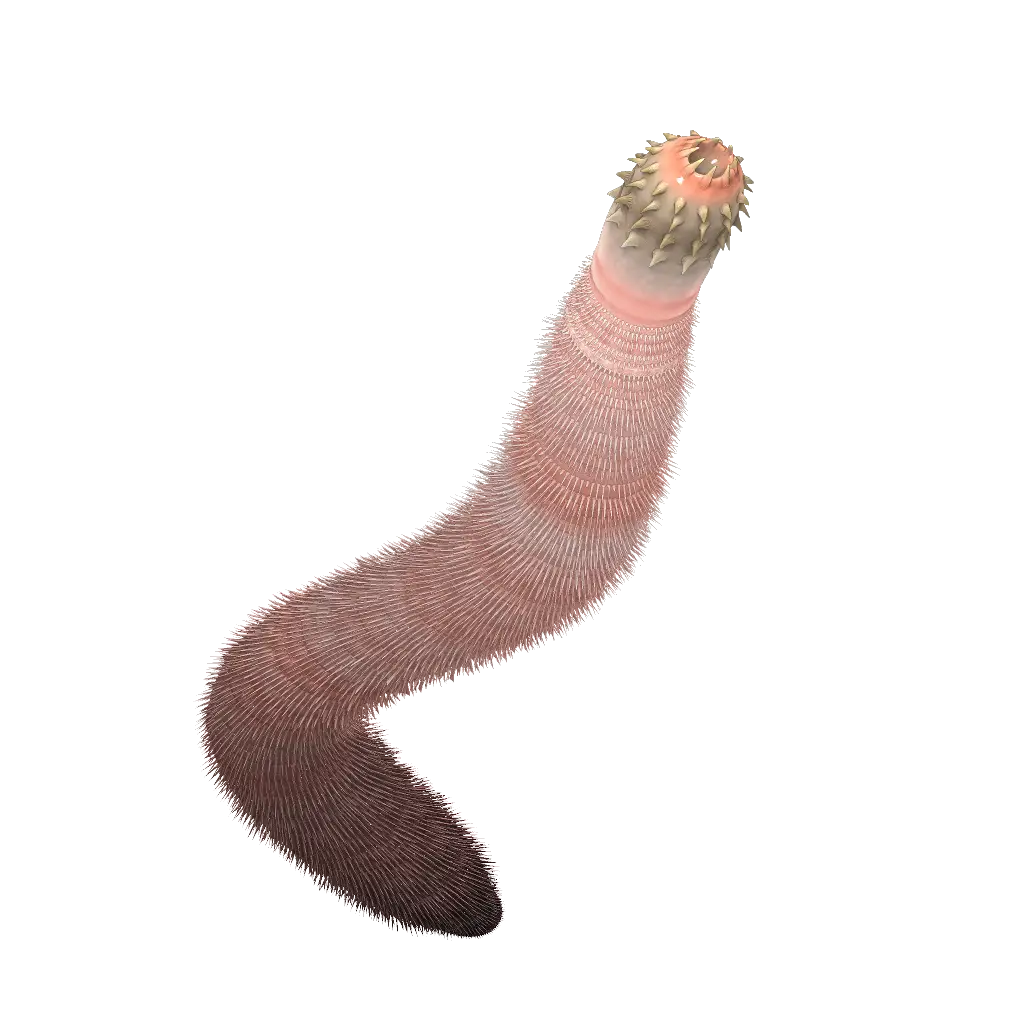
Illustration of a Worm -
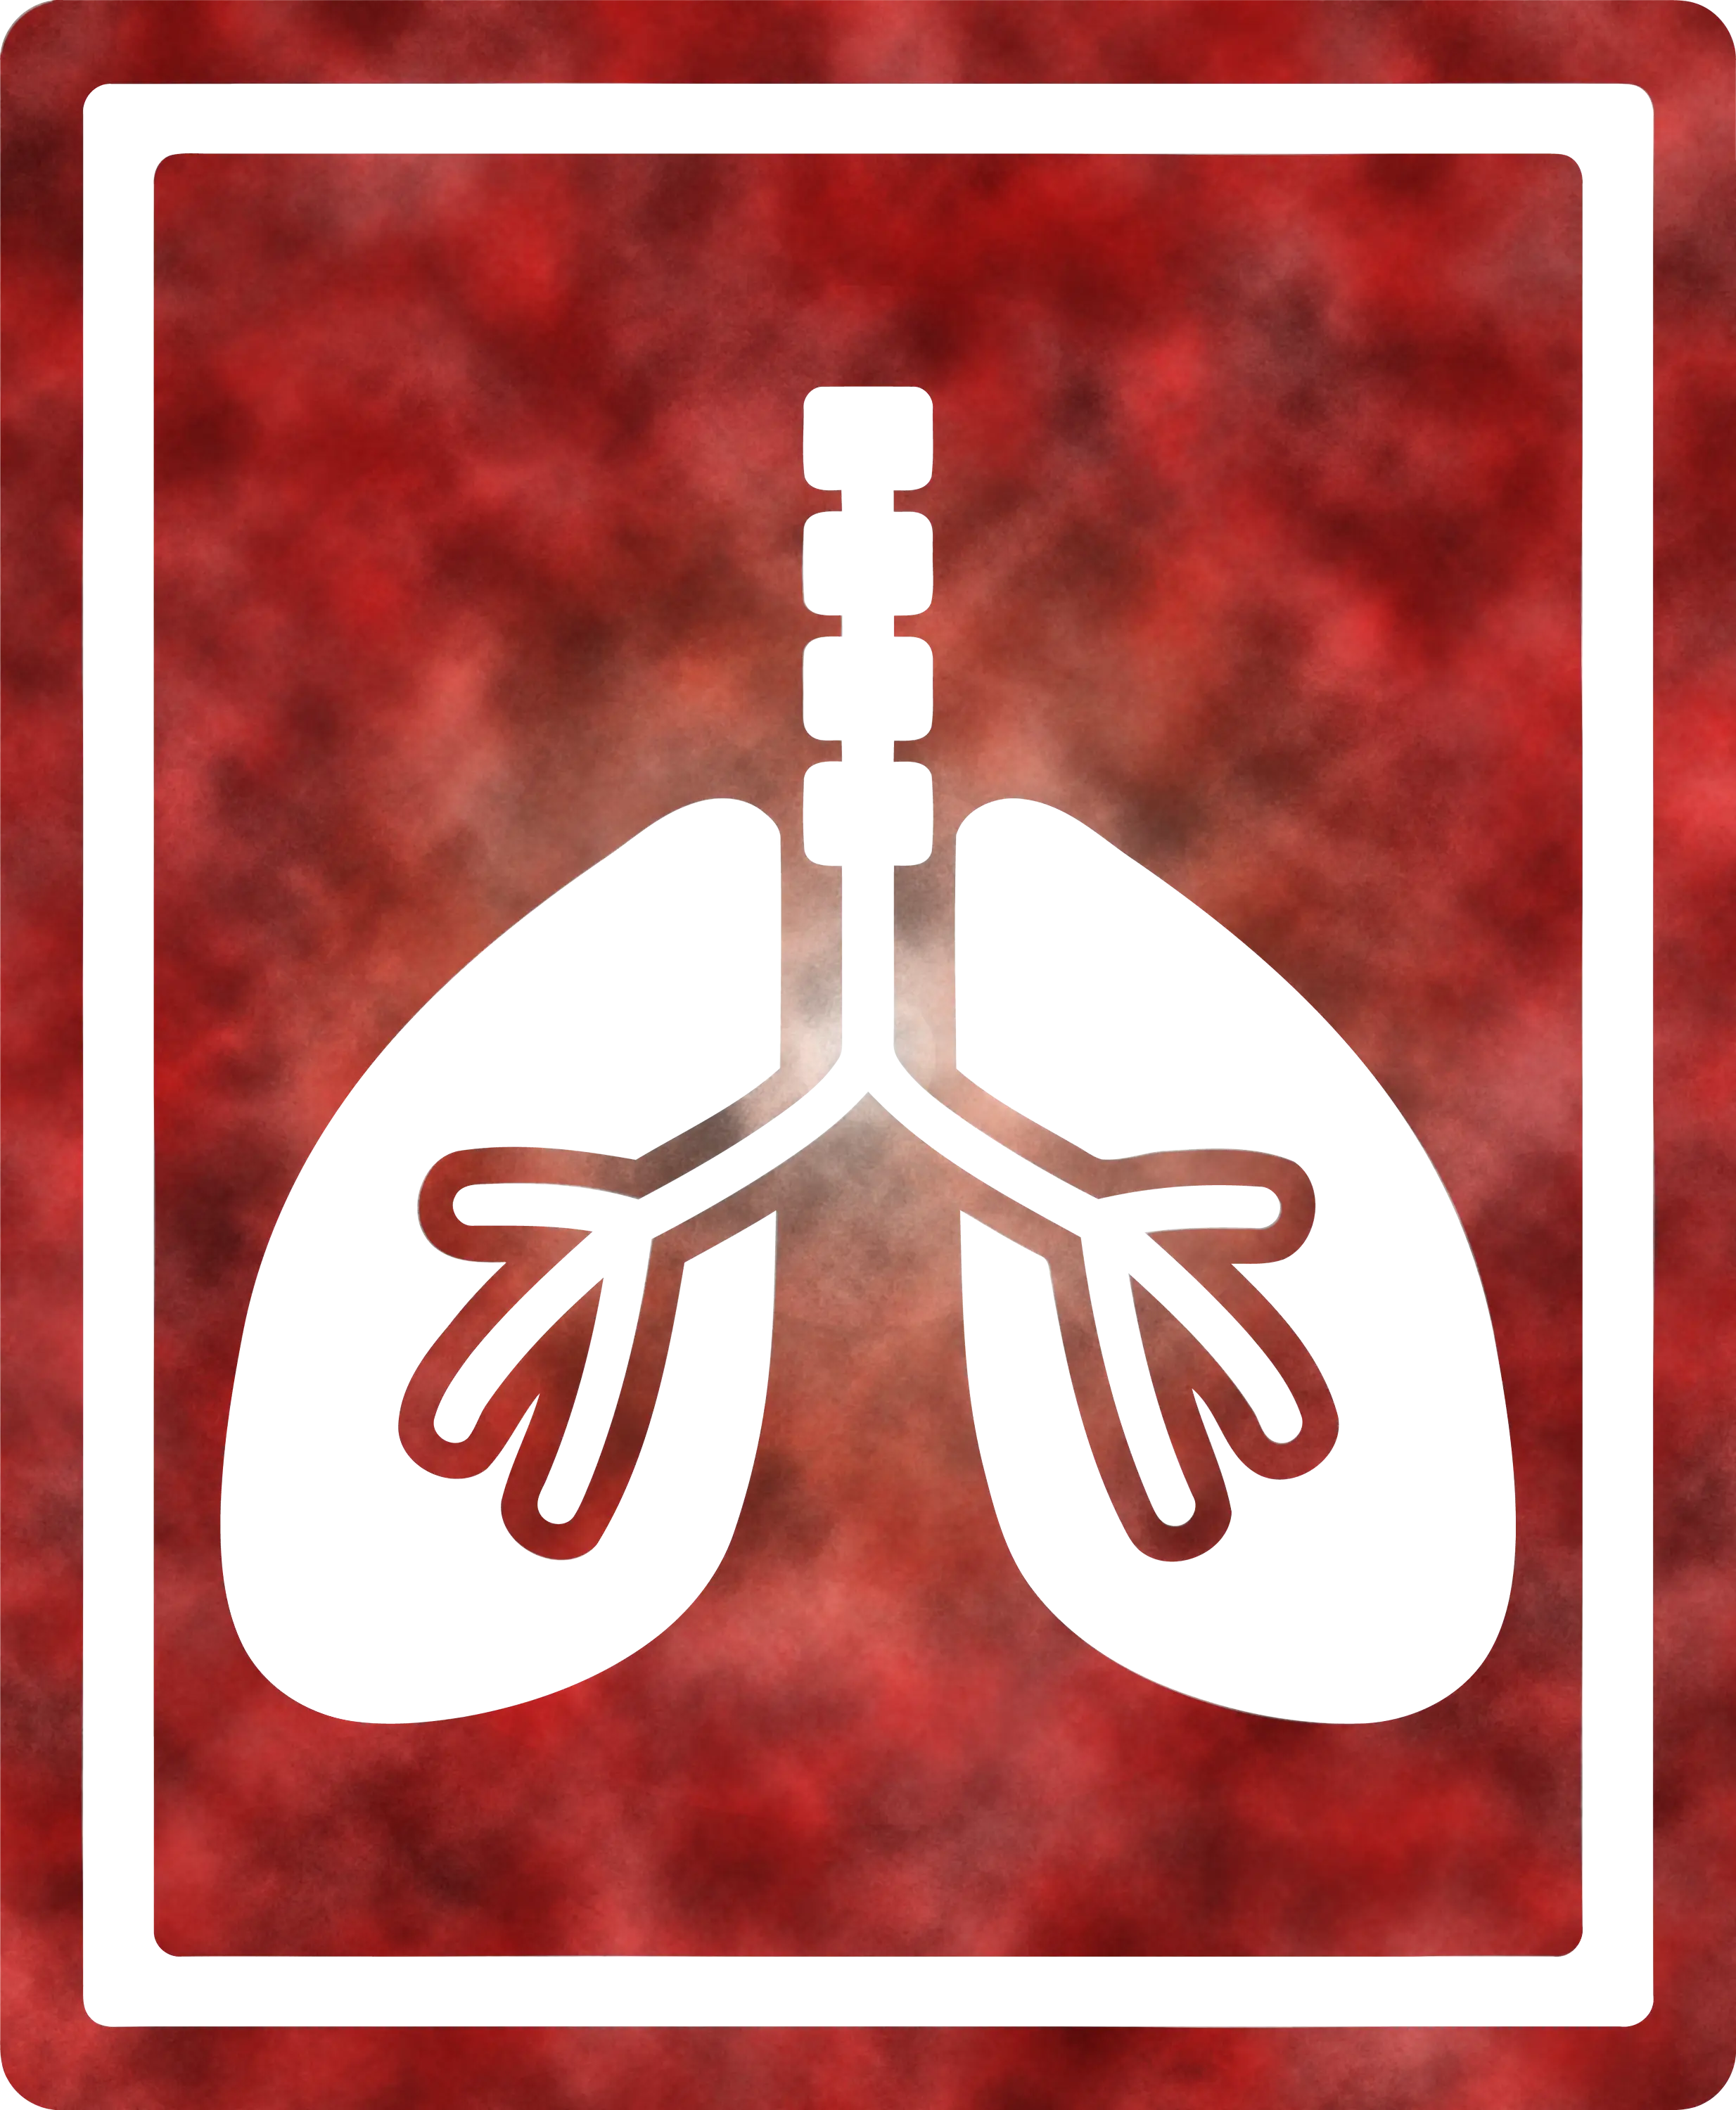
Lung Medical Illustration on Red Fog Background -
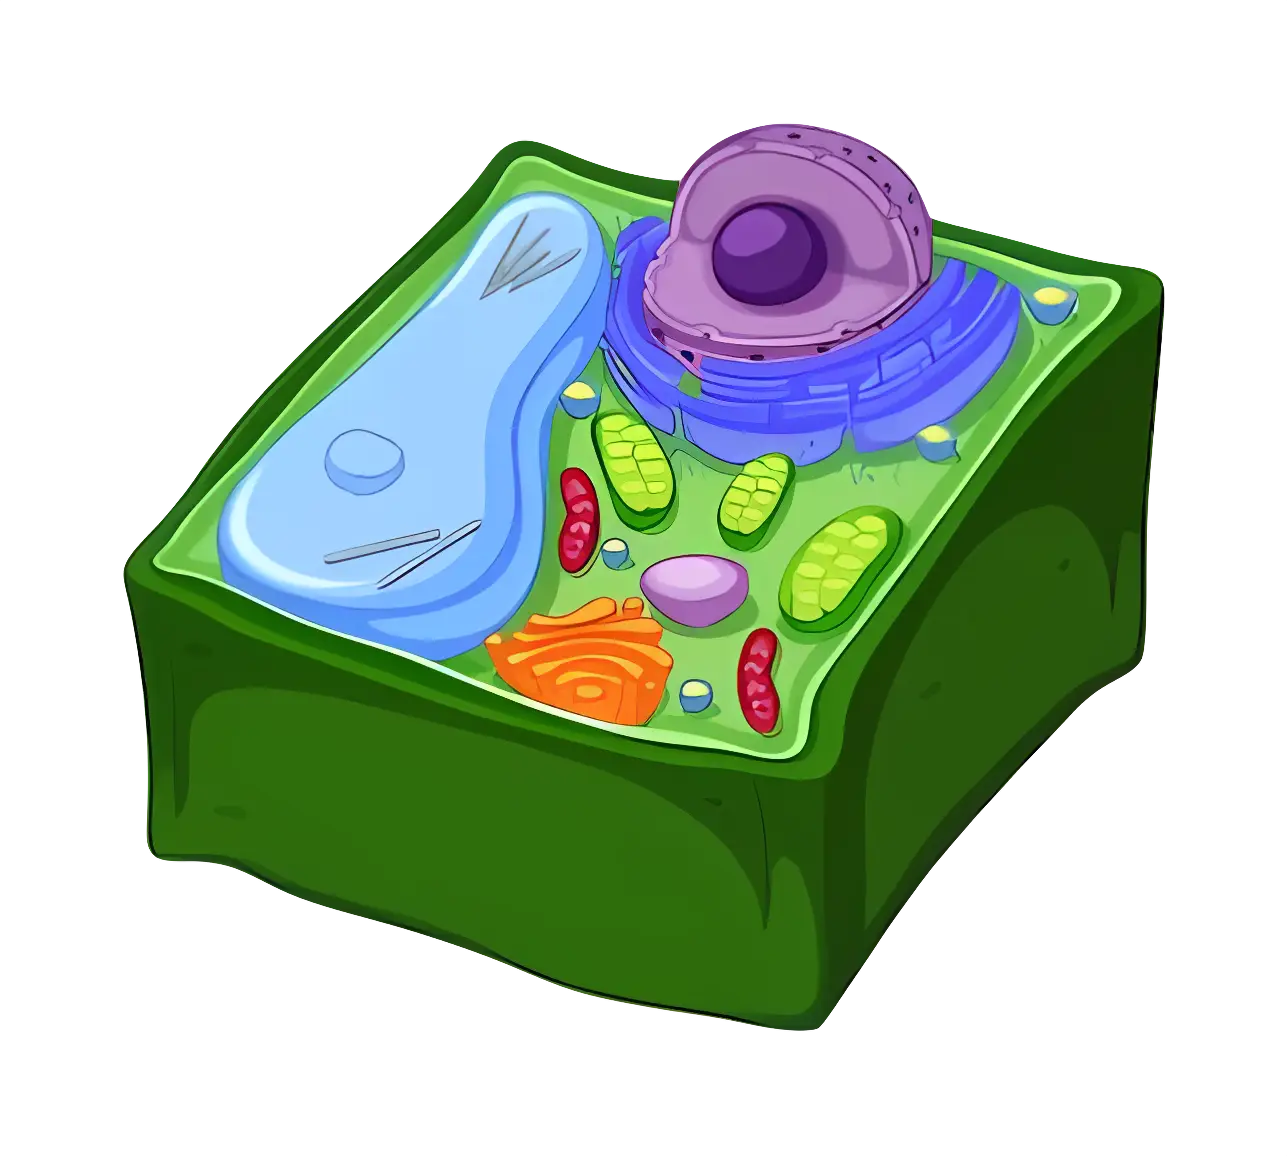
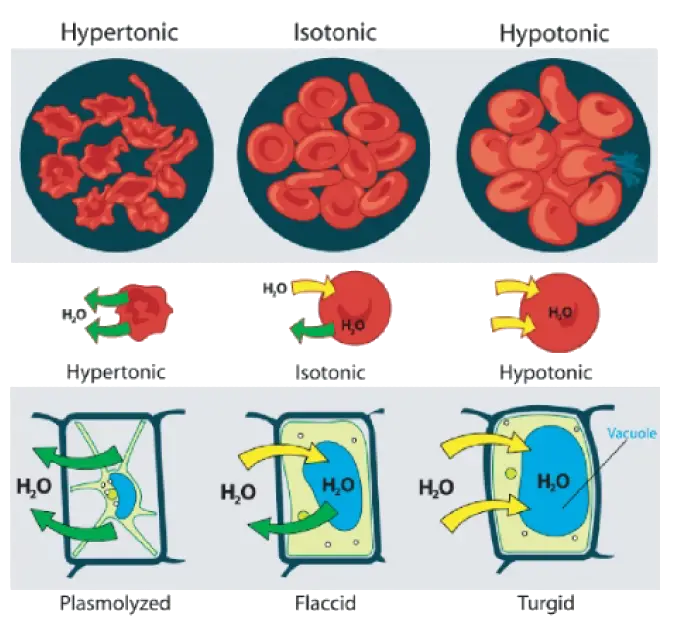
Plant Cell Diagram -

Hand-drawn DNA Stranded Illustration -

Virus Illustration -
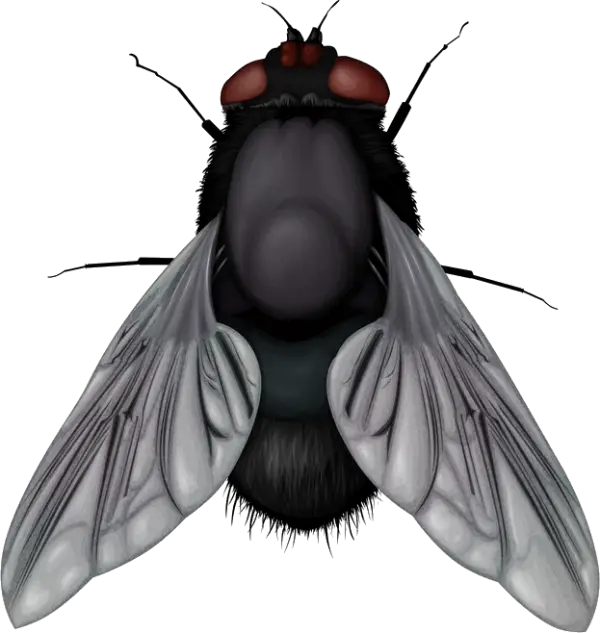
Detailed Housefly Illustration -

3D Protein Molecular Structure Illustration -

Horseshoe Crab -
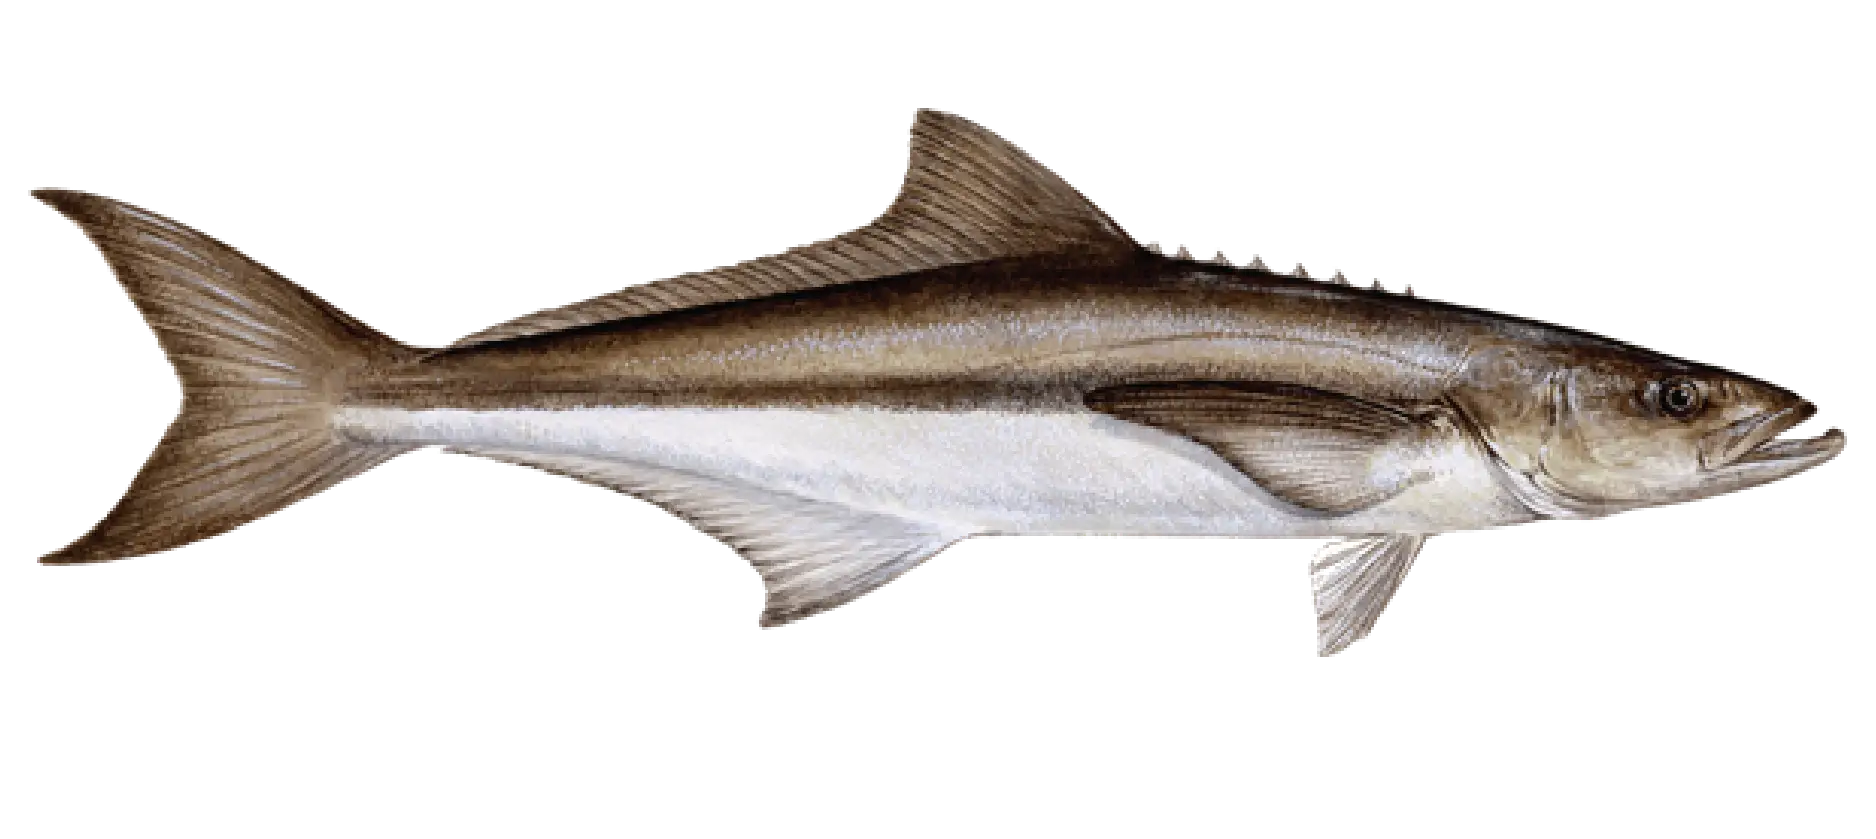
Cobia Fish Illustration for Marine Life Concept -
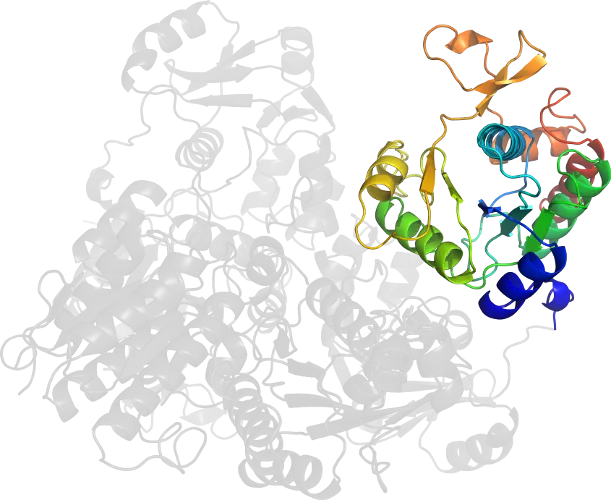
3D Protein Structure Illustration for Science -
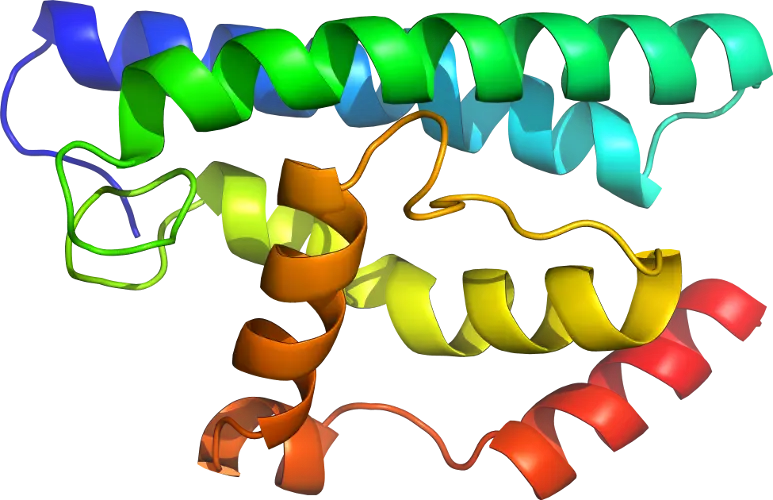
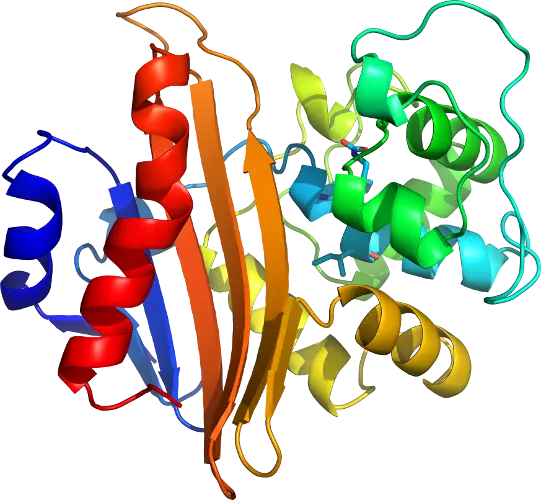
Colorful Protein Structure Illustration -
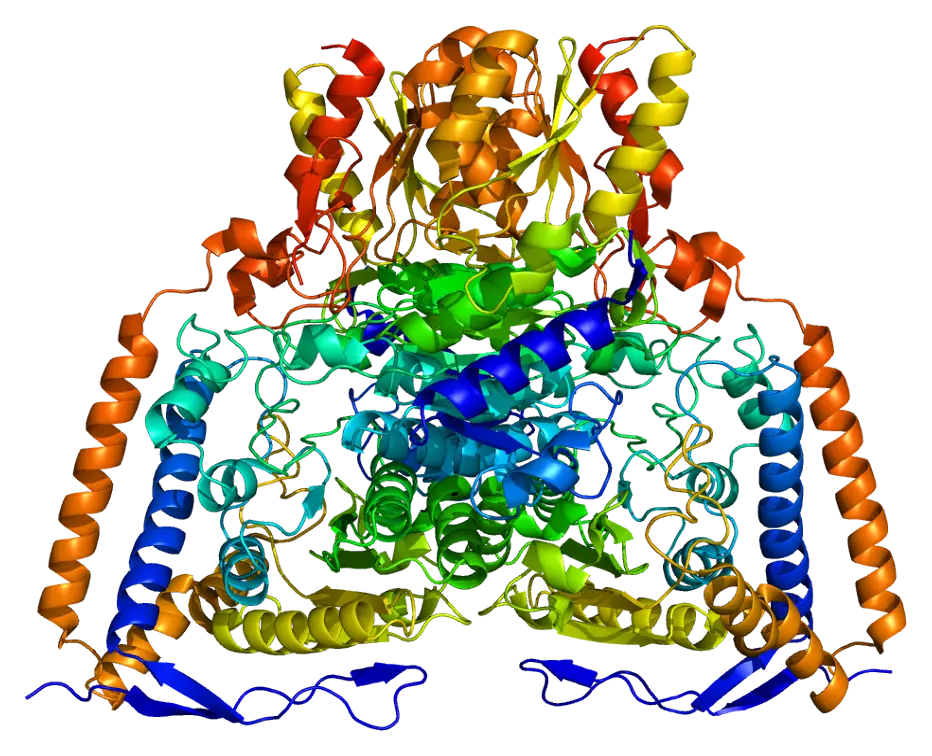
3D Representation of a Protein Structure -

Jail Bars Illustration -
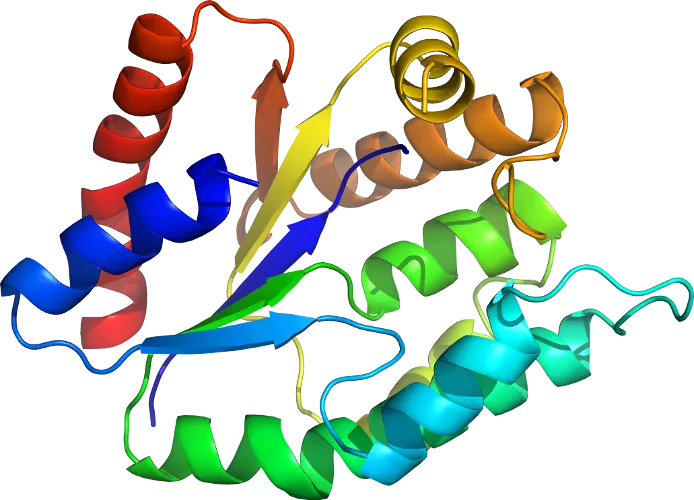
3D Illustration of a Colorful Protein Structure -

Colorful DNA Strand Illustration -
Colorful Science Icons in Hexagons -
3D Representation of Protein Structure -

Detailed Coral Illustration -
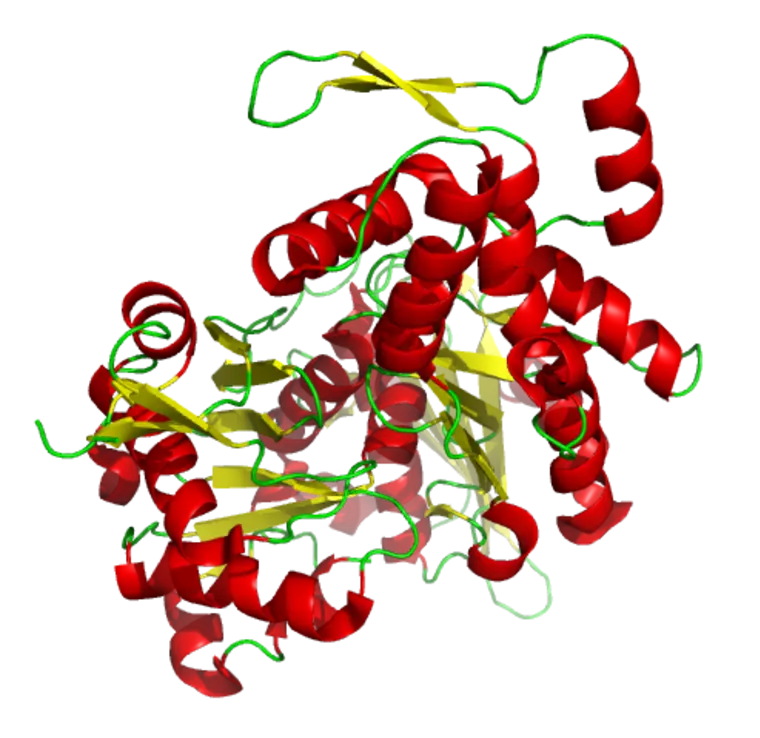
Protein Structure Scientific Illustration -

Double Helix DNA Strand Illustration -

Advanced Laboratory Machine with Screen