You Might Like
-

Cartoon Yeti Holding Ice Cream -
Evolution of Humanity Illustration -
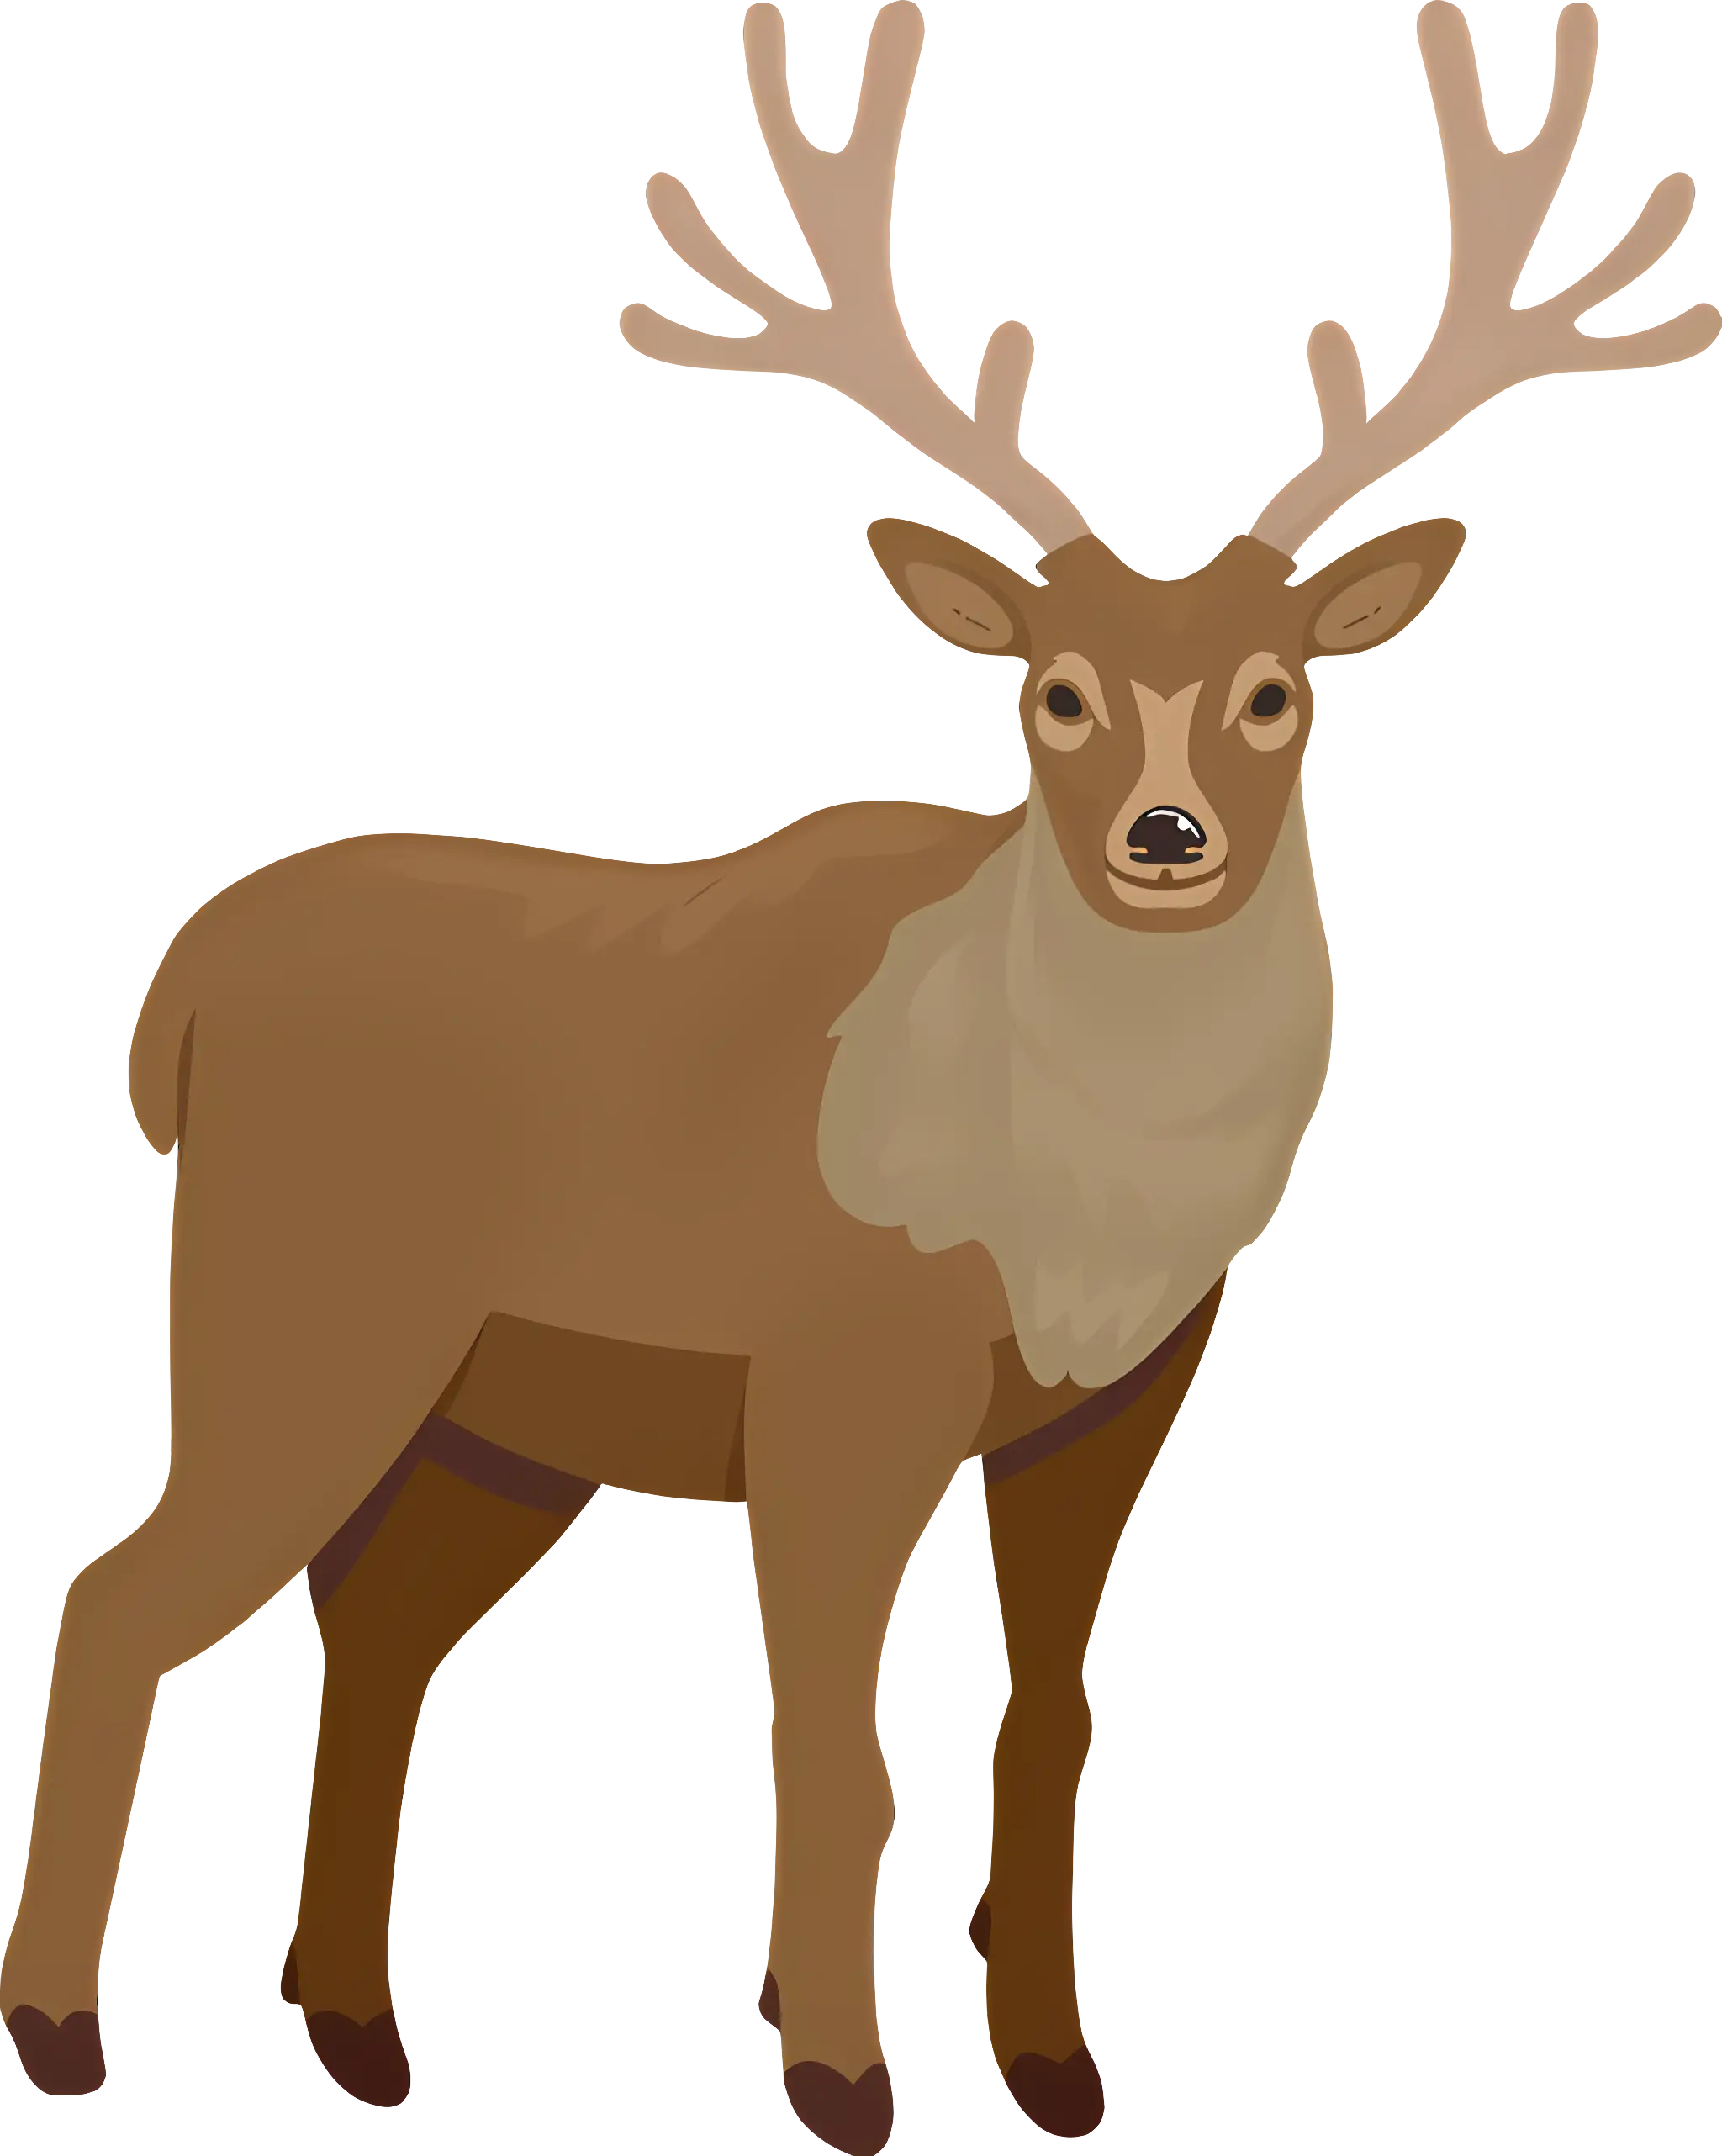
Illustration of Brown Deer with Antlers -

Side View of Silver Sedan Car -
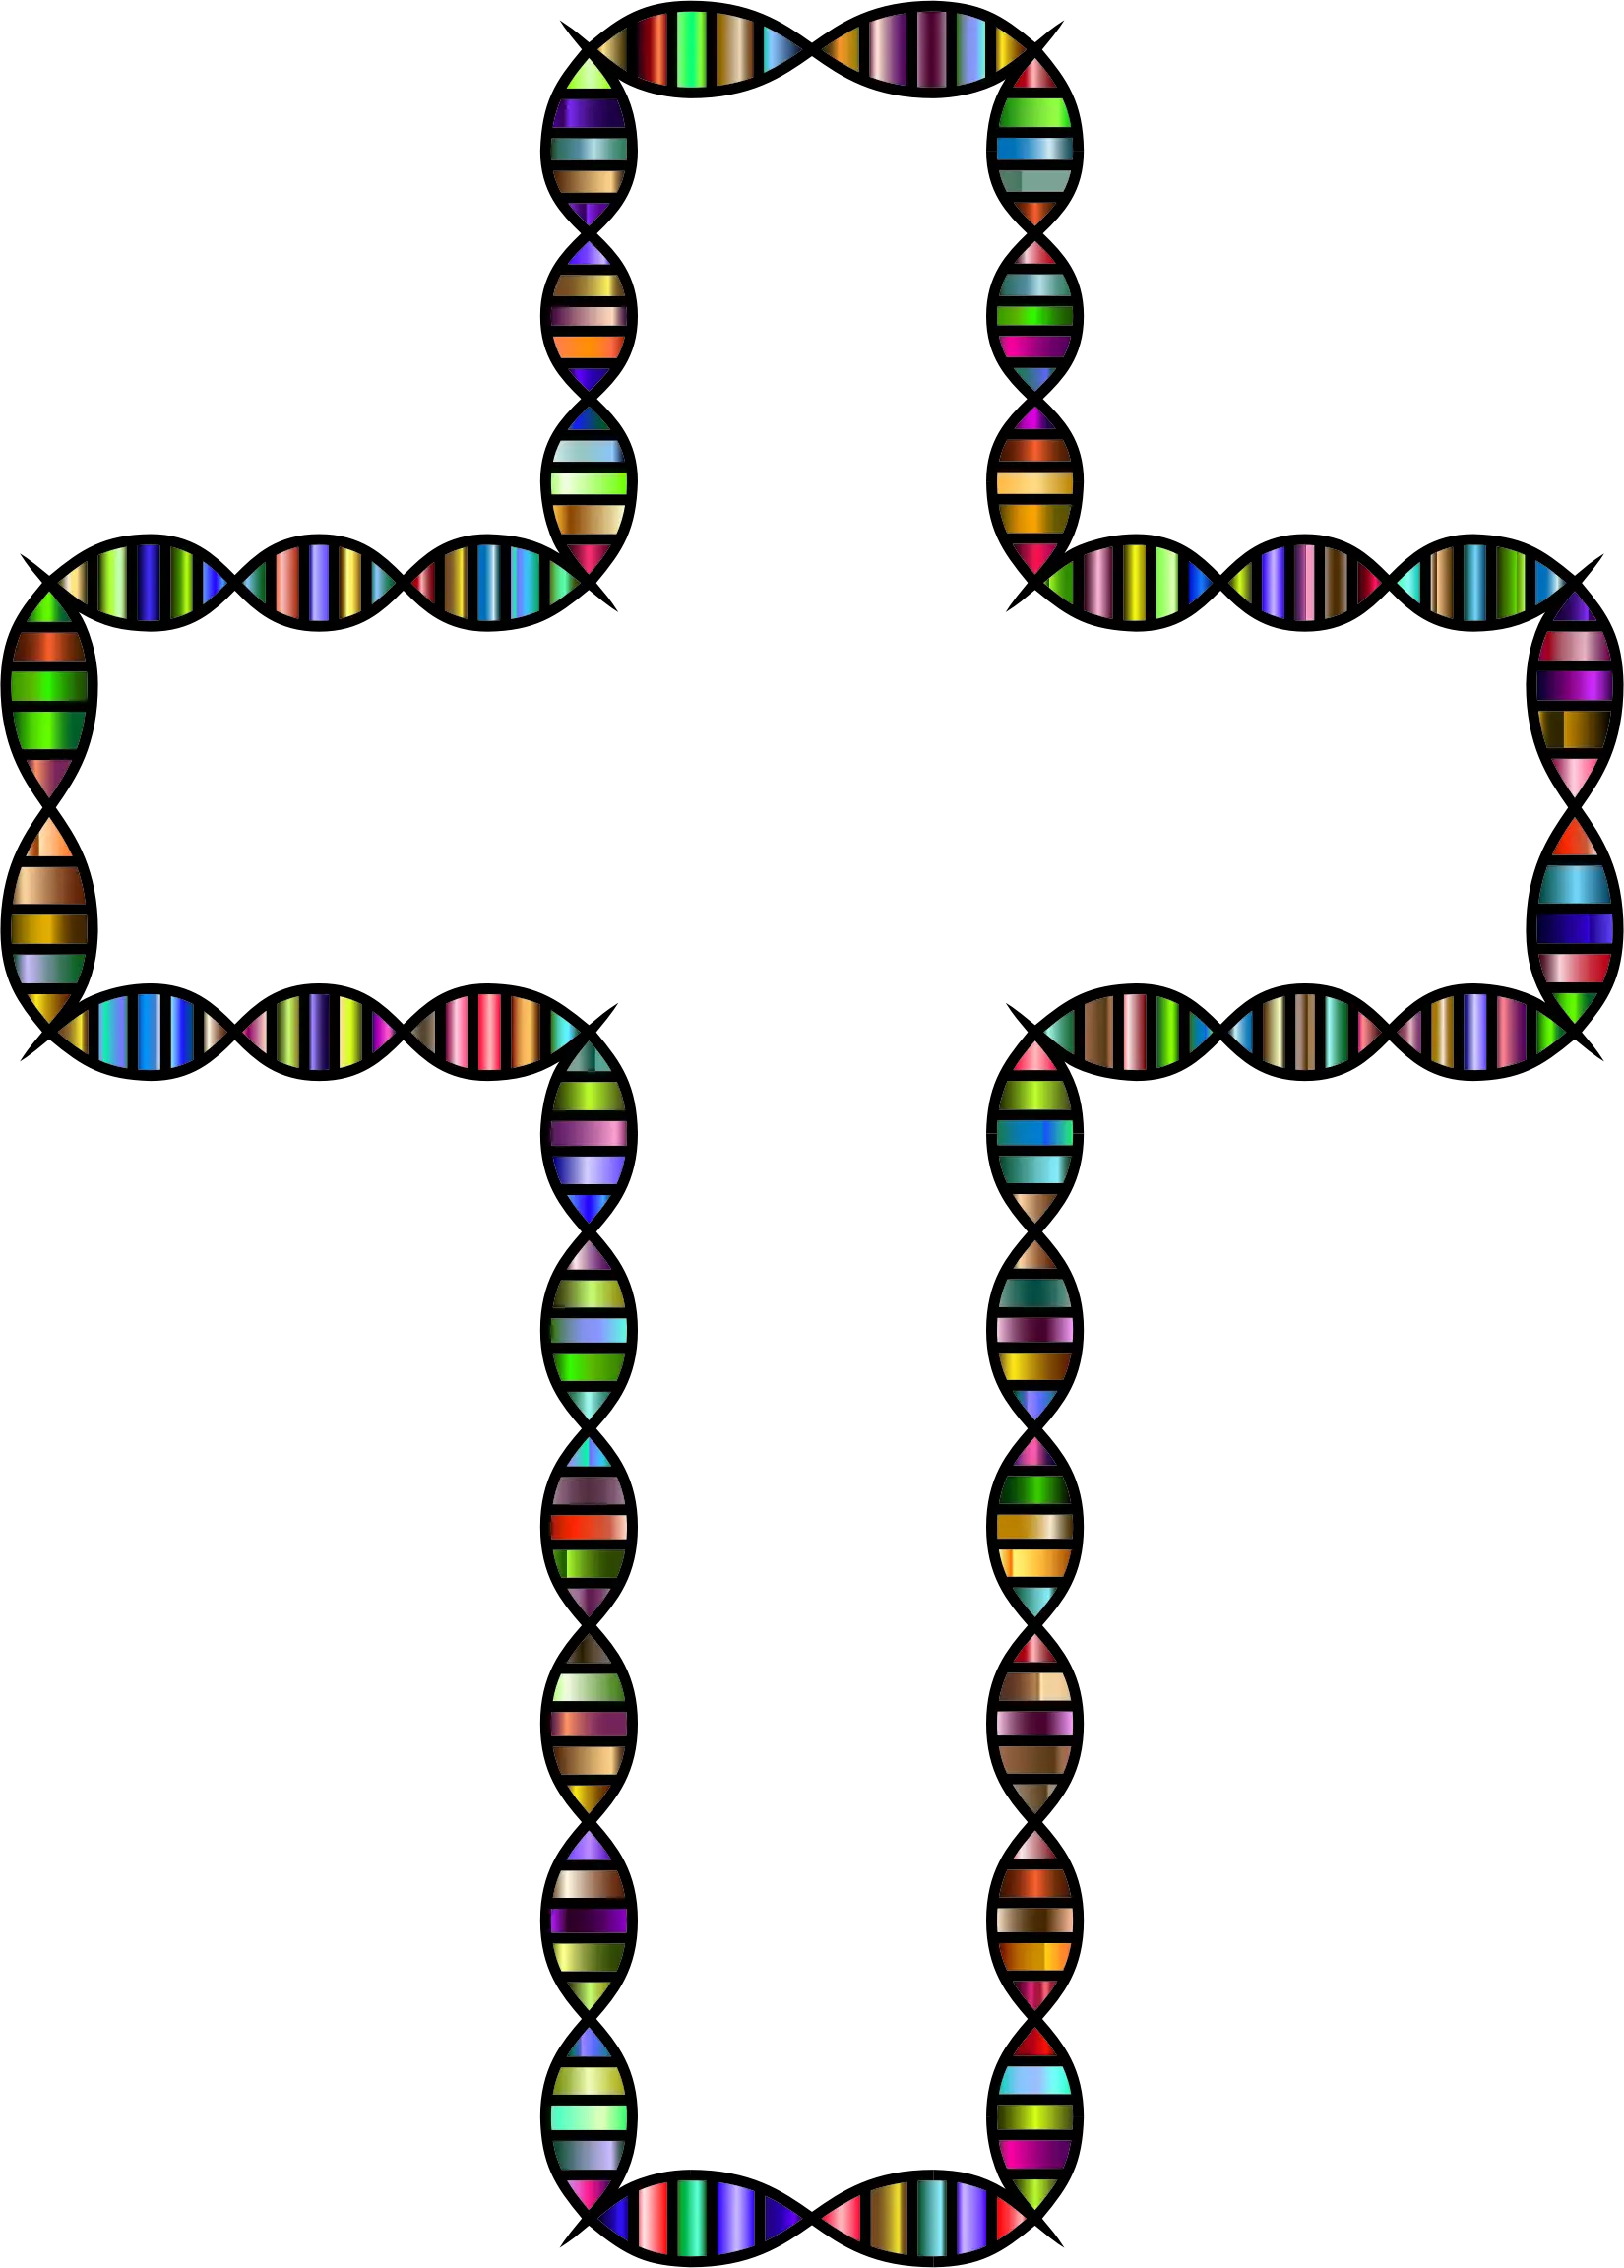
Cross Made of DNA Strands -

Timeline Infographic Design -
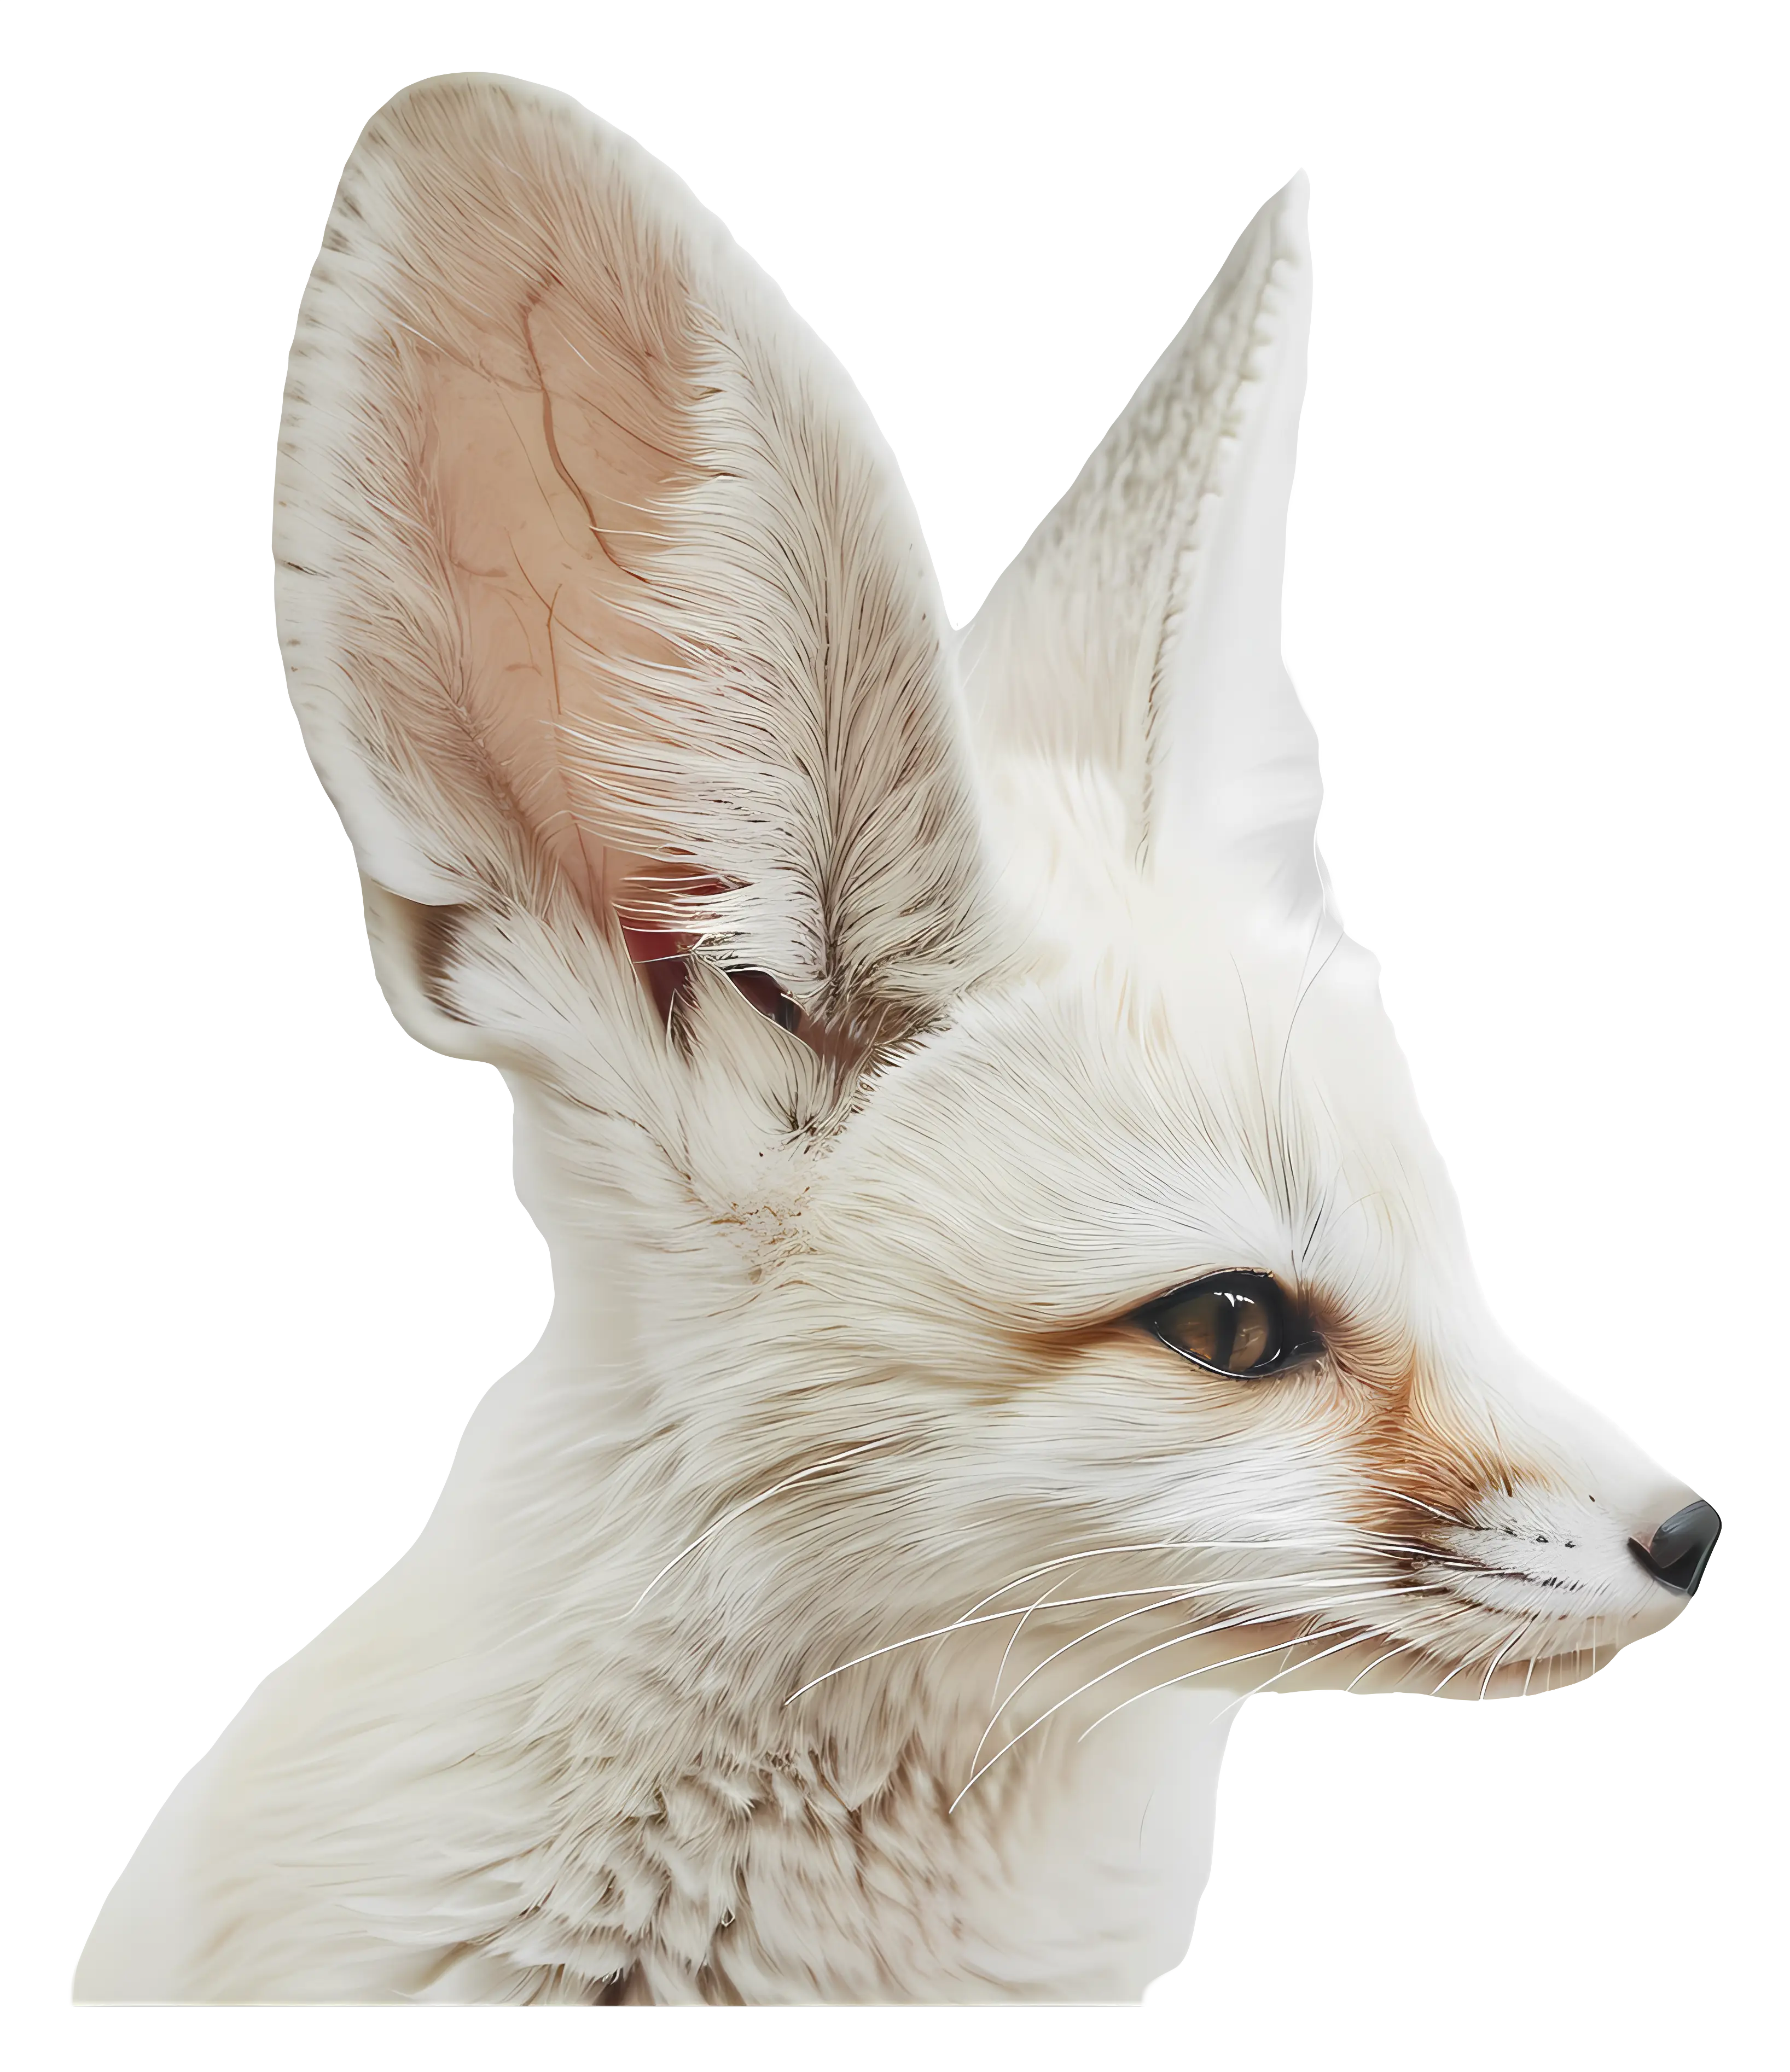
Profile of a Fennec Fox -
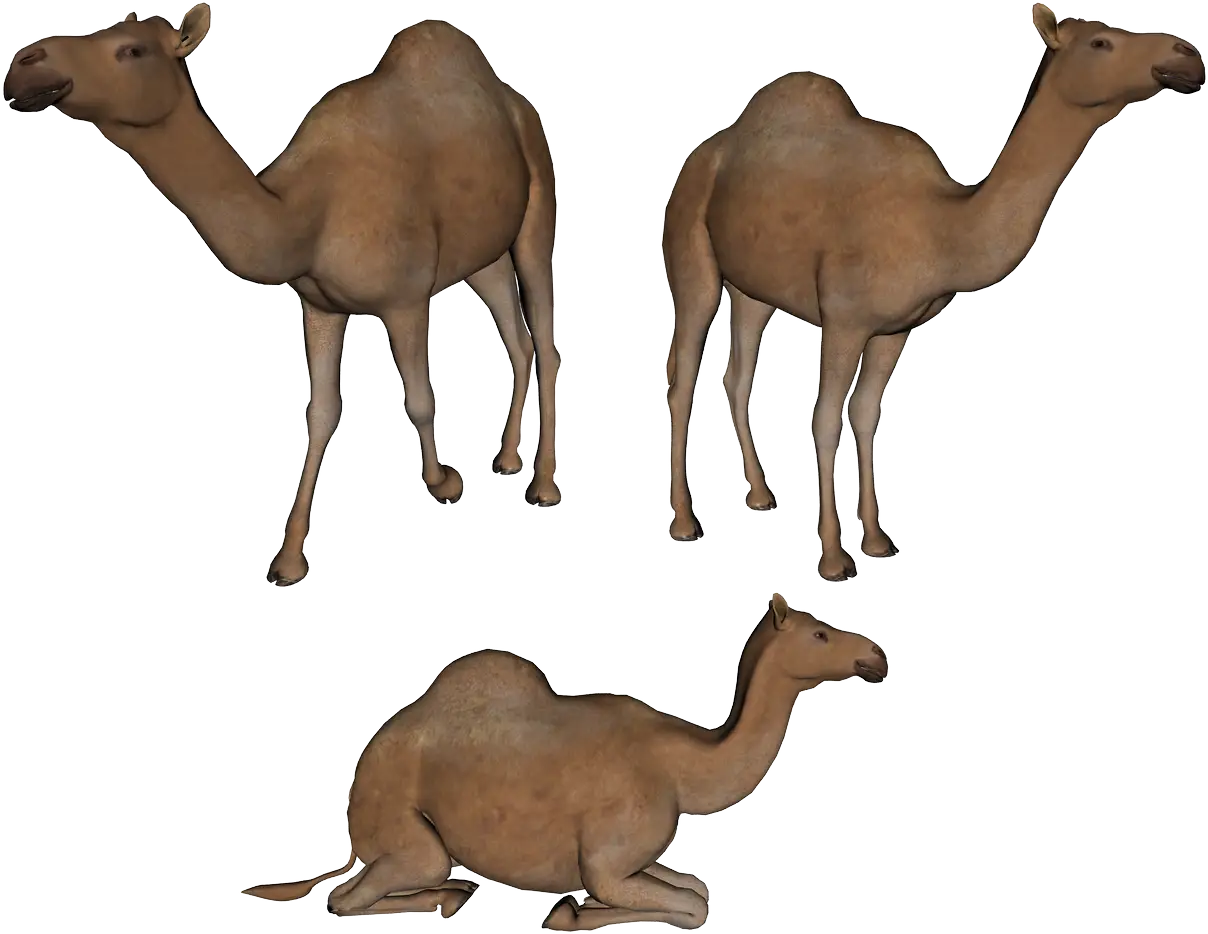
Group of Desert Camels -

Hand-drawn DNA Stranded Illustration -
Colorful DNA Strand Illustration -
White Yeti Portable Cooler -
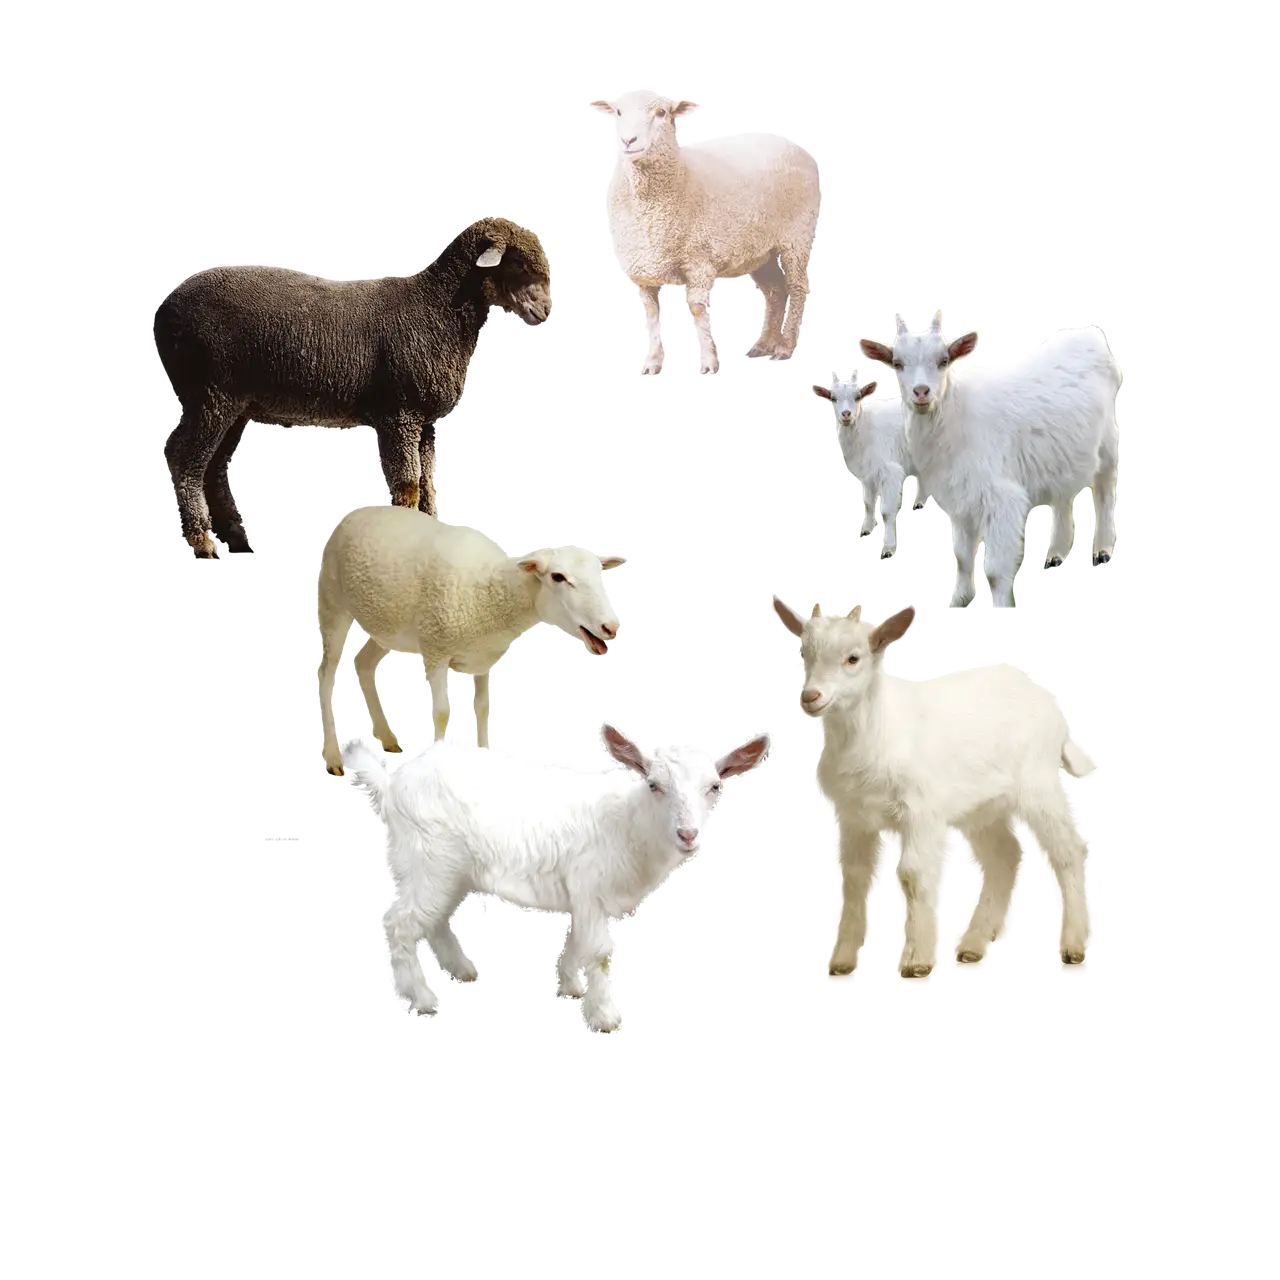
Various Sheep and Goats in a Group -

Fantasy Cartoon Creature -
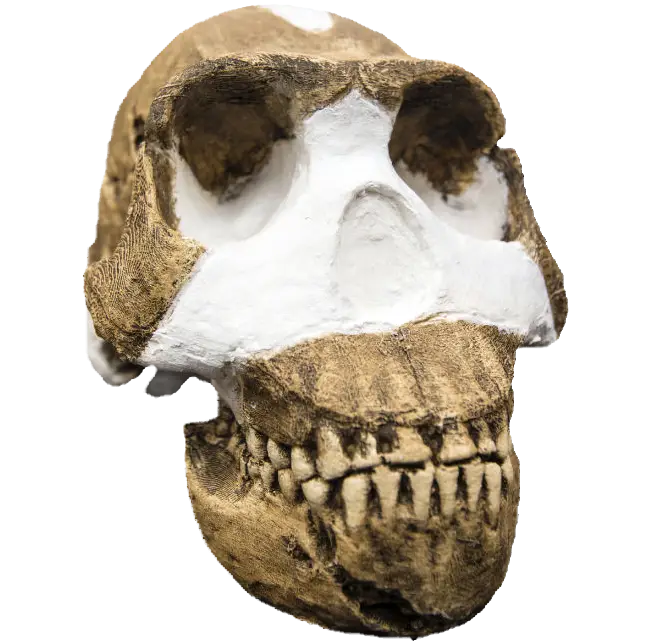
Fossilized Prehistoric Skull for Study -

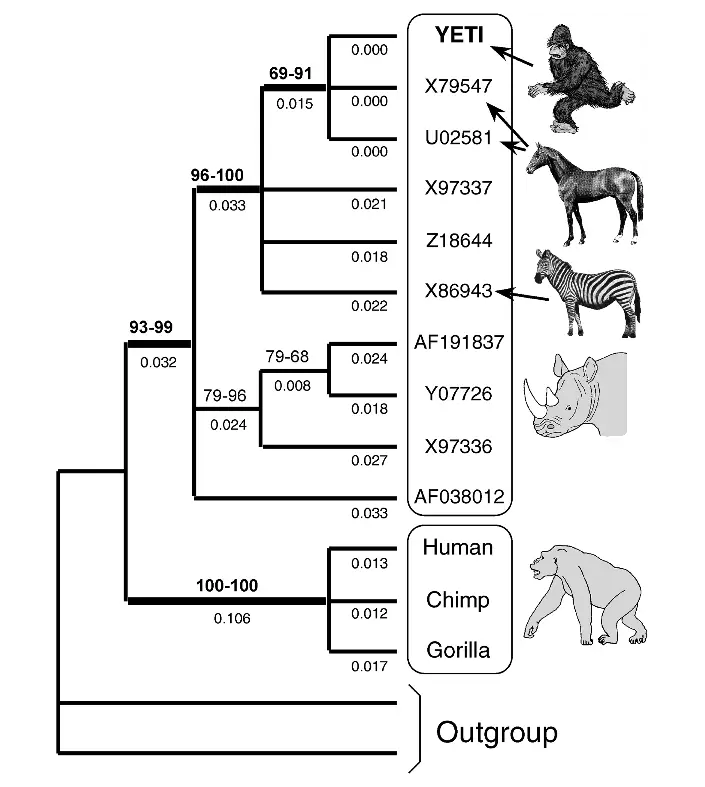
Diagram of Human Evolutionary Tree -

Double Helix DNA Strand Illustration -
Hello My Name is Change Tag -
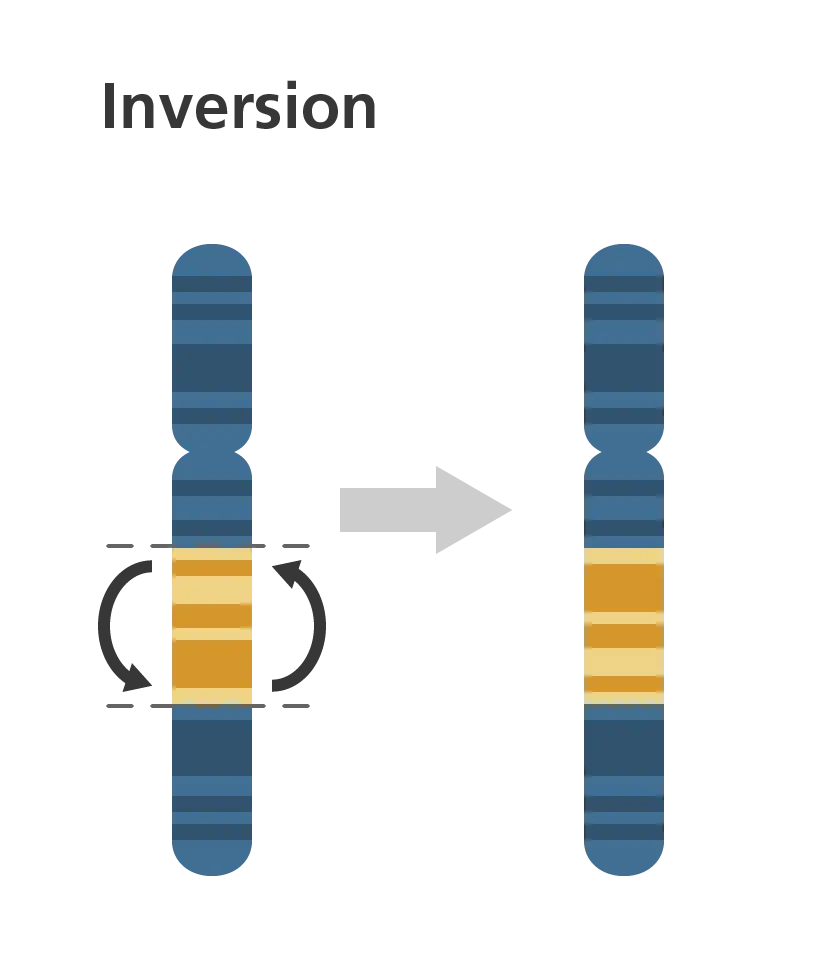
Chromosome Inversion Diagram -
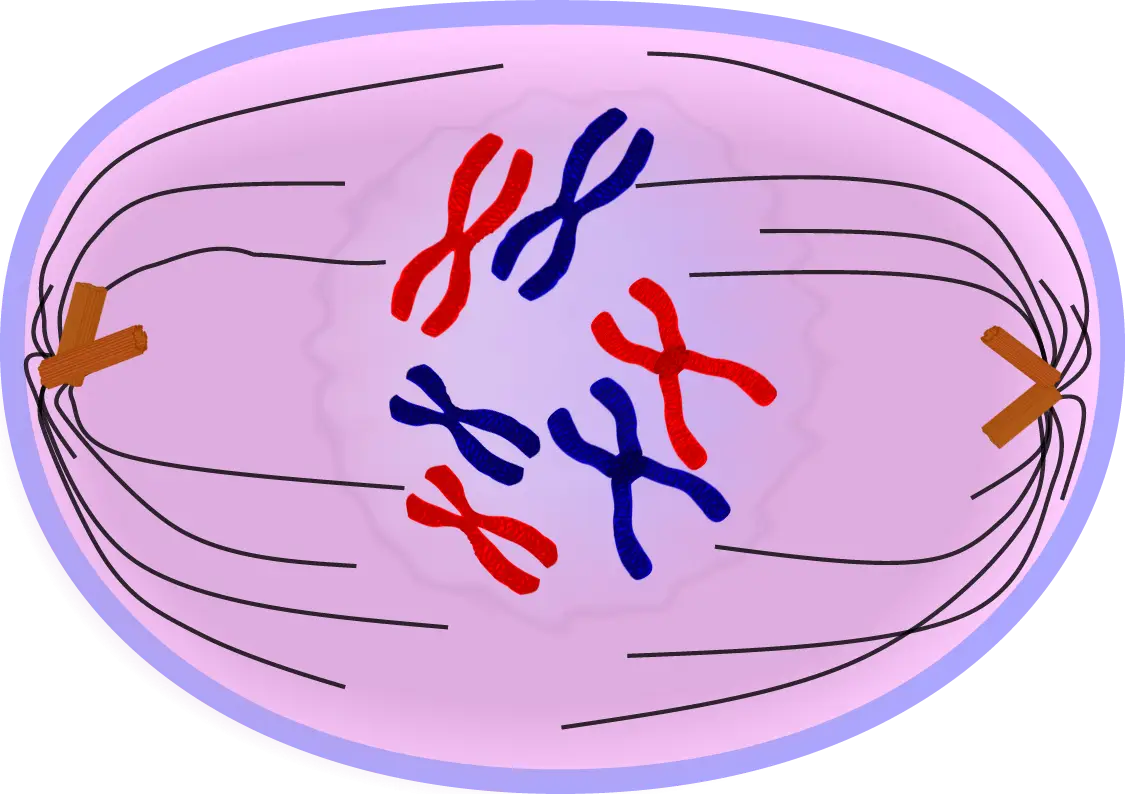
Chromosomes in Cell Division Illustration -
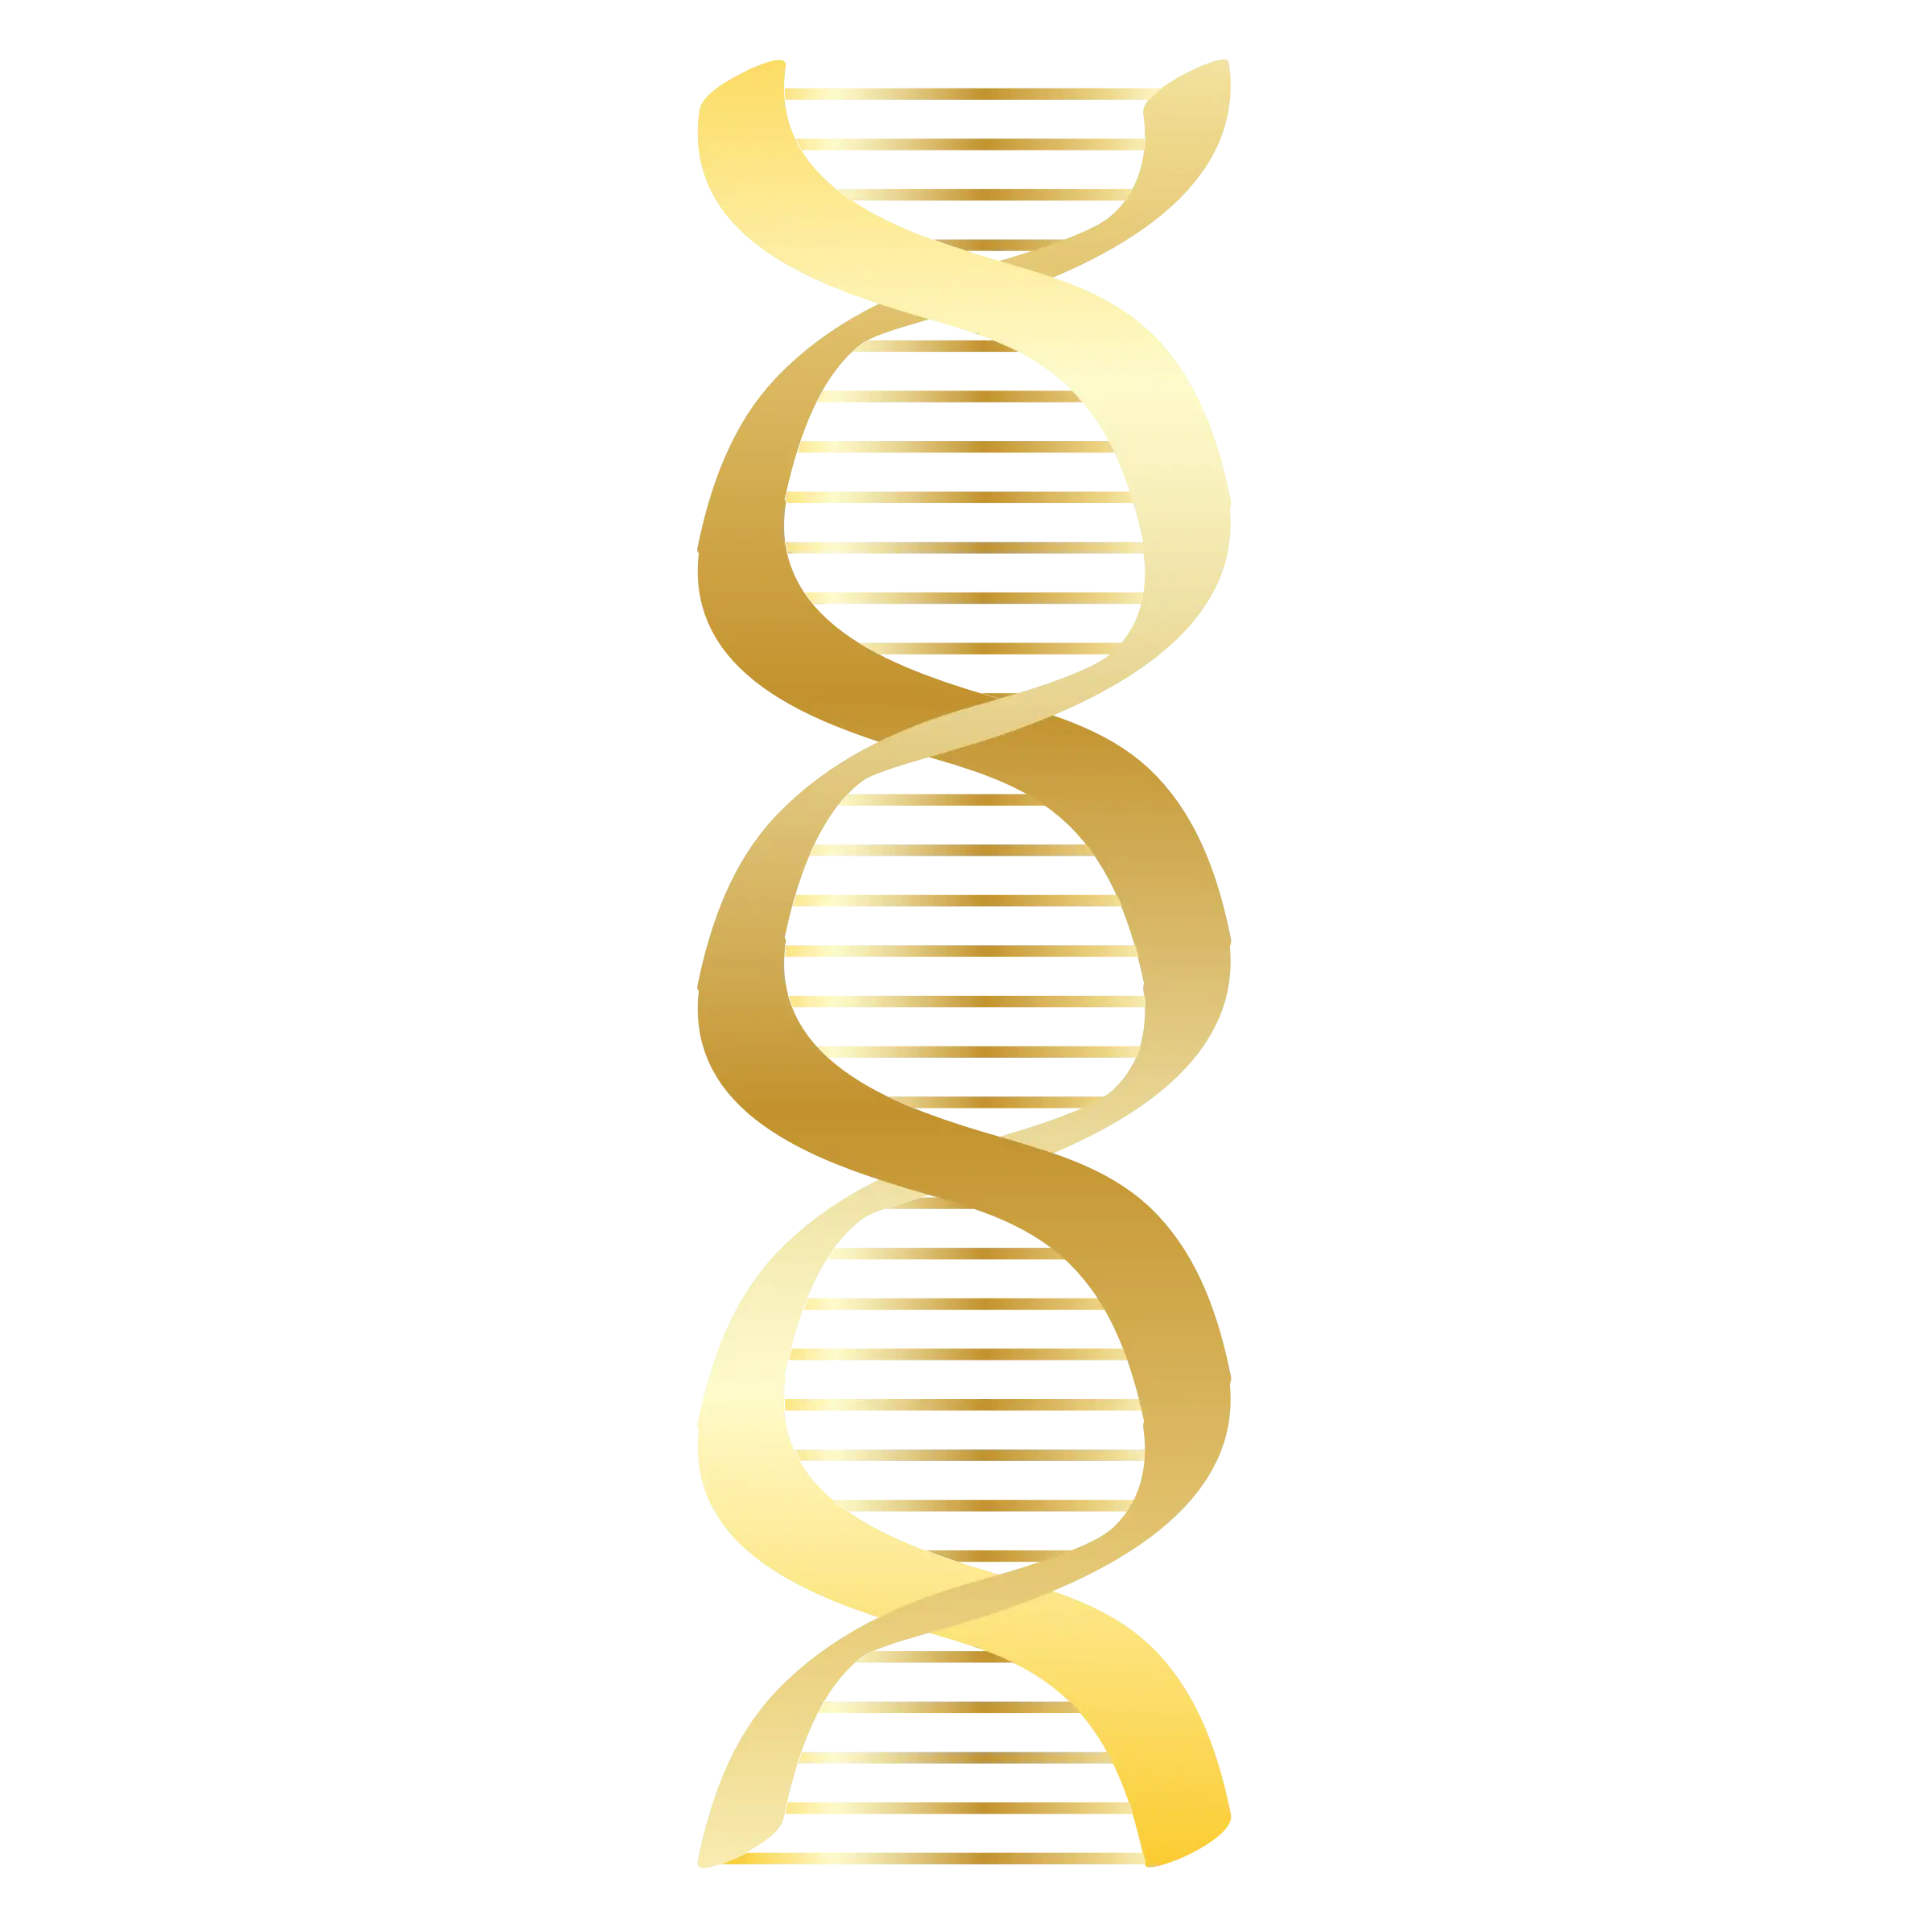
Golden DNA Helix Model for Science and Decoration -
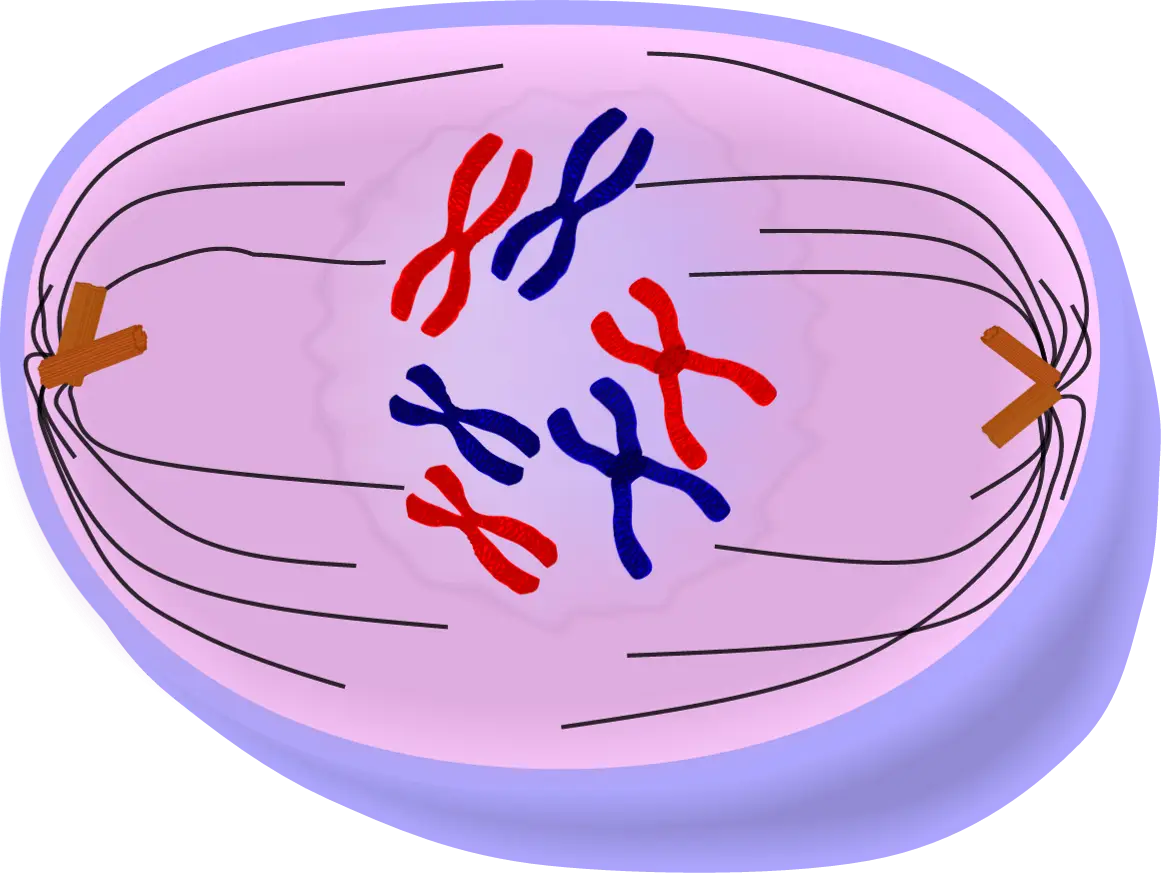
Illustration of Cell Division Showing Chromosomes -

Diagram of Induced and Spontaneous Mutations -

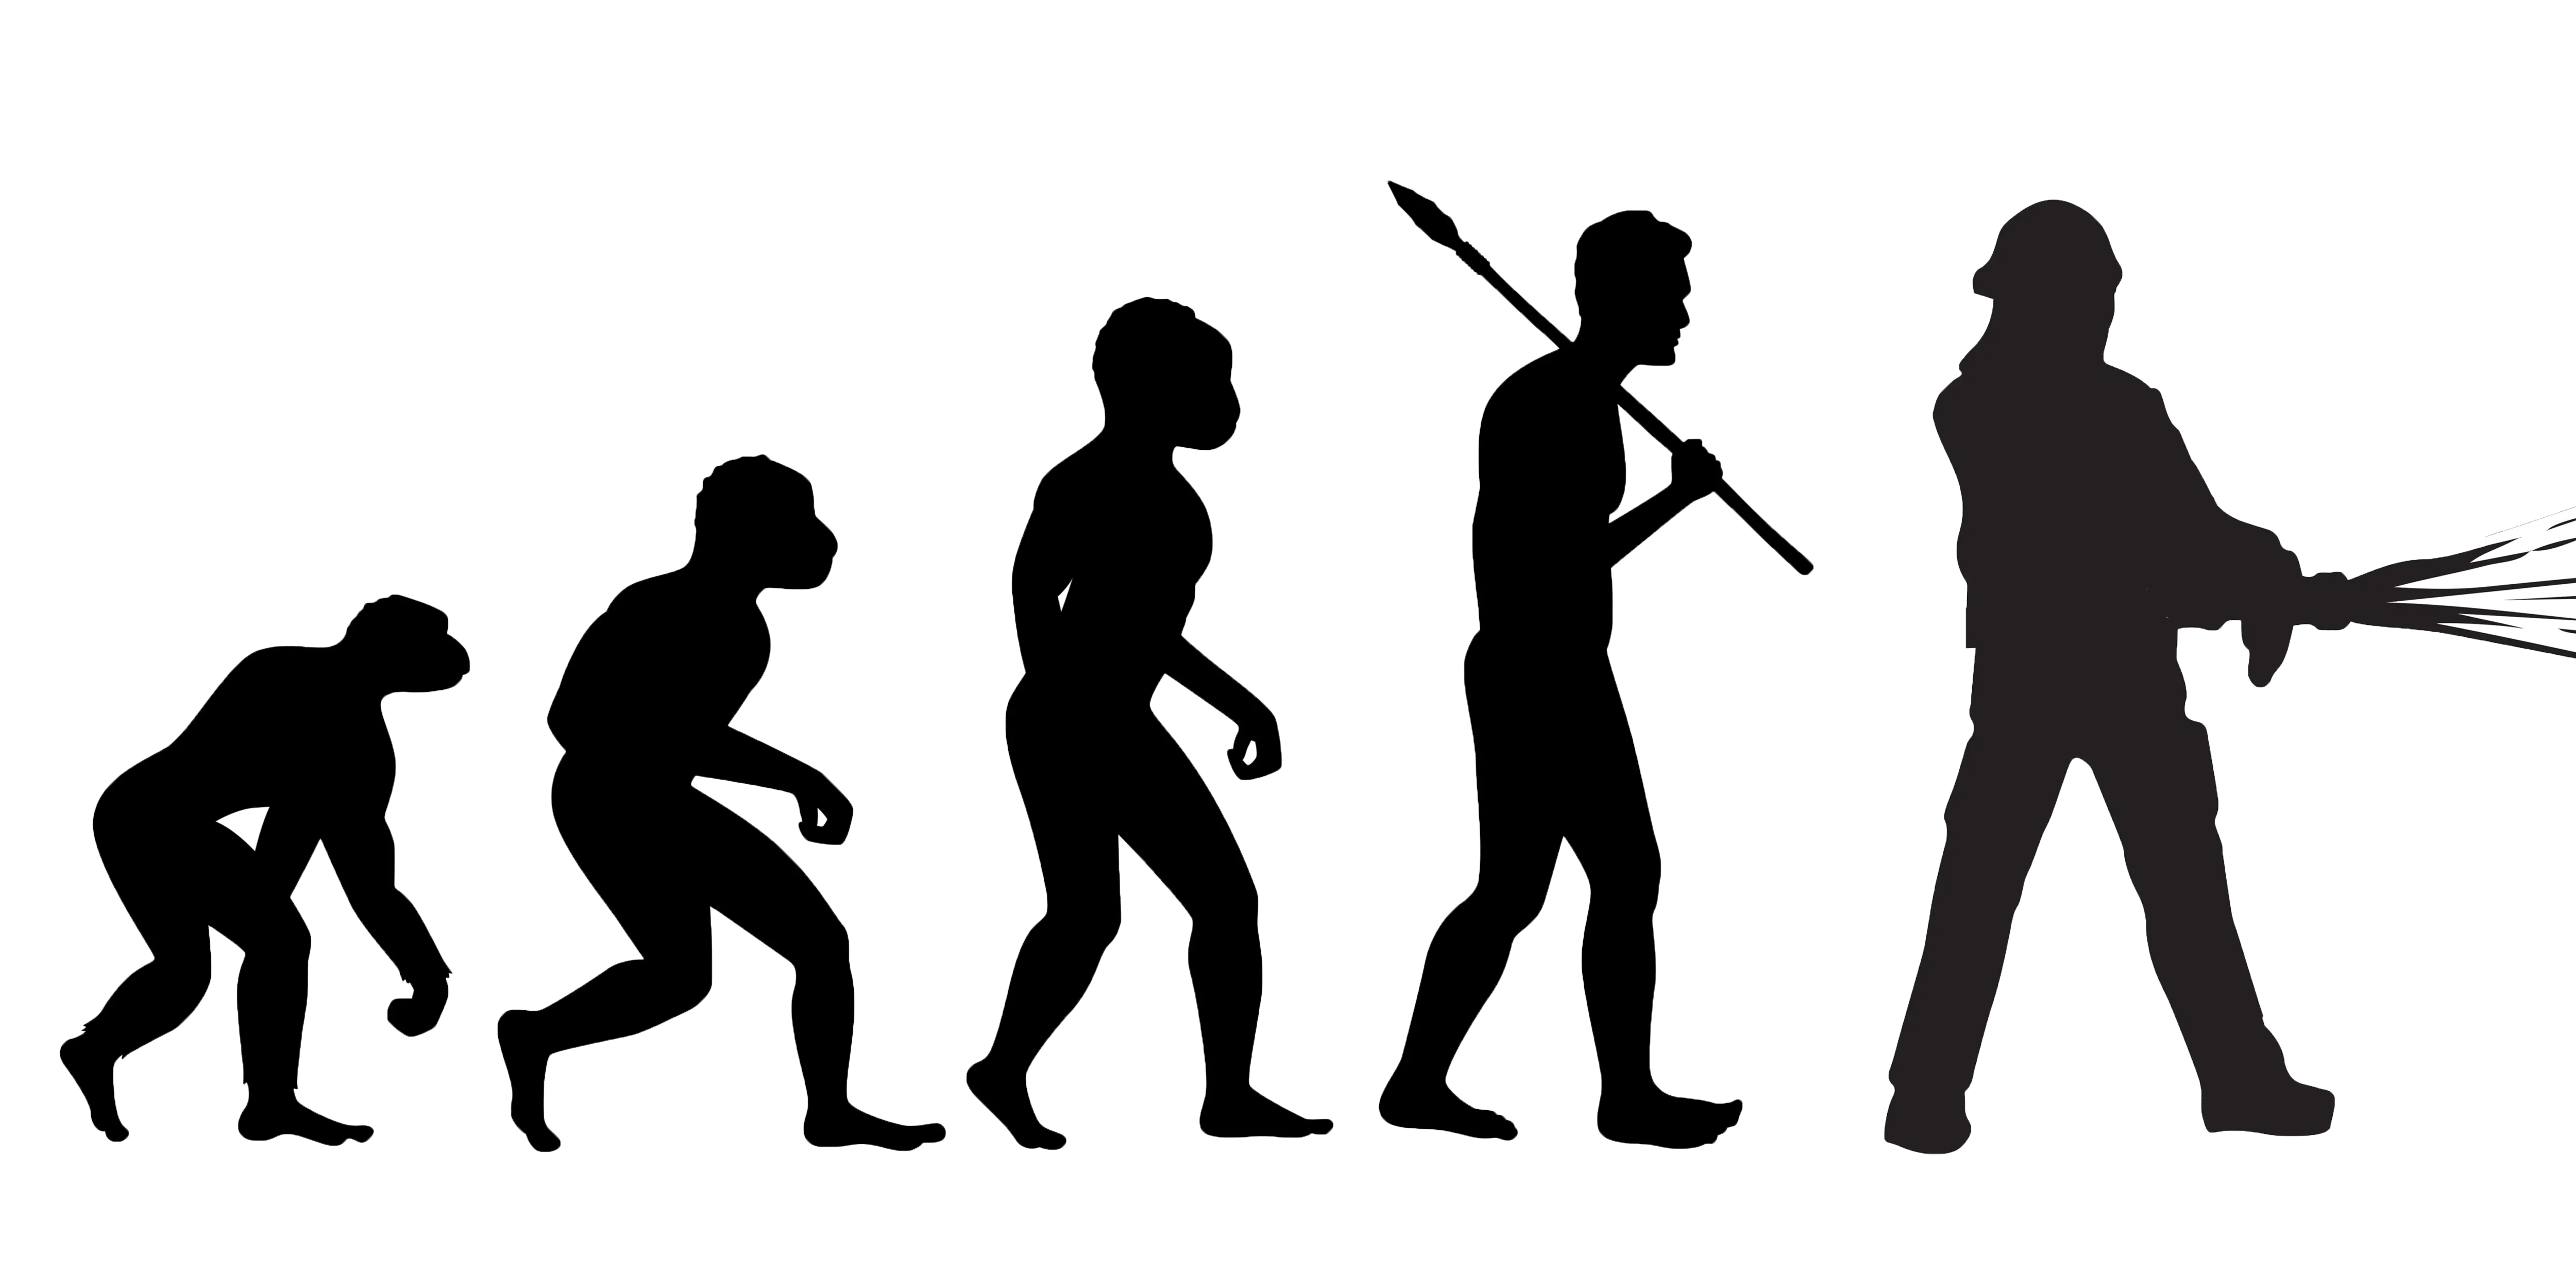
Human Evolution Silhouettes Illustration -
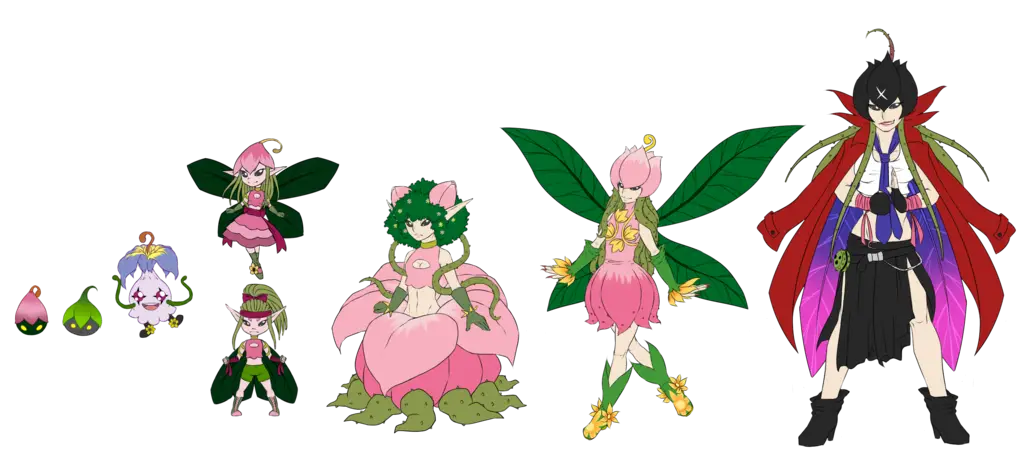
Fantasy Characters in Various Forms -
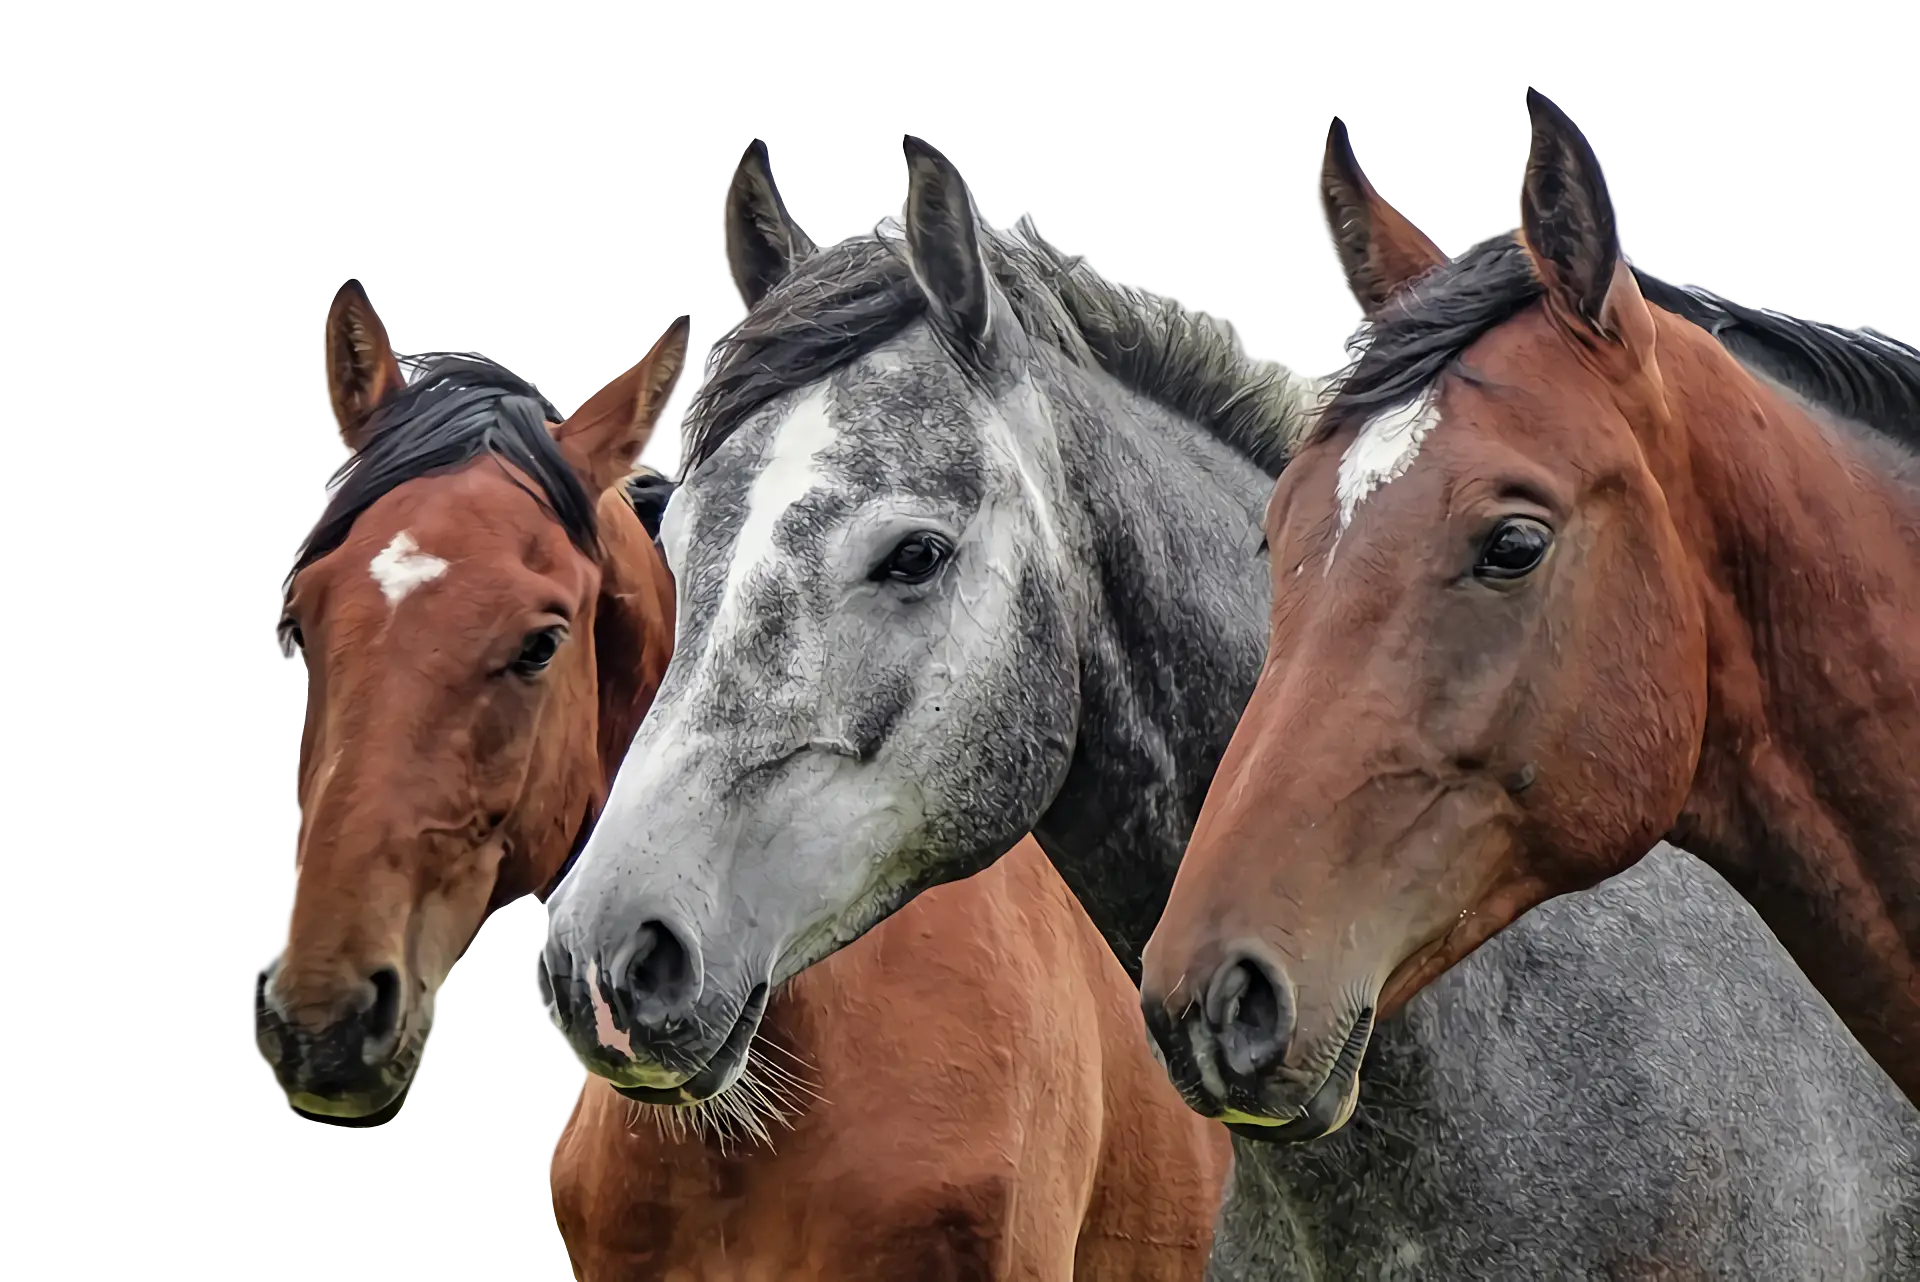
Group of Horses -
Red DNA Helix Symbol -

Blue Double-Helix DNA Strand Illustration -

Blue DNA Spiral and Green Leaf Logo -
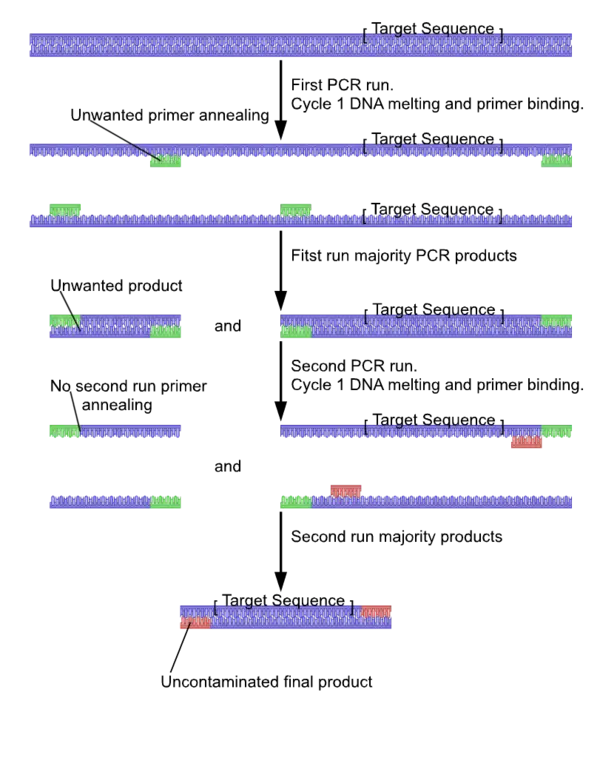
PCR Process Diagram for Science Education -
Artistic Africa Map