
You Might Like
-

Group of Students at School -

Lions International Logo -

Zigzag Down Arrow Icon for Decline Representation -

Market Stall Icon -
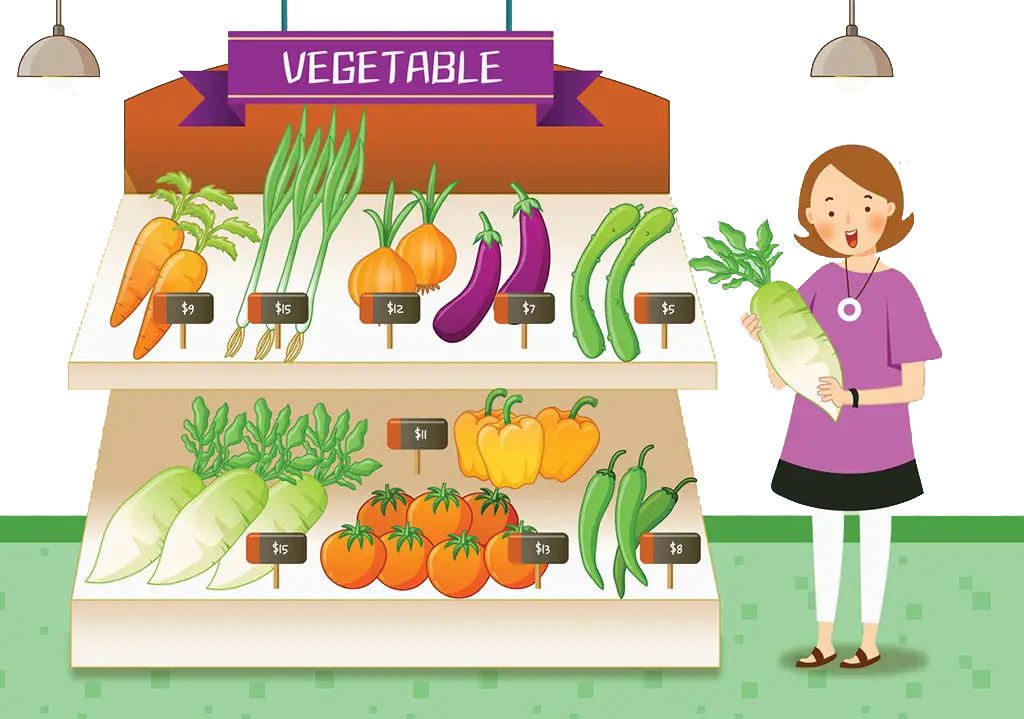
Cartoon Vegetable Stand with Shopper -

Charitable Hands Holding Box Icon -
Tree with Handprints for Team Collaboration -

Silhouette of People Celebrating -

Bull Market Symbol -

Illustration of People Holding Hands in a Circle -
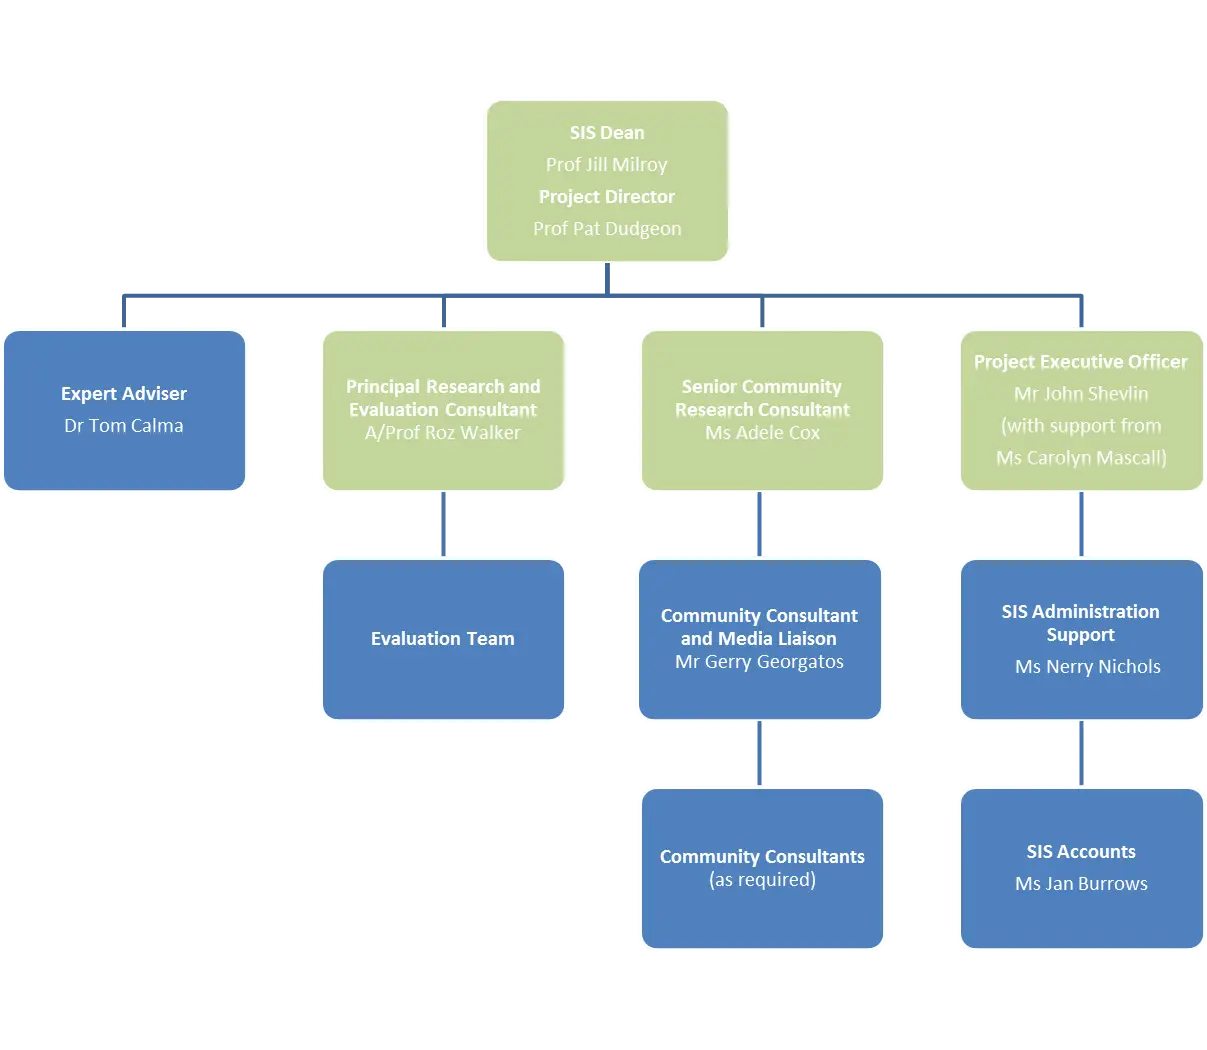
Organizational Flowchart Diagram -
Colorful Group of People -

Family Illustration with Parents and Child -

Community Gathering Around Cross -

Group Icon in Orange Circle Design -

Colorful Statistical Pie Chart -

Black Group Icon Representing Users -

Group of People Forming a Symbolic Circle -
Colorful Handprints Logo for Community Involvement -

Red Social Cooking Logo -

Illustration of Colorful Raised Hands with Teamwork Quote -
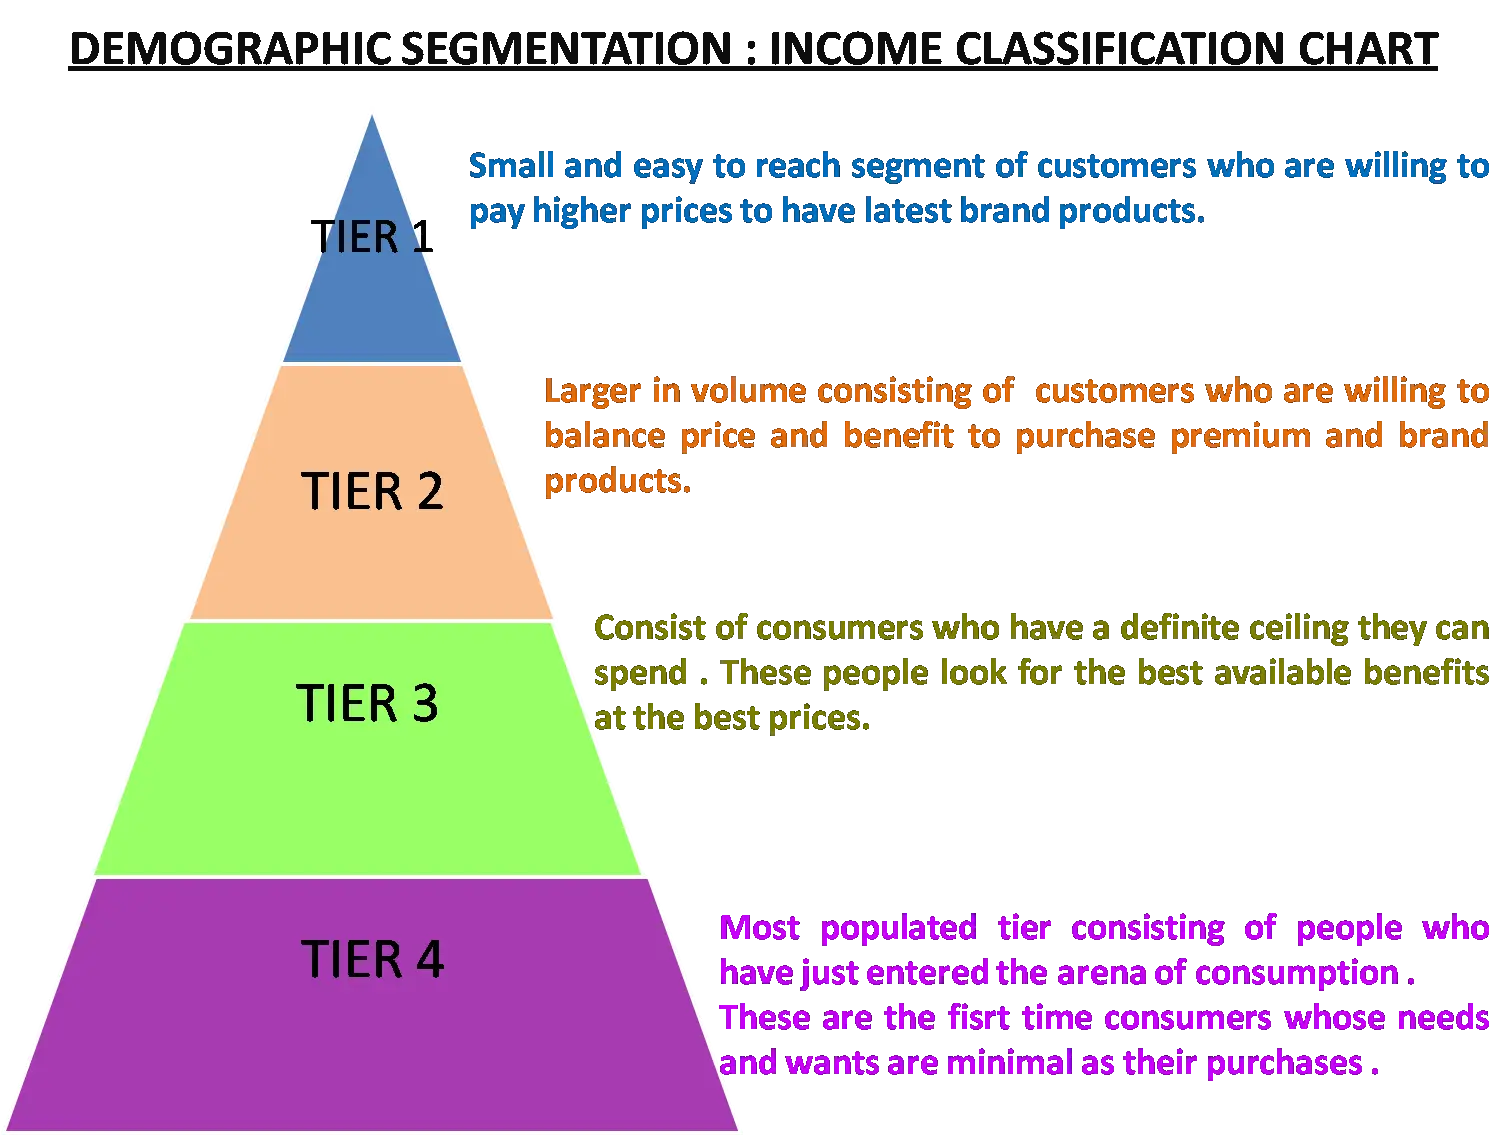
Demographic Segmentation Income Chart -
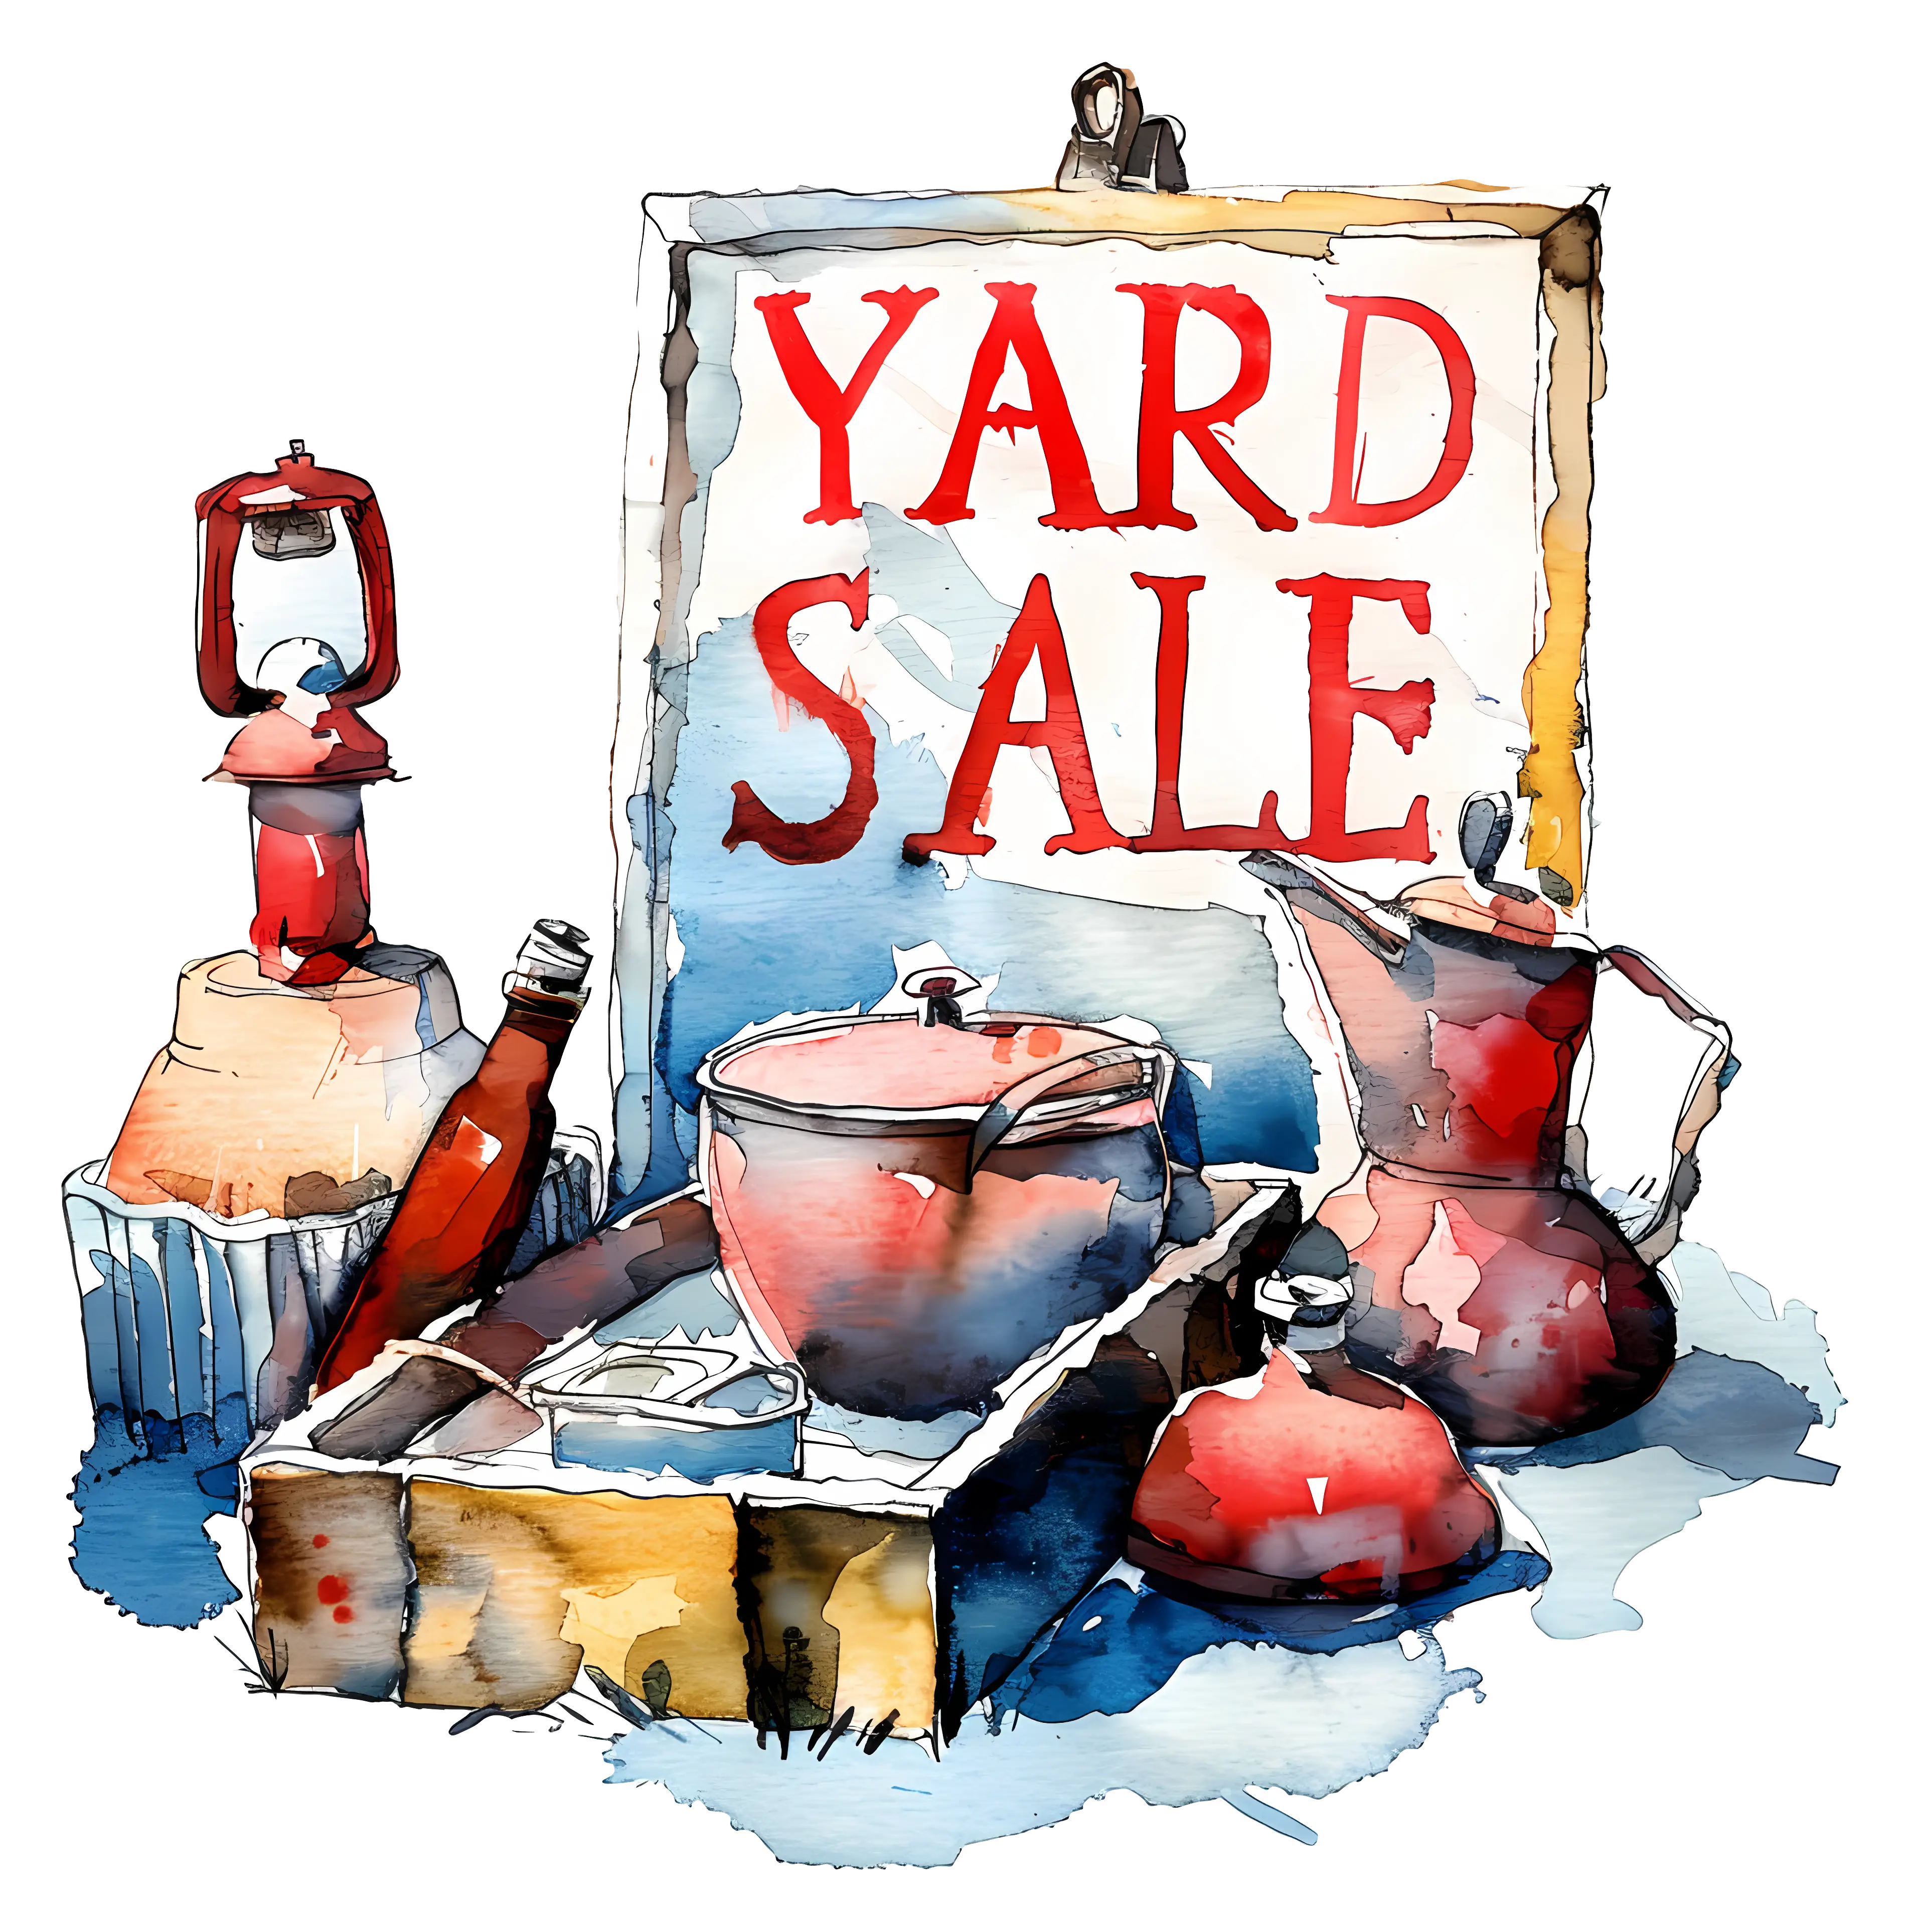
Yard Sale Event -
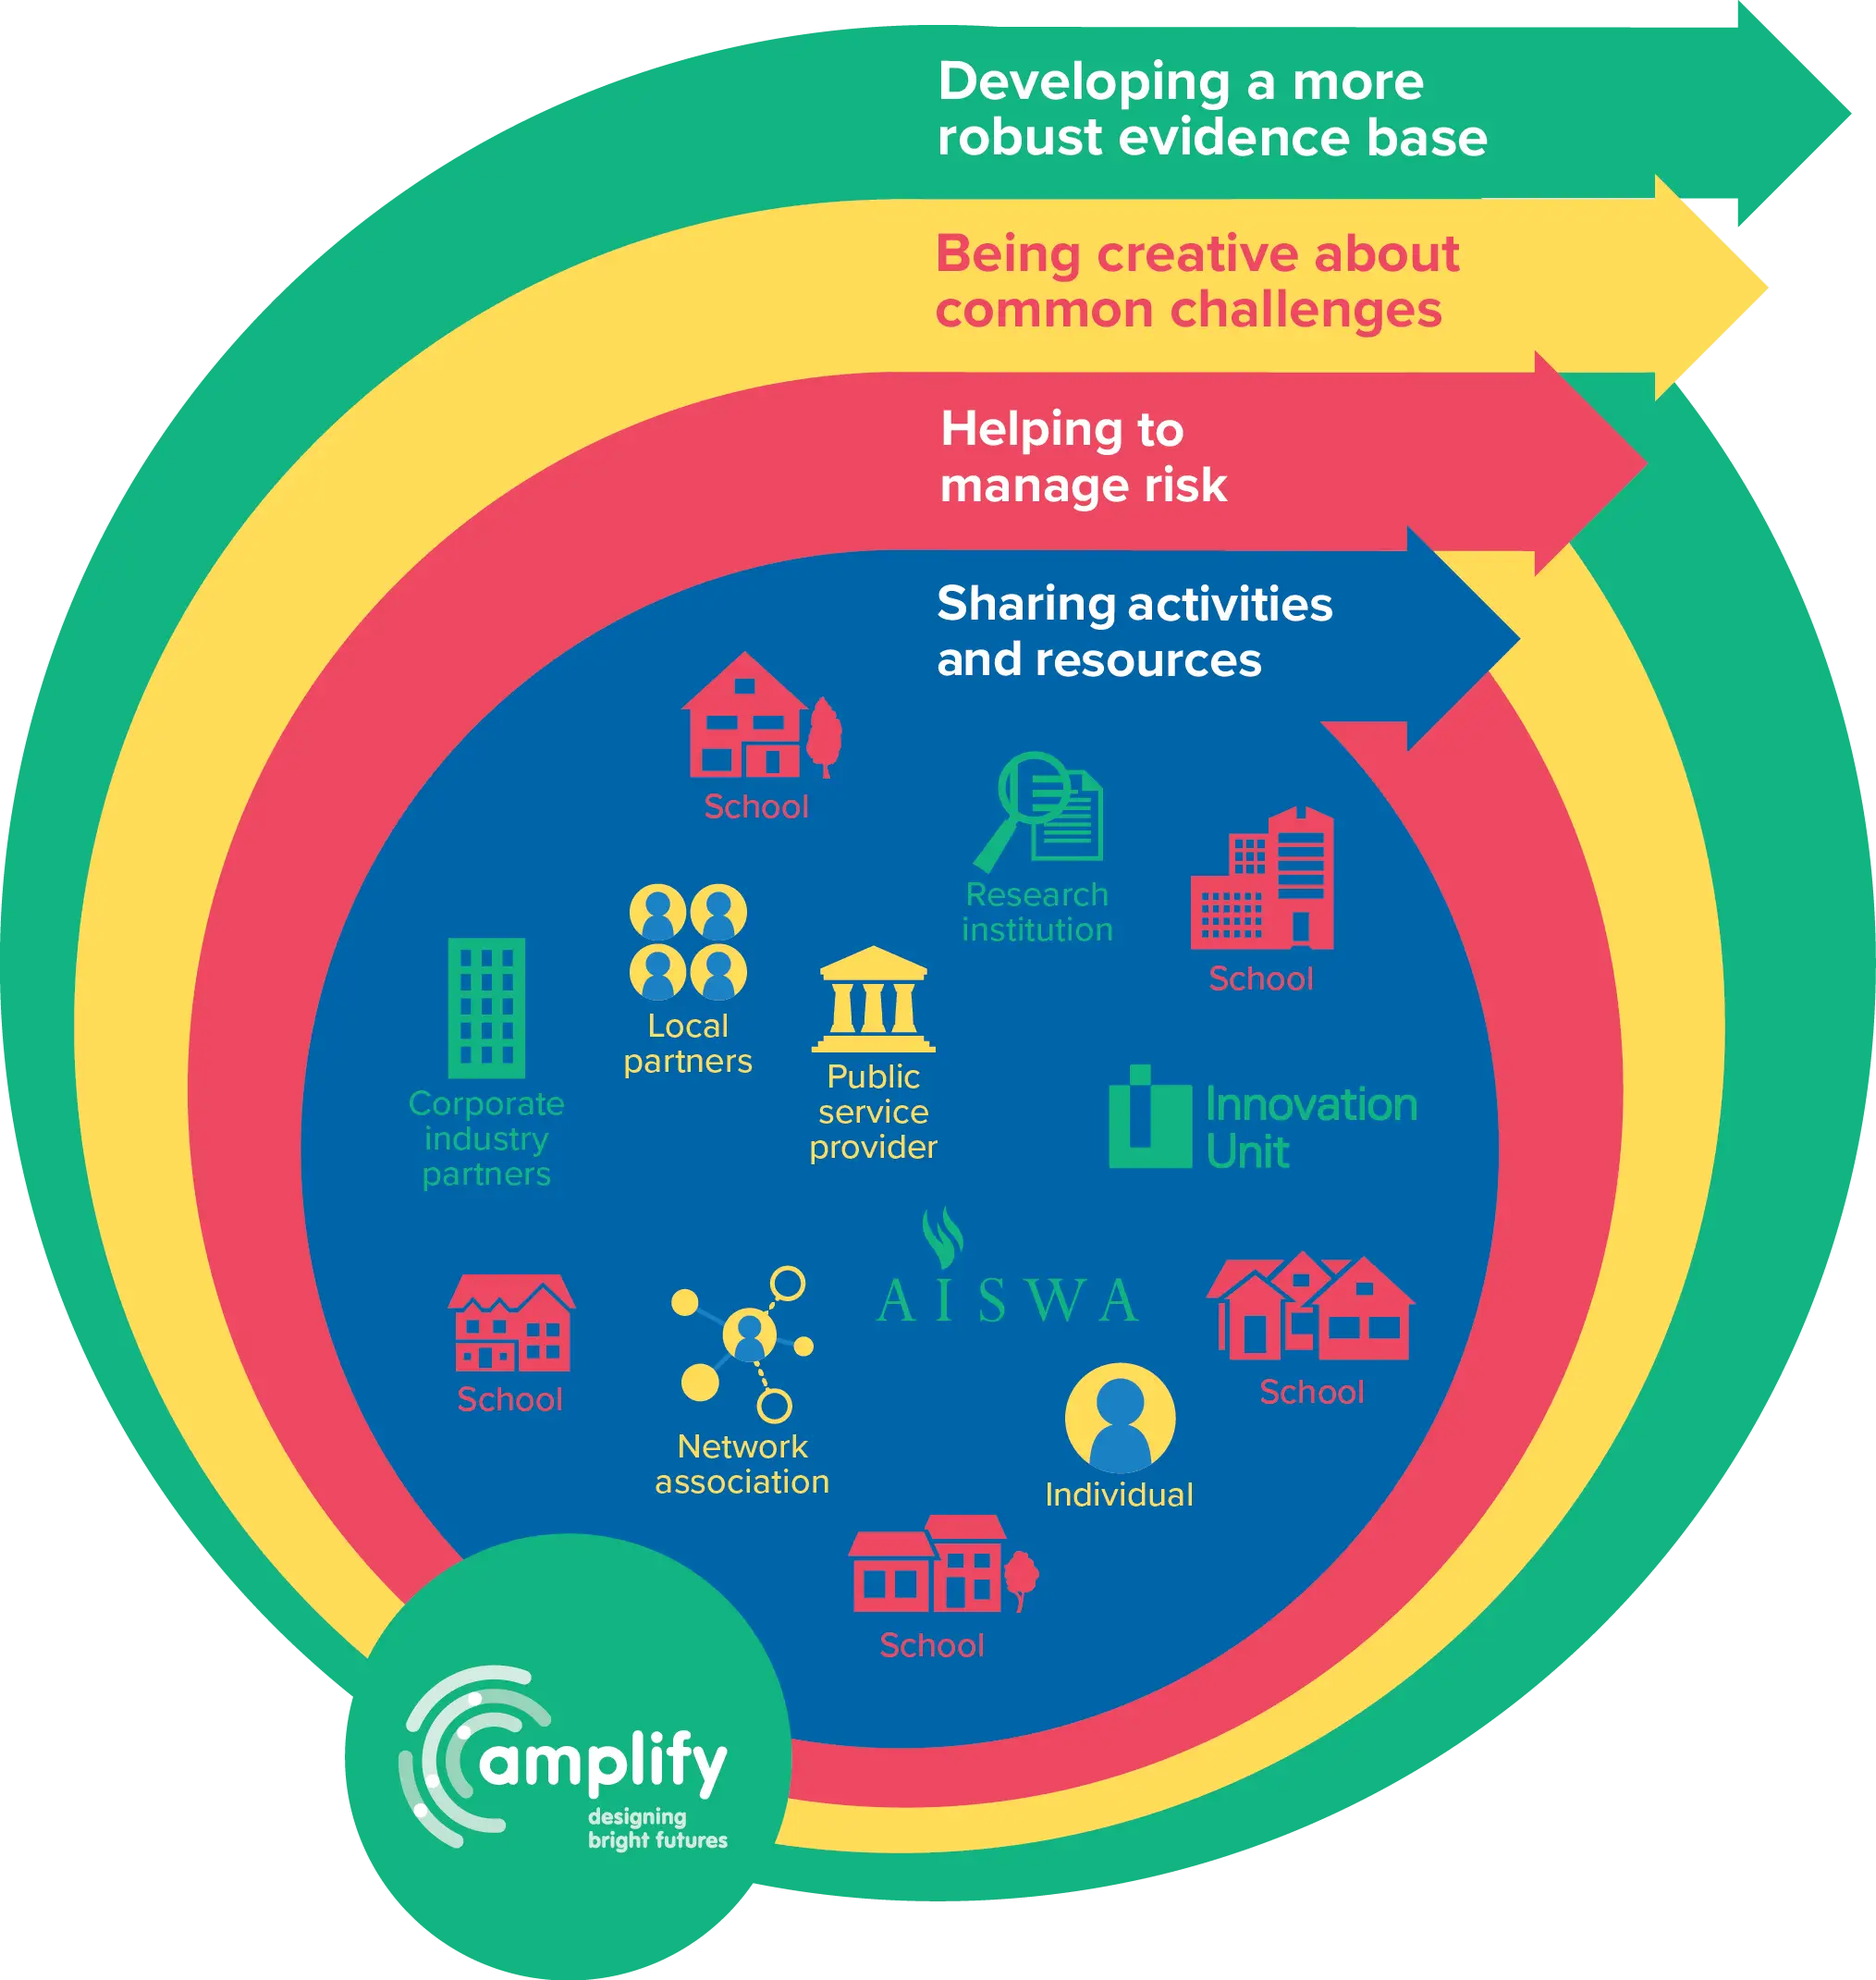
Colorful Infographic Diagram -

Rumah Literasi Sumenep Logo -
Tree with Colorful Handprints -

Shopping Cart with Groceries -

Woman with Groceries and Vegetables -
Munising Trout & Salmon Classic Event Logo -
Friends of Panyaden Logo