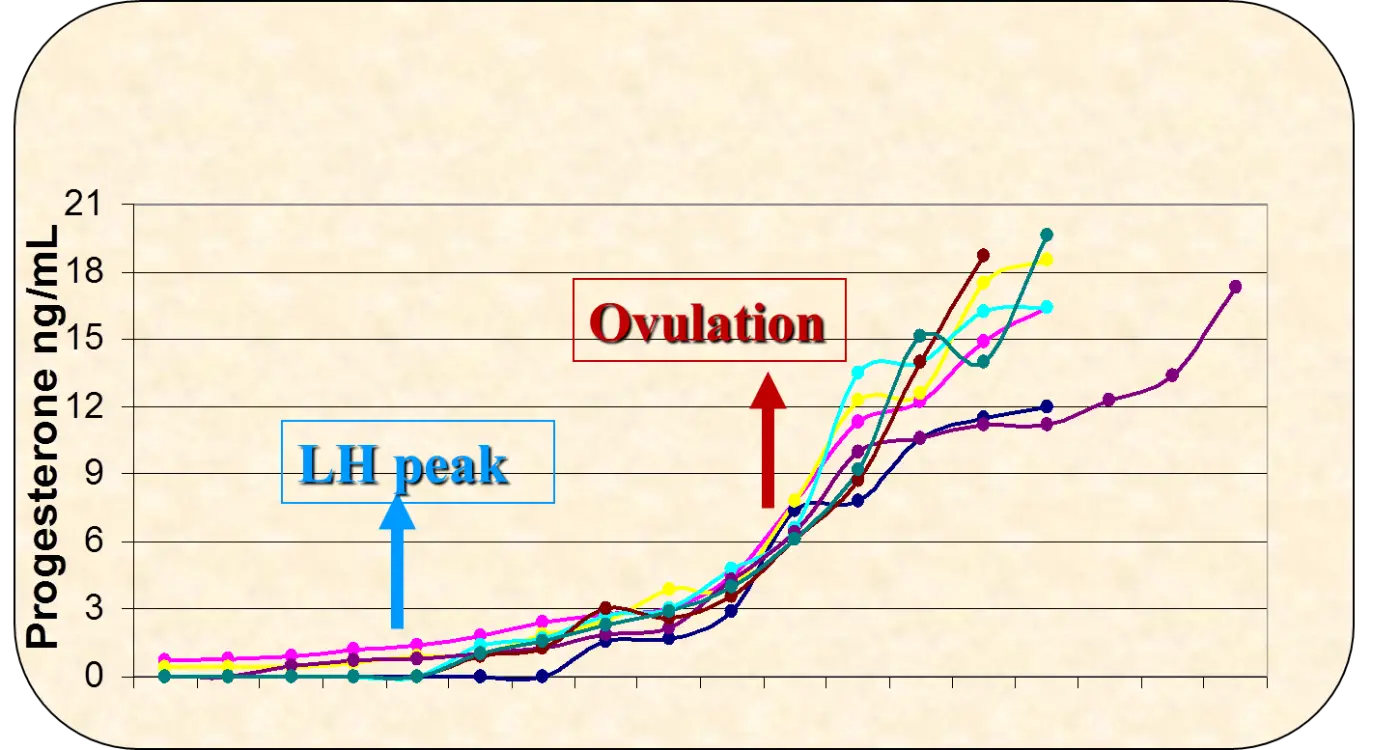
Progesterone Levels Tracking Ovulation and LH Peak, A Multi-Cycle Analysis
Progesterone Levels During Ovulation
This graph illustrates the typical changes in progesterone levels (measured in nanograms per milliliter, ng/mL) during a woman's menstrual cycle, specifically around the time of ovulation. Multiple colored lines represent individual cycles or subjects. The chart highlights two key events: the LH (Luteinizing Hormone) peak, which often precedes ovulation, and ovulation itself. As depicted, progesterone levels remain relatively low prior to these events. Following the LH peak and especially after ovulation, there's a distinct and rapid increase in progesterone, signifying the formation and function of the corpus luteum, which produces this hormone to prepare the uterus for a potential pregnancy.