You Might Like
-
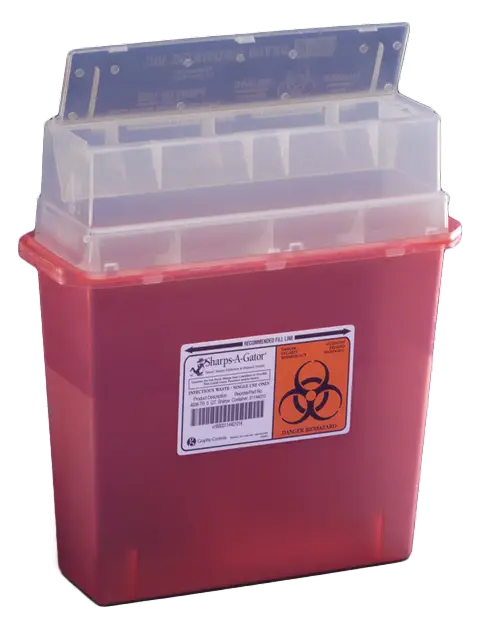
Red Sharps Biohazard Container -
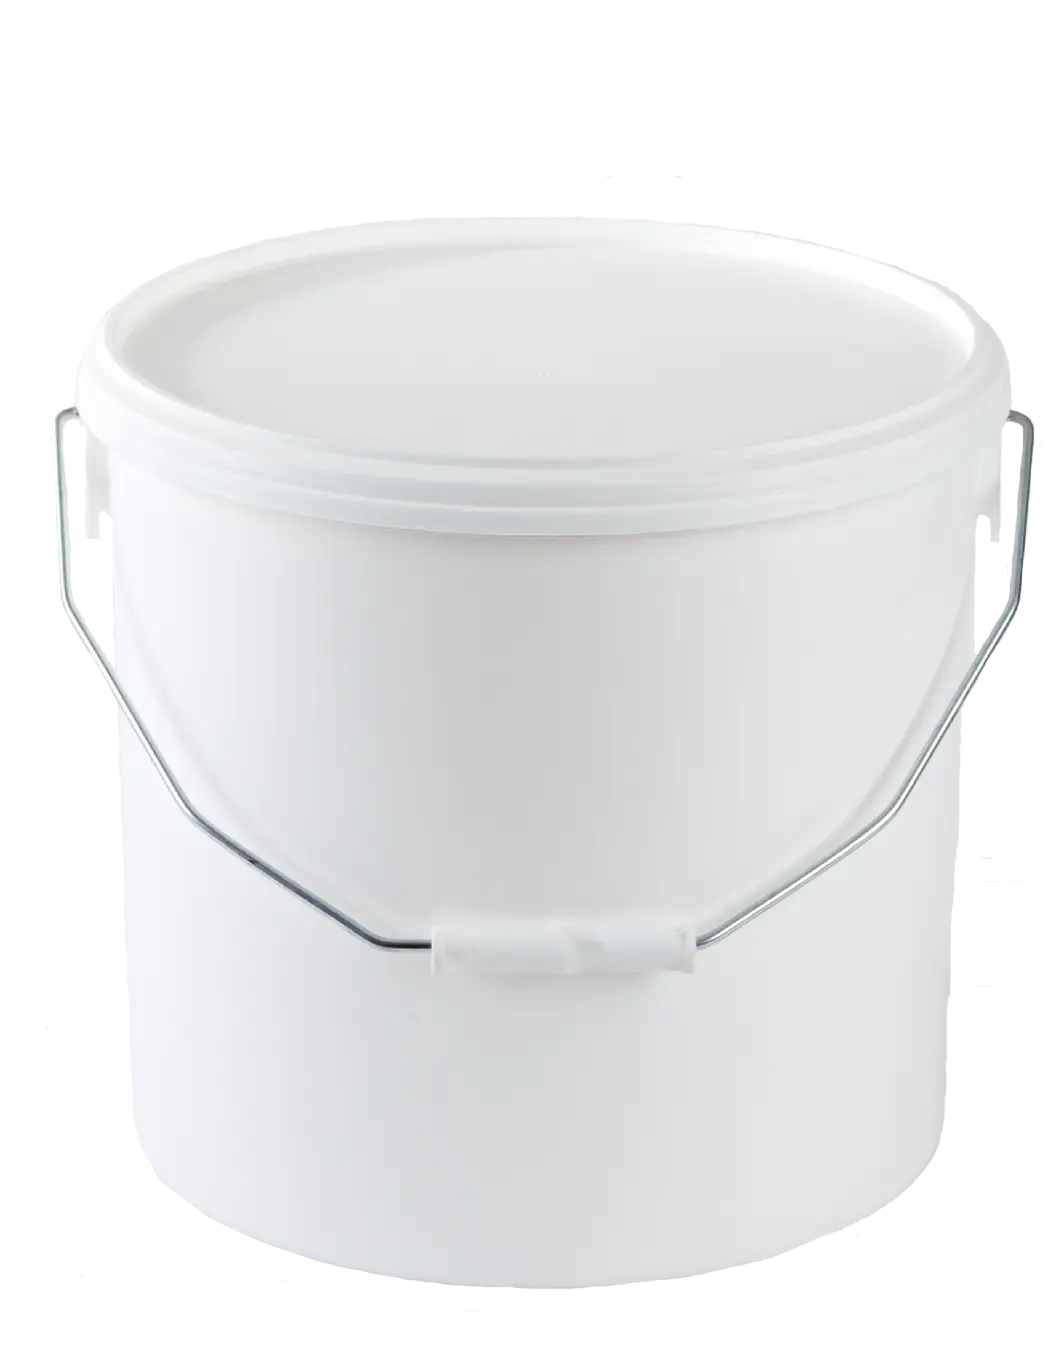
White Plastic Bucket with Handle -
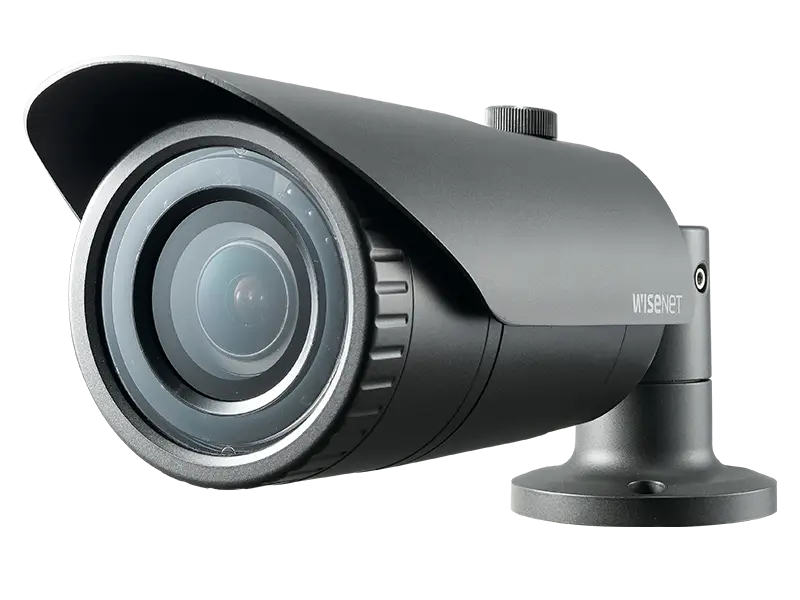
High-Definition Security Surveillance Camera -
Green Plastic Bin for Household Storage -

Security Camera Icon -

Various Devices Displaying Software -

Icon of KPI Dashboard with Graph and Person -

Zigzag Down Arrow Icon for Decline Representation -
Surveillance Security Camera -

Black and White Oil Container -
Comprehensive Home Security System -

Outline Icon of Bottle -

Cardboard Box with Tape Illustration -
Black Security Camera for Monitoring -

Empty Transparent Glass Jar with Lid -

Blue Declining Bar Graph with Arrow -

Business Icons Set for Digital Workflows -

Circle Pie Chart Icon -
Red Trash Bin Icon in Minimalist Style -
White Dome Security Camera -

Declining Chart Illustration -

Eco-friendly Fuel Container -

Digital Devices with Graph -

Magnifying Glass with Graph Illustration -
Cyan Cylinder Shape -

Black Open Box Silhouette -
Black Security Camera Icon -
Red Bottle with Green Label -
Calculator and Chart Icon for Data Analysis -
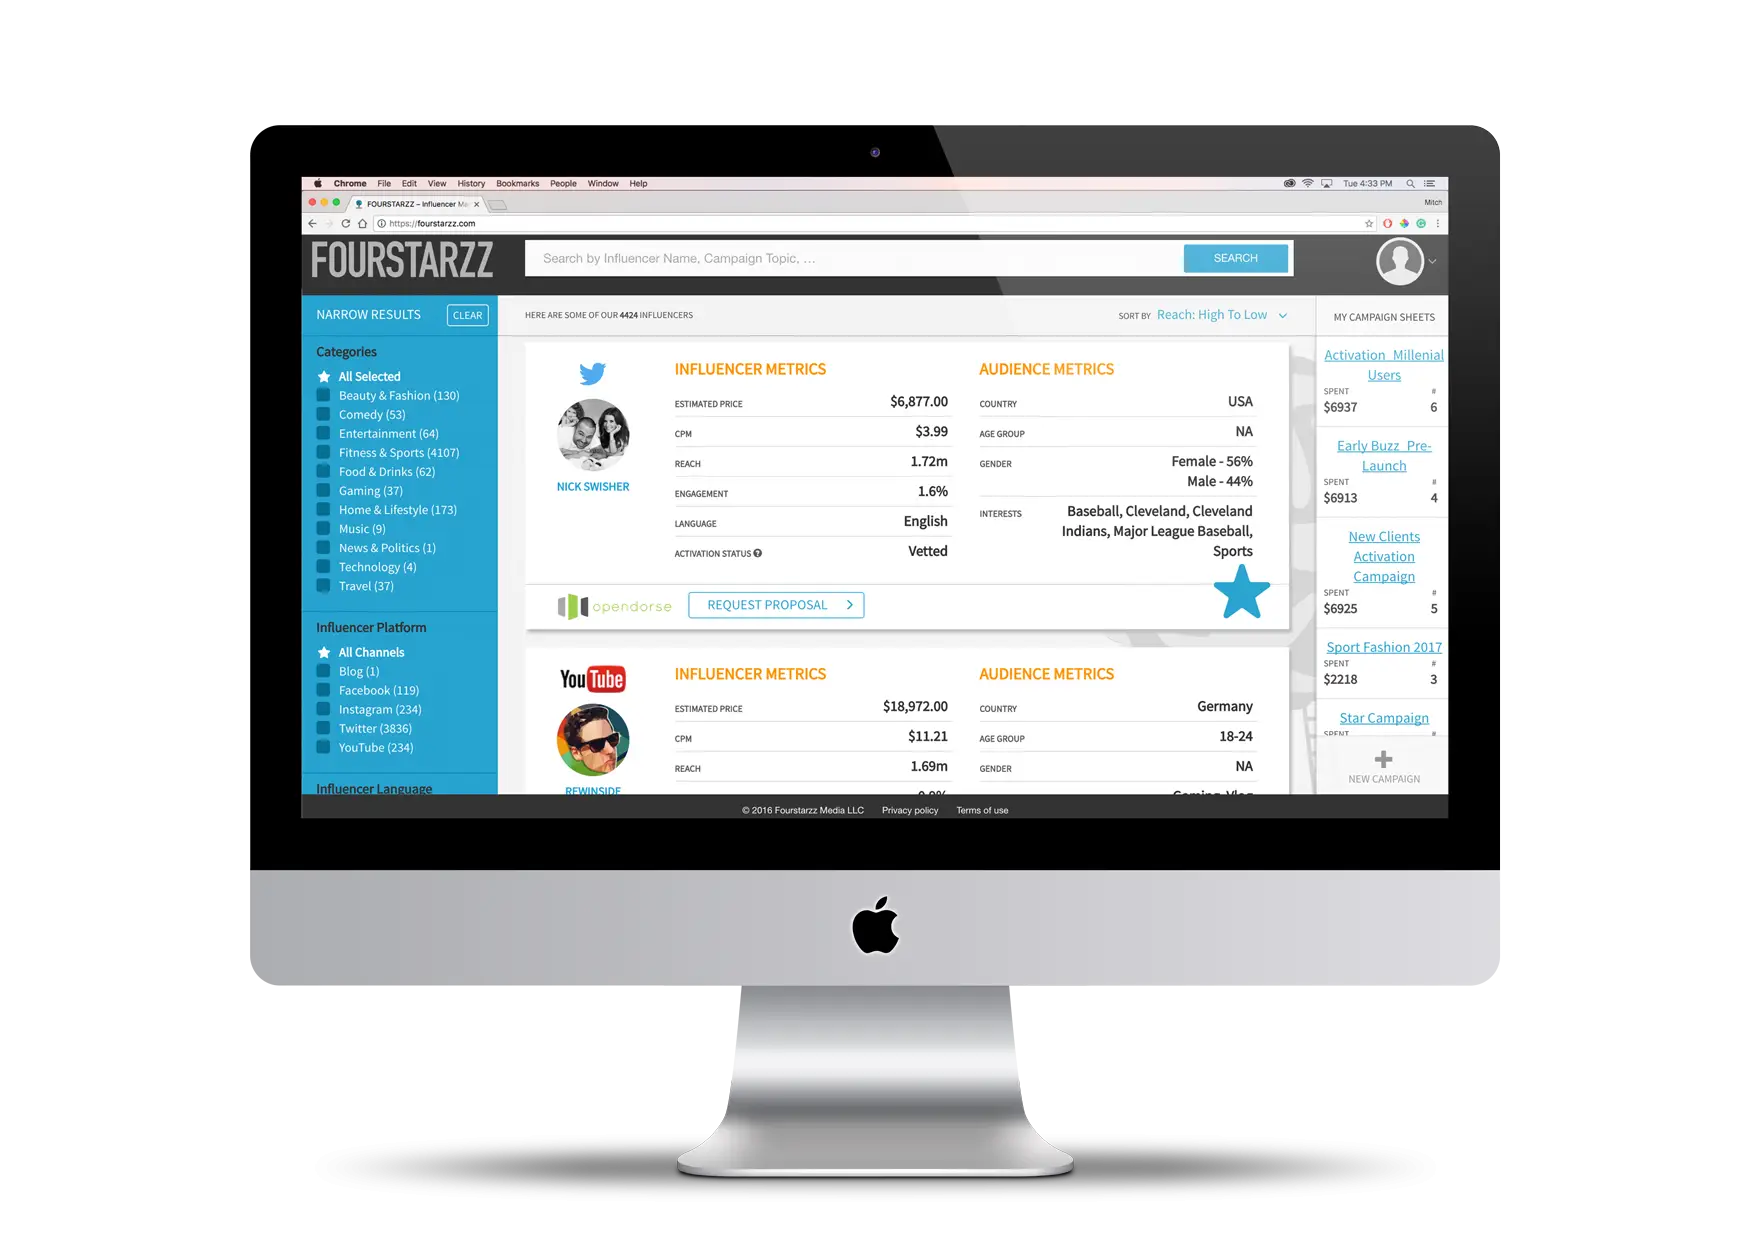
Computer Screen with Interface