You Might Like
-
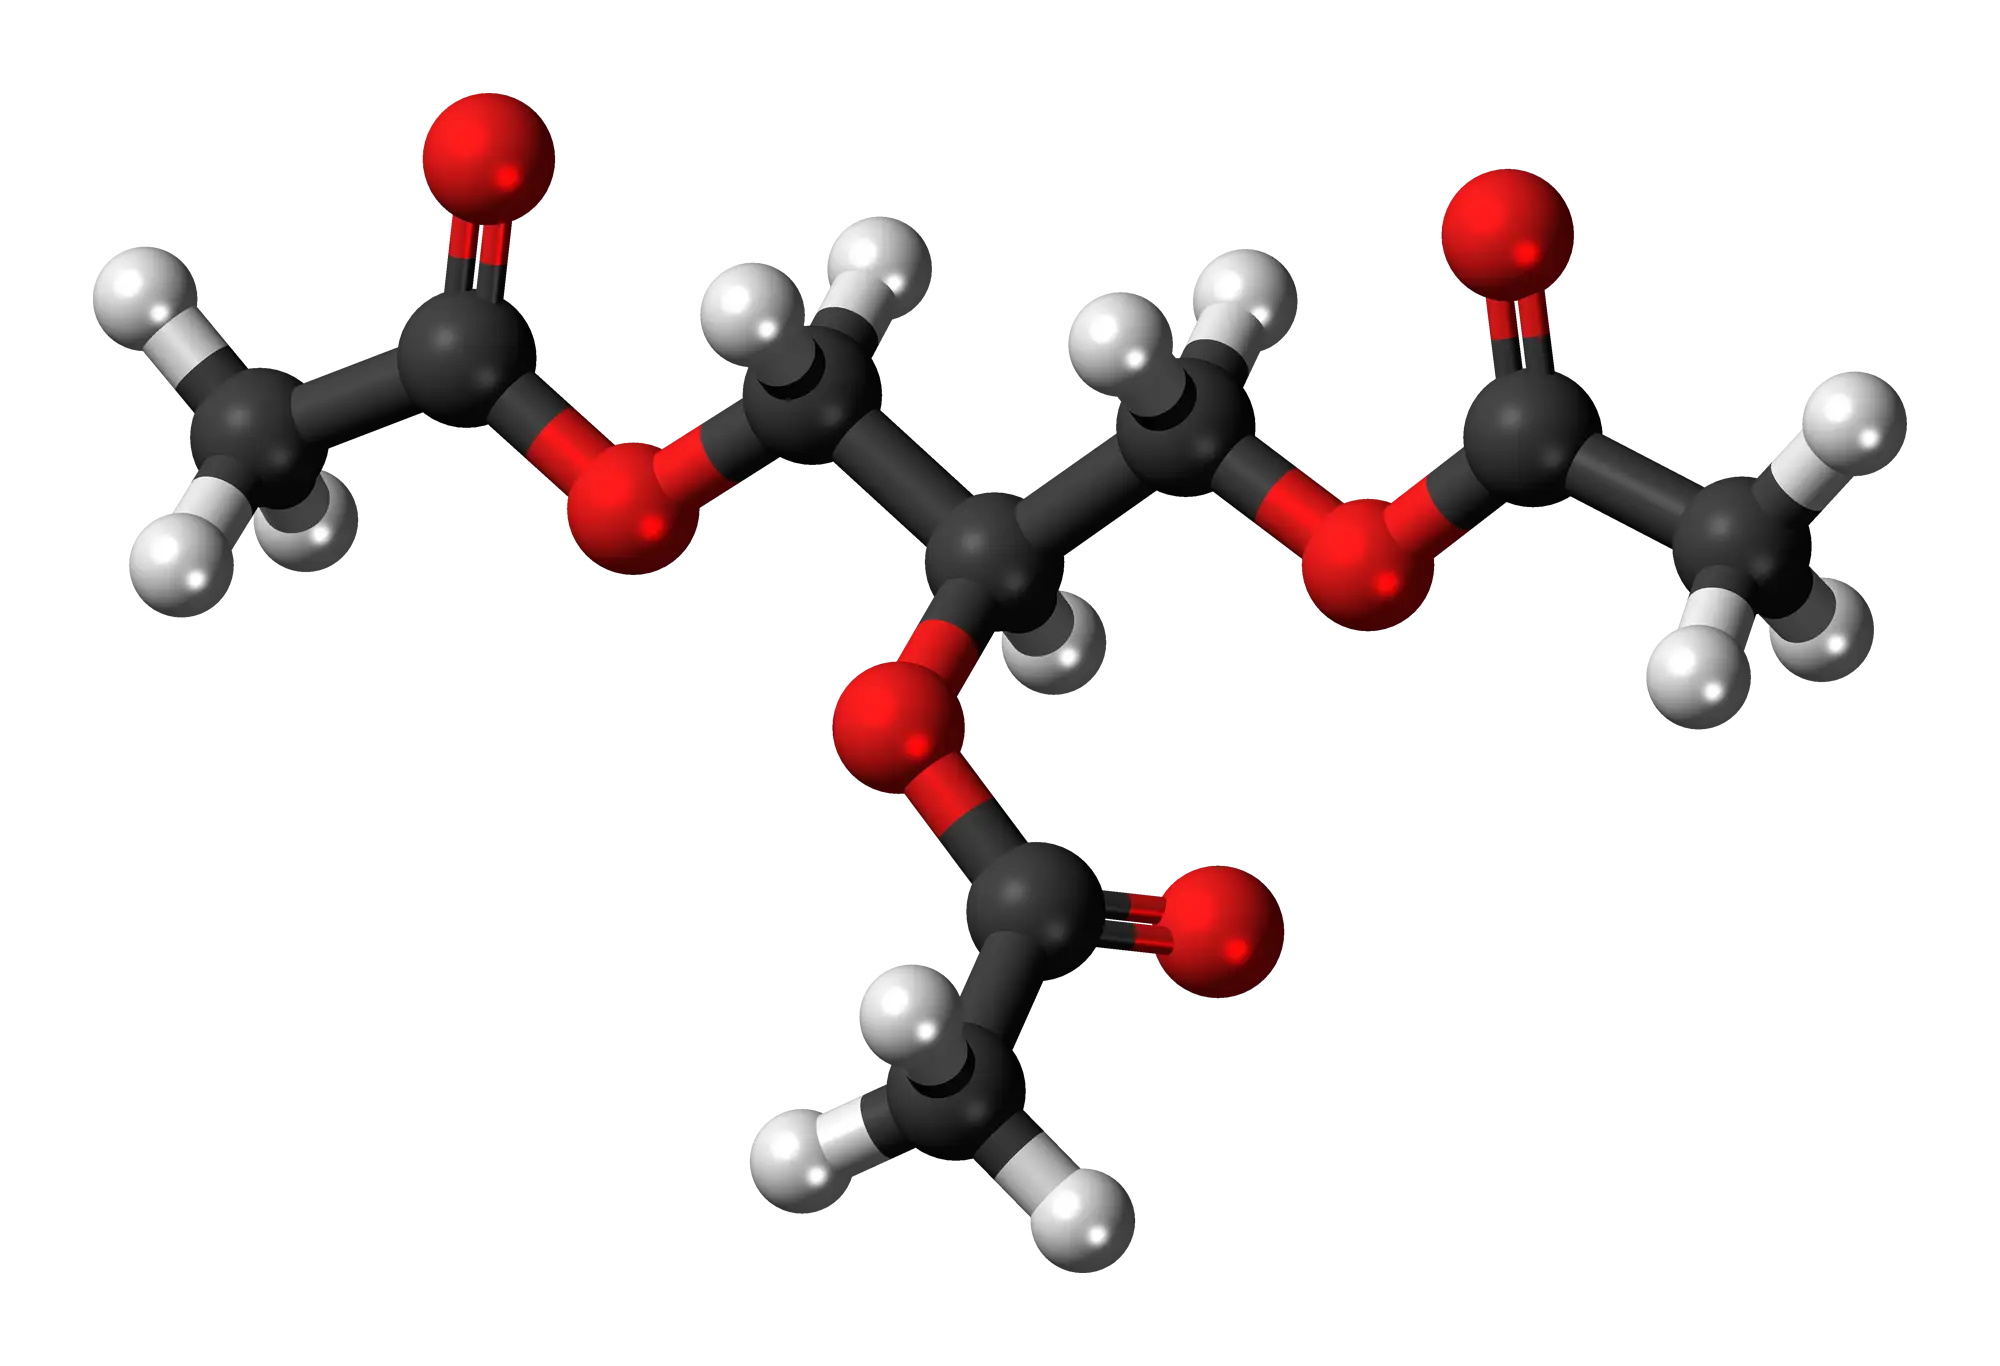
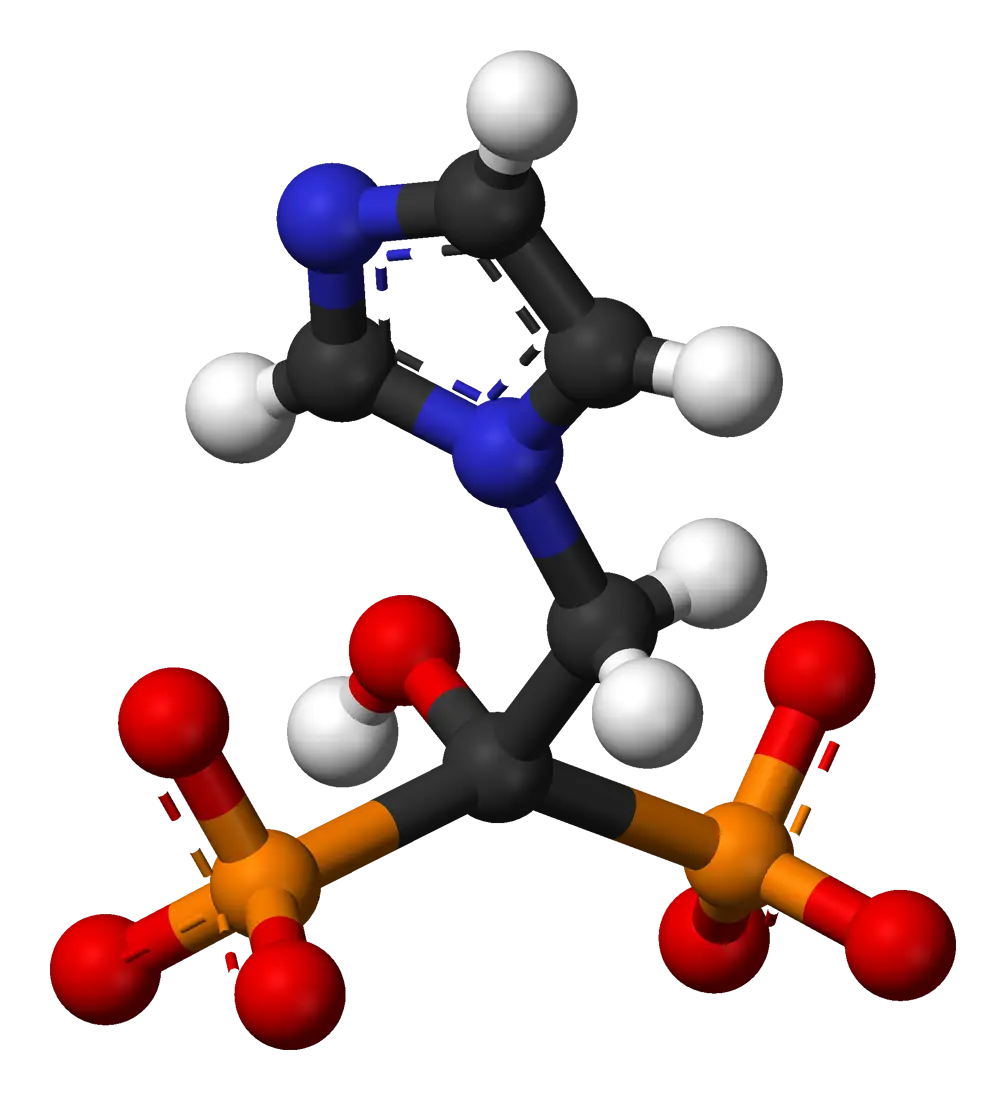
Chemical Molecule Structure Illustration -
Chemical Reactions Diagram -

Drooling Emoji with Red Eyes -

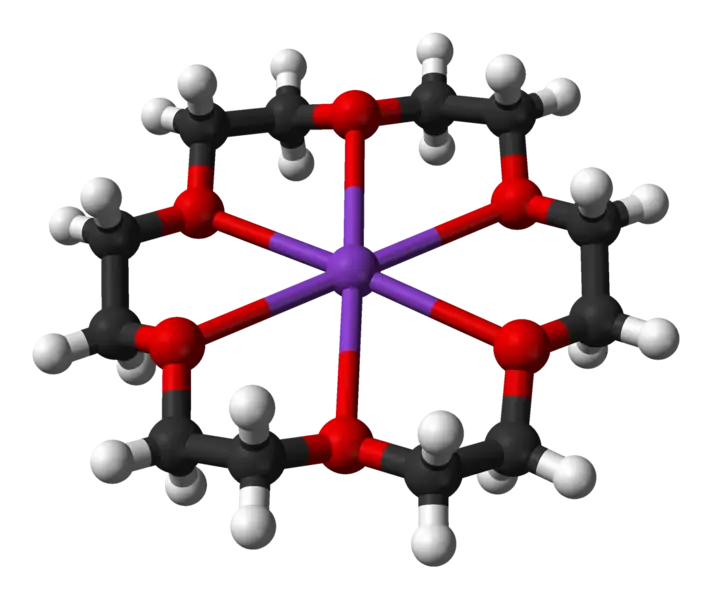
Scientific Chemical Structure Diagram -
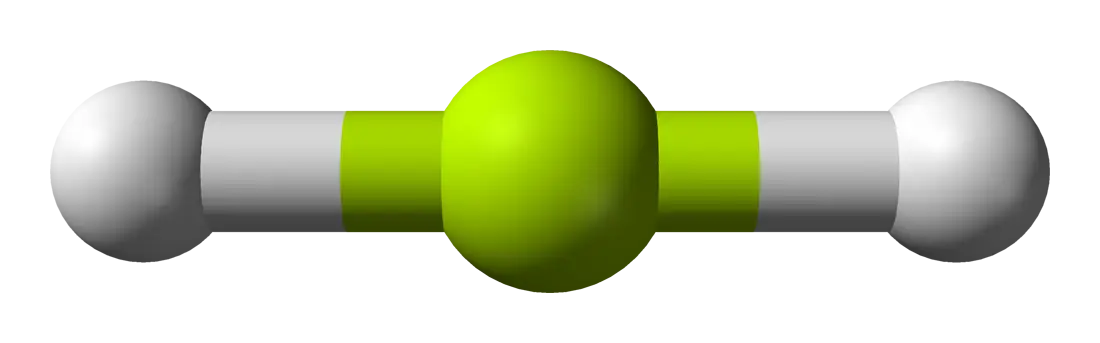
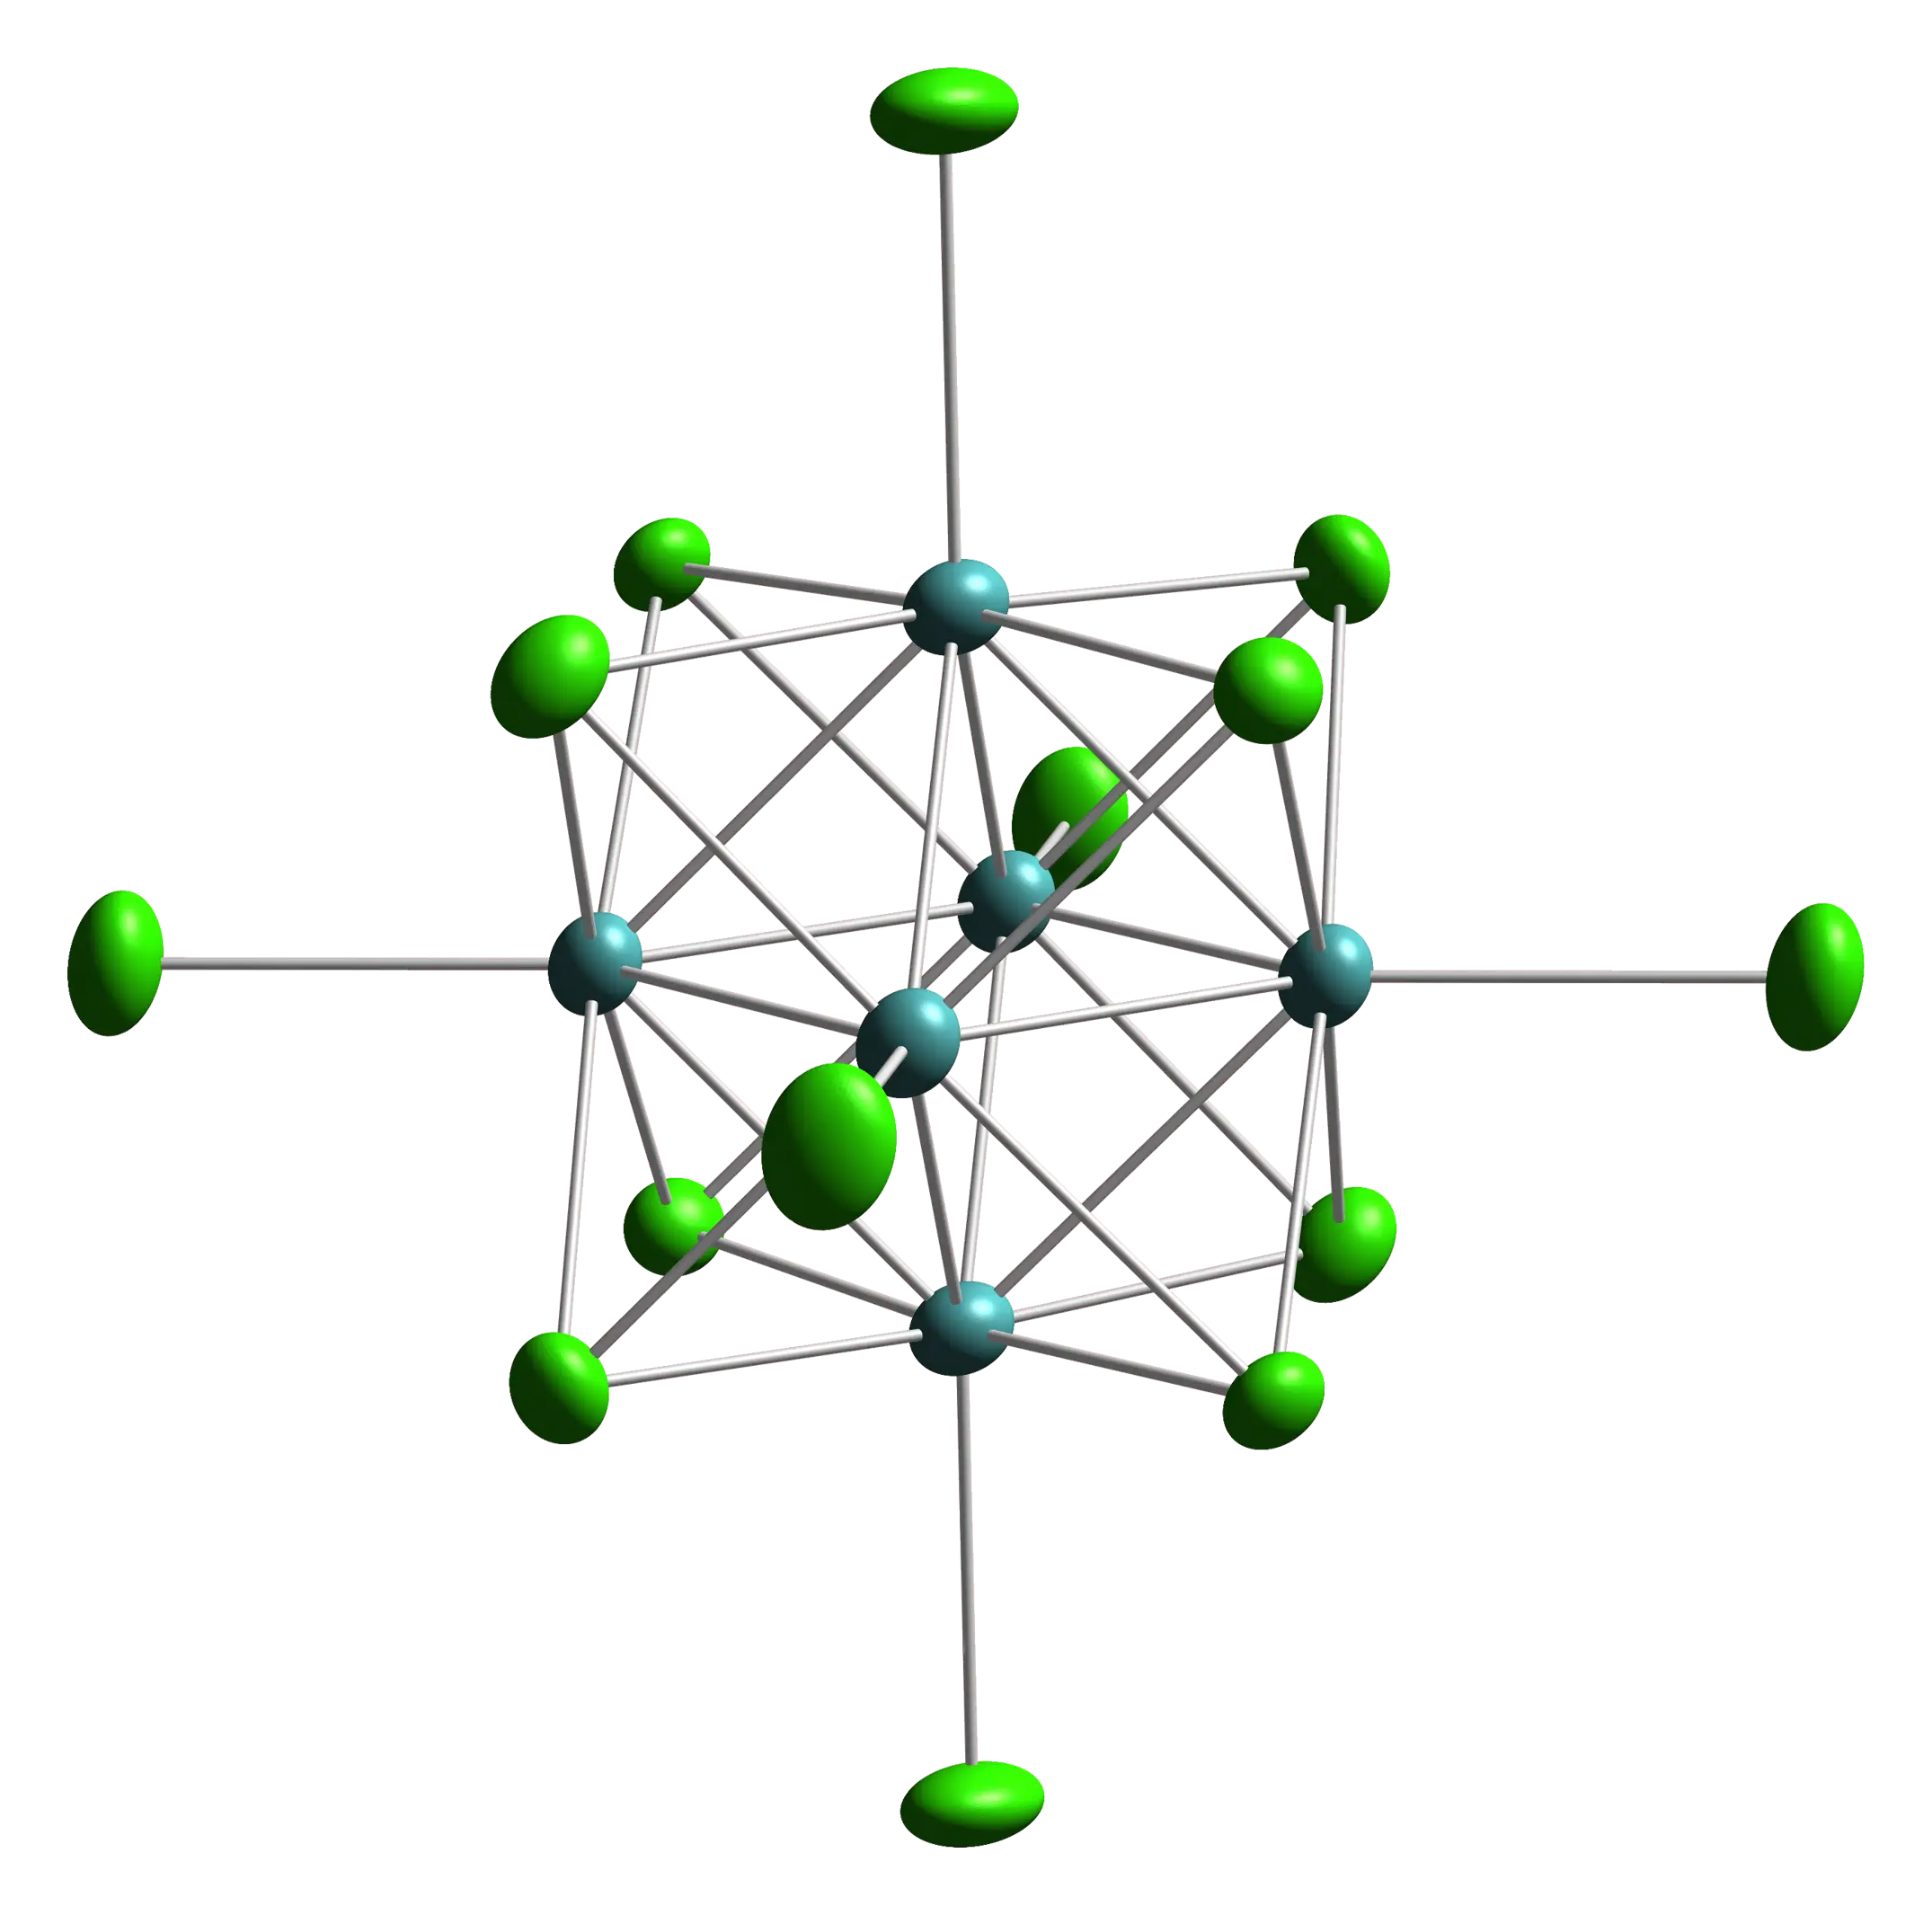
Molecule Structure Scientific Model -

Chemical Structure Illustration for Scientific Study -
Chemical Molecule Illustration -
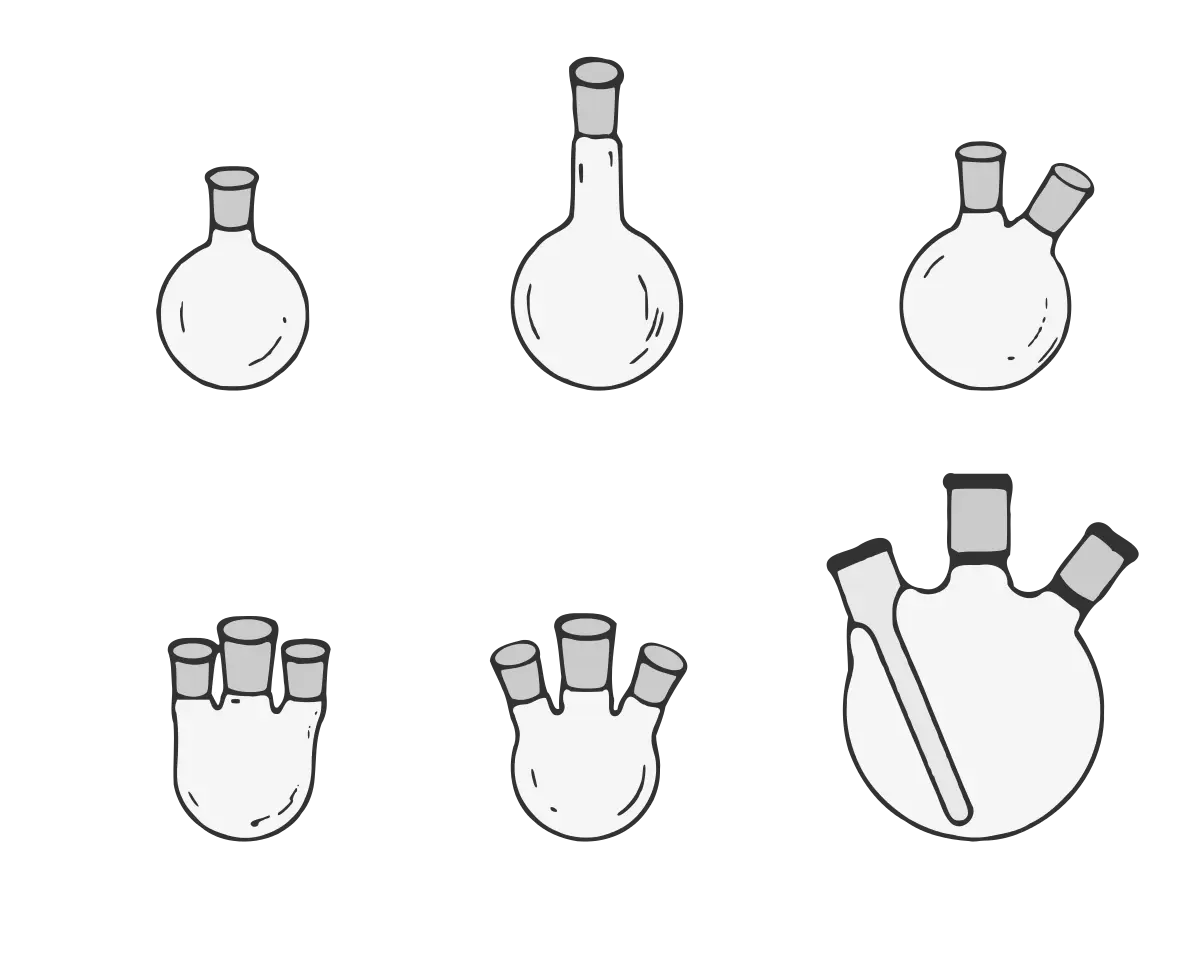
Various Laboratory Flasks -

Round-Bottom Flask with Green Liquid -

Laboratory Experiment Setup Illustration -
Science Beaker Icon -

Blue Heart Flask Illustration -
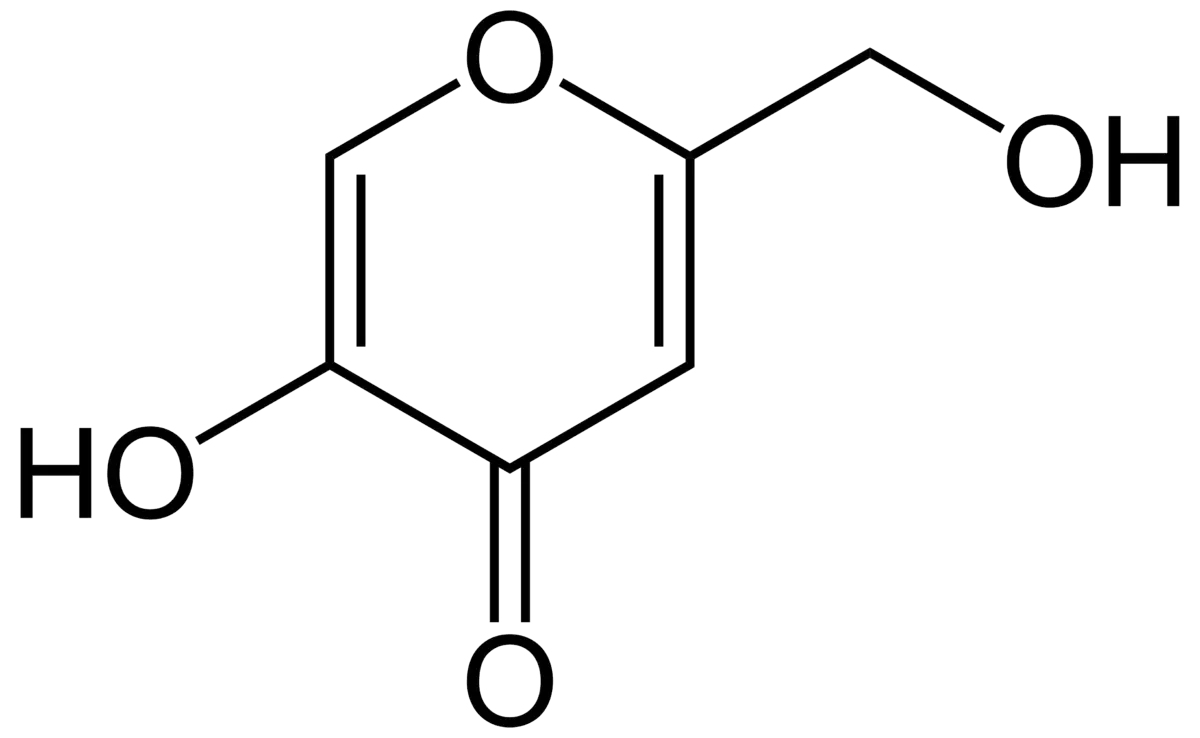
Hydroqui Organic Compound Diagram -

Dizzy Emoji with Spinning Stars -

Chemical Structure Diagram -

Blue Science Flask with Liquid -
Molecular Structure Illustration for Science Study -

Sodium Persulfate Chemical Structure -

Magnesium Sulfate Chemical Structure -

Erlenmeyer Flask Outline Icon -
3D Chemical Structure for Educational Use -

Chemical Structure Diagram -
Green Chemistry Flask for Science Illustration -
3D Chemical Structure Representation -
Blue Laboratory Flask Illustration -
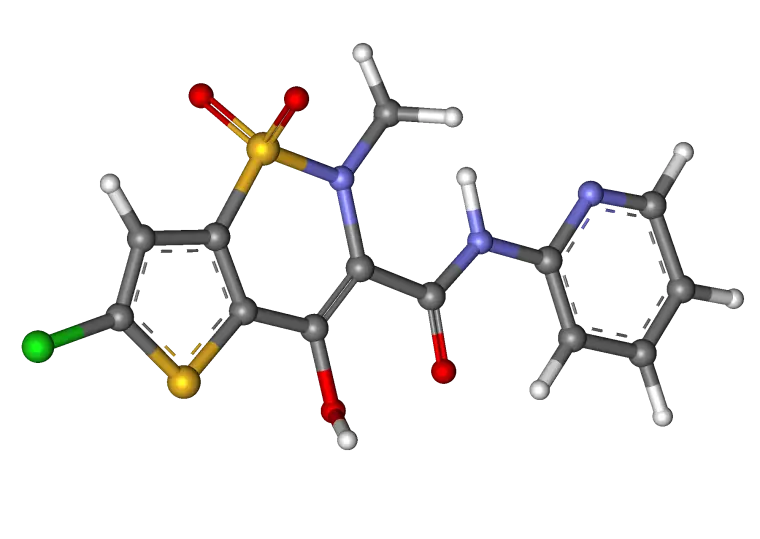
Complex Molecular Structure for Science Enthusiasts -

Surprised Man with Glasses -
Colorful Molecular Structure Diagram -
Pink Liquid in Laboratory Flask with Bubbles -
3D Molecular Model Illustration