You Might Like
-

Simple Credit Card Icon -

Black Money Bag Icon with Dollar Sign -

Organizational Structure Chart -
Hand Holding Credit Card -
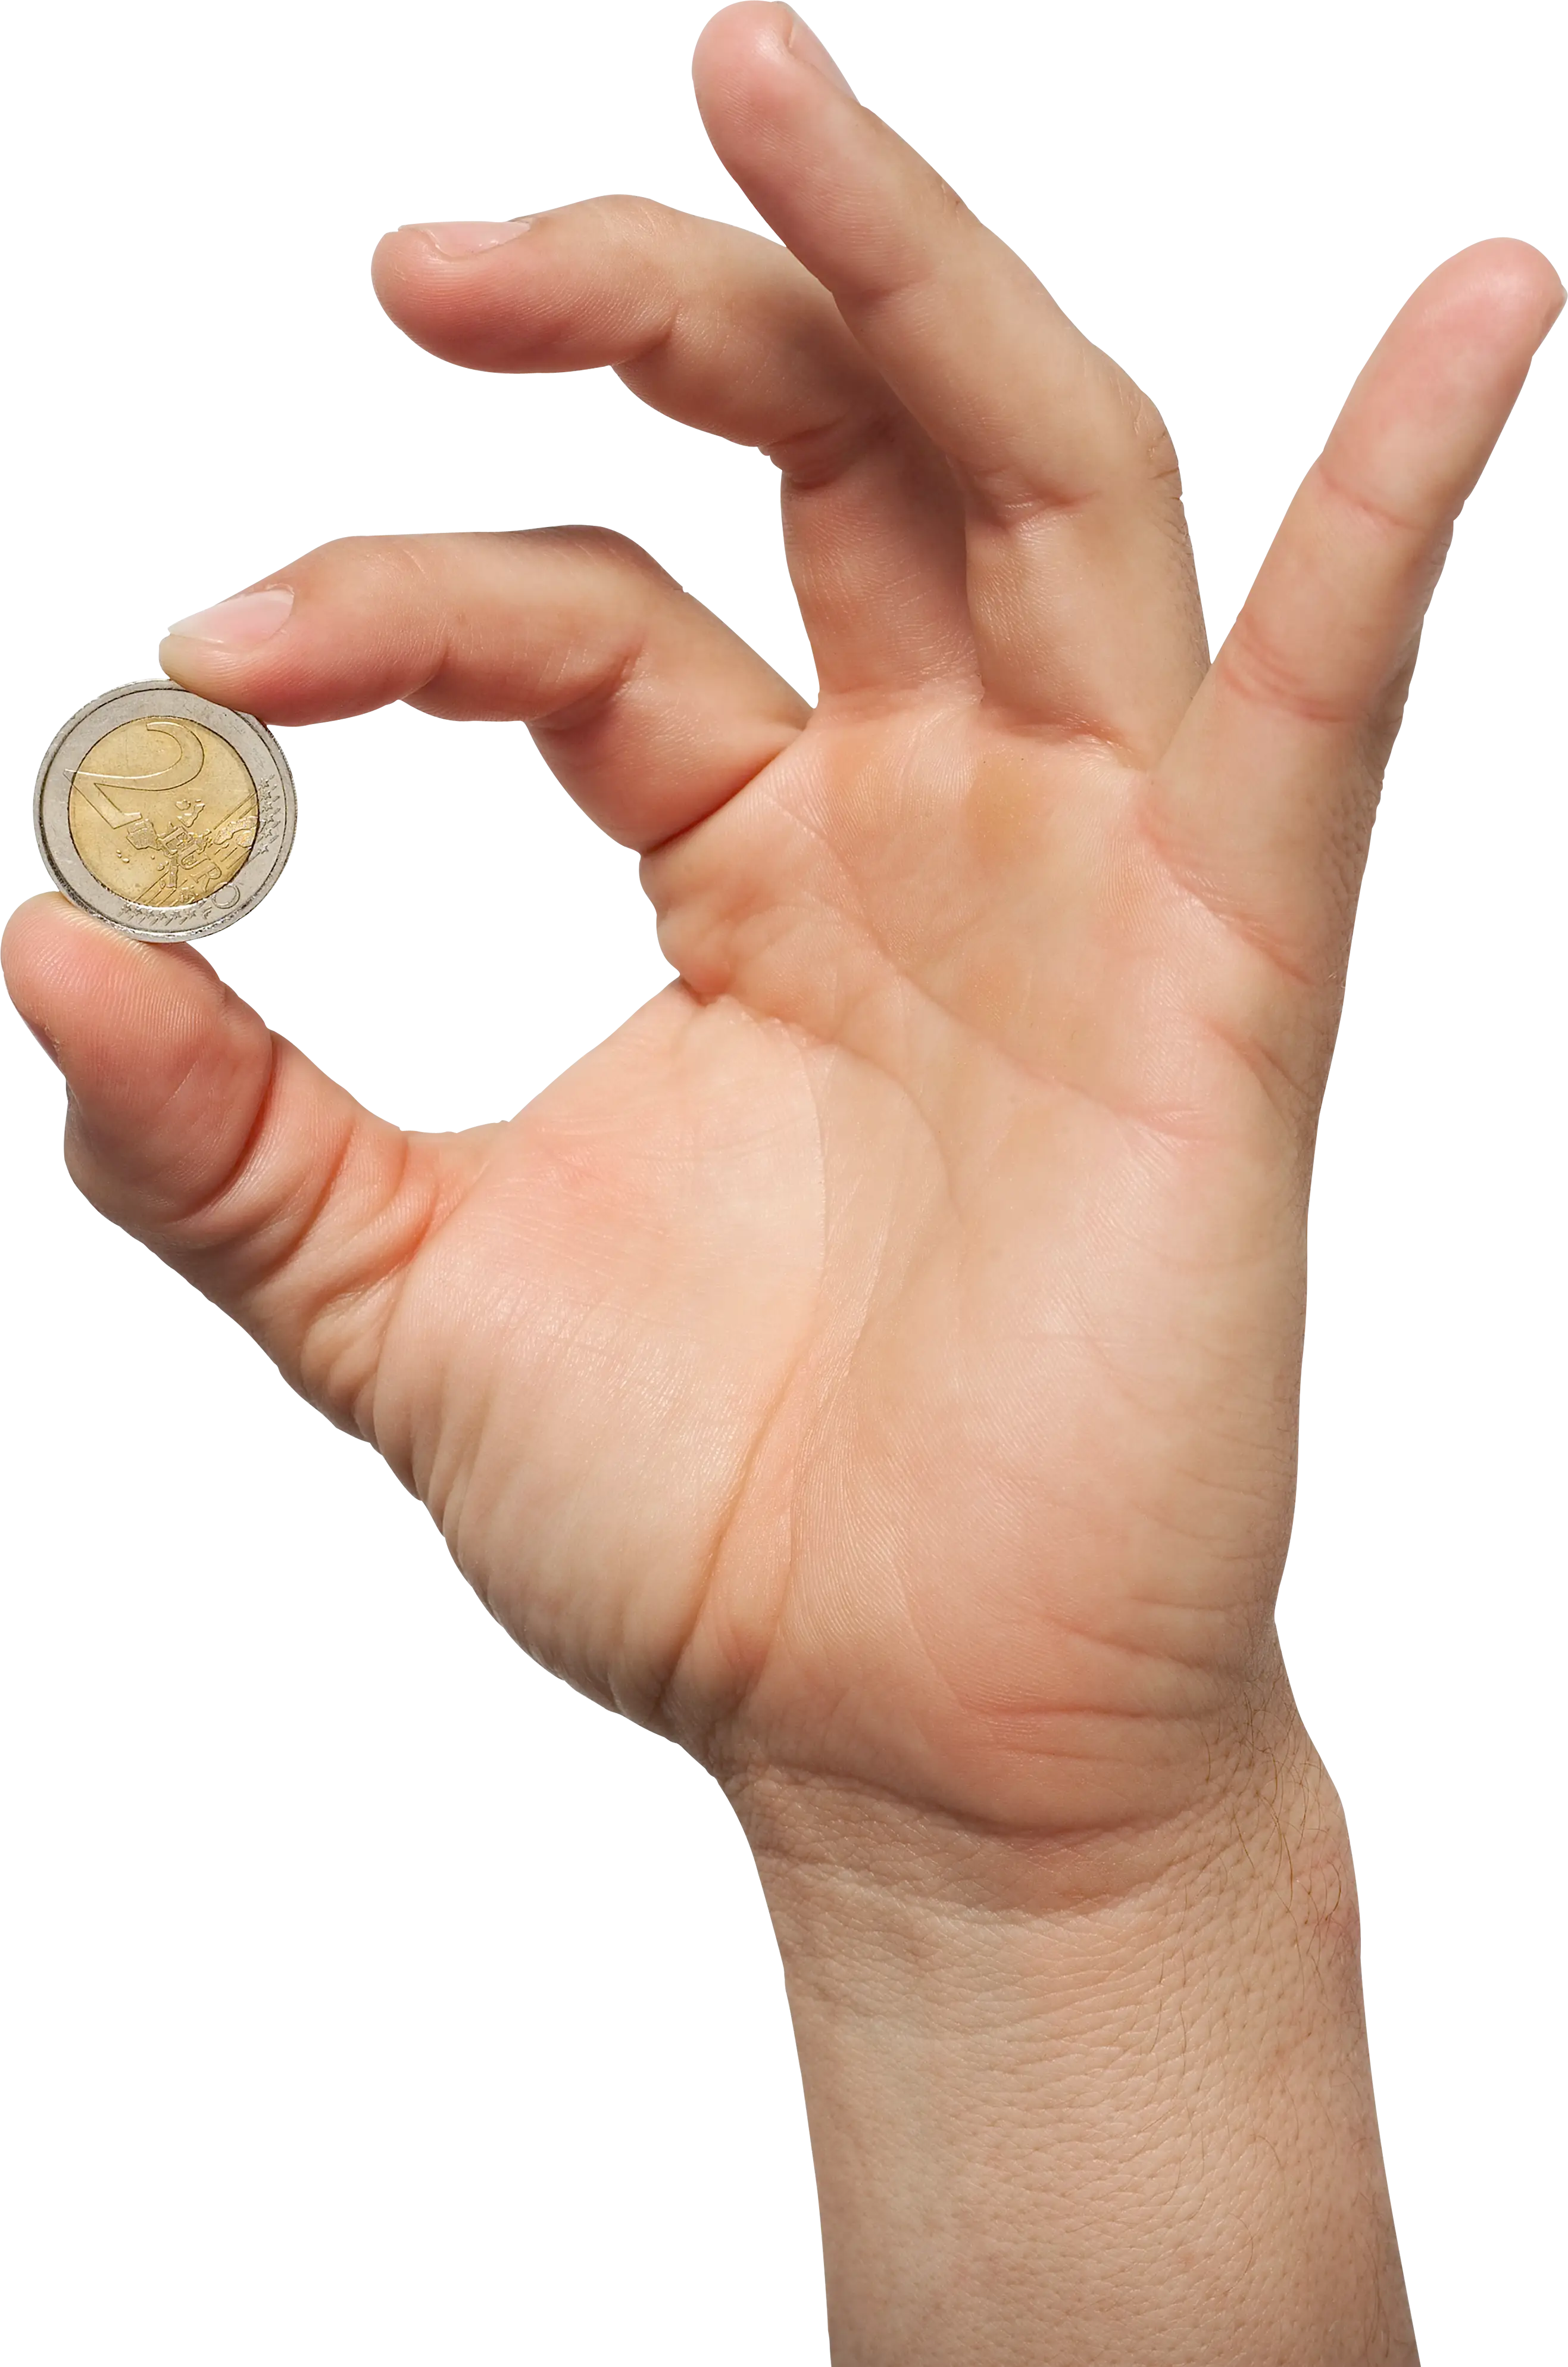
Hand Holding a Coin -

Ziraat Sigorta Insurance Logo -

Dollar Sign Made of Pills -

Magnifying Glass with Blue Lens -

Presentation Board with Graph for Business Concepts -

Golden Bitcoin Cryptocurrency Coin -

Bar Chart with Upward Arrow -

Dollar Sign with Circular Arrows -

Graph Plot with Blue Curve Illustration -
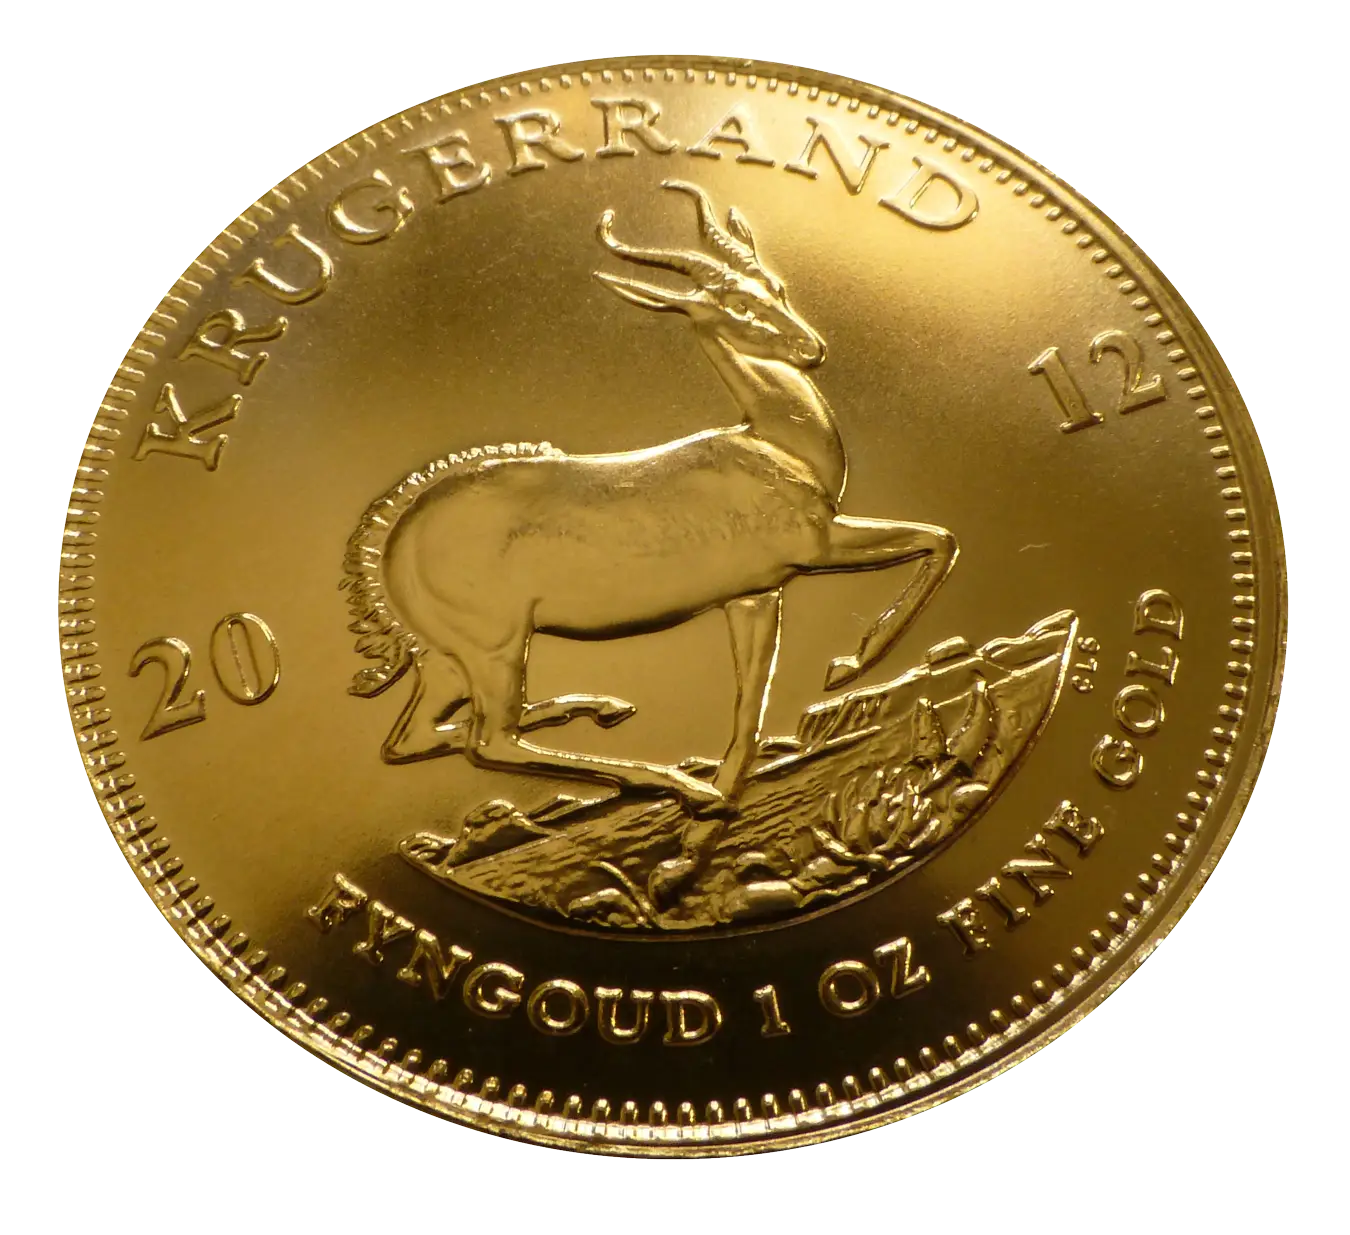
Gold Krugerrand Coin -

Lipa na M-Pesa Paybill Number -
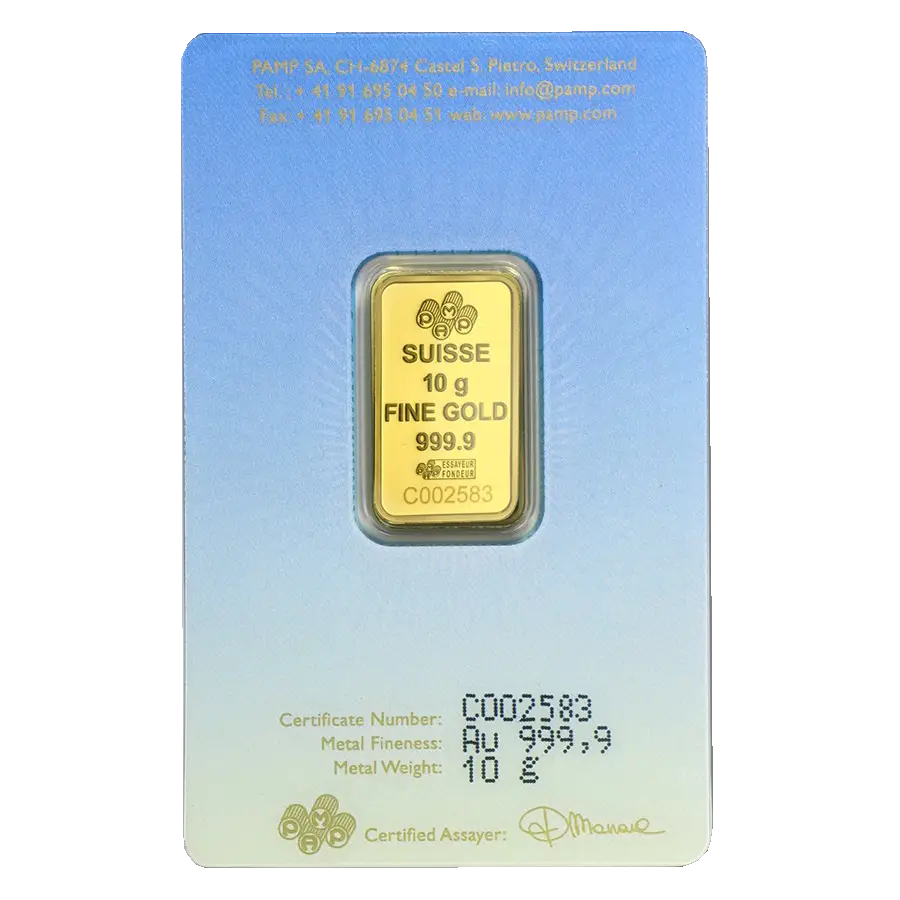
10g Suisse Fine Gold Bar -
Money Bag with Downward Arrows Illustration -

Person Icon with Dollar Sign -

Naira Currency Symbol -

Circle Pie Chart Icon -

Dollar Symbol Icon in Black Outline -

Yen Sign on Price Tag in Blue Neon Style -

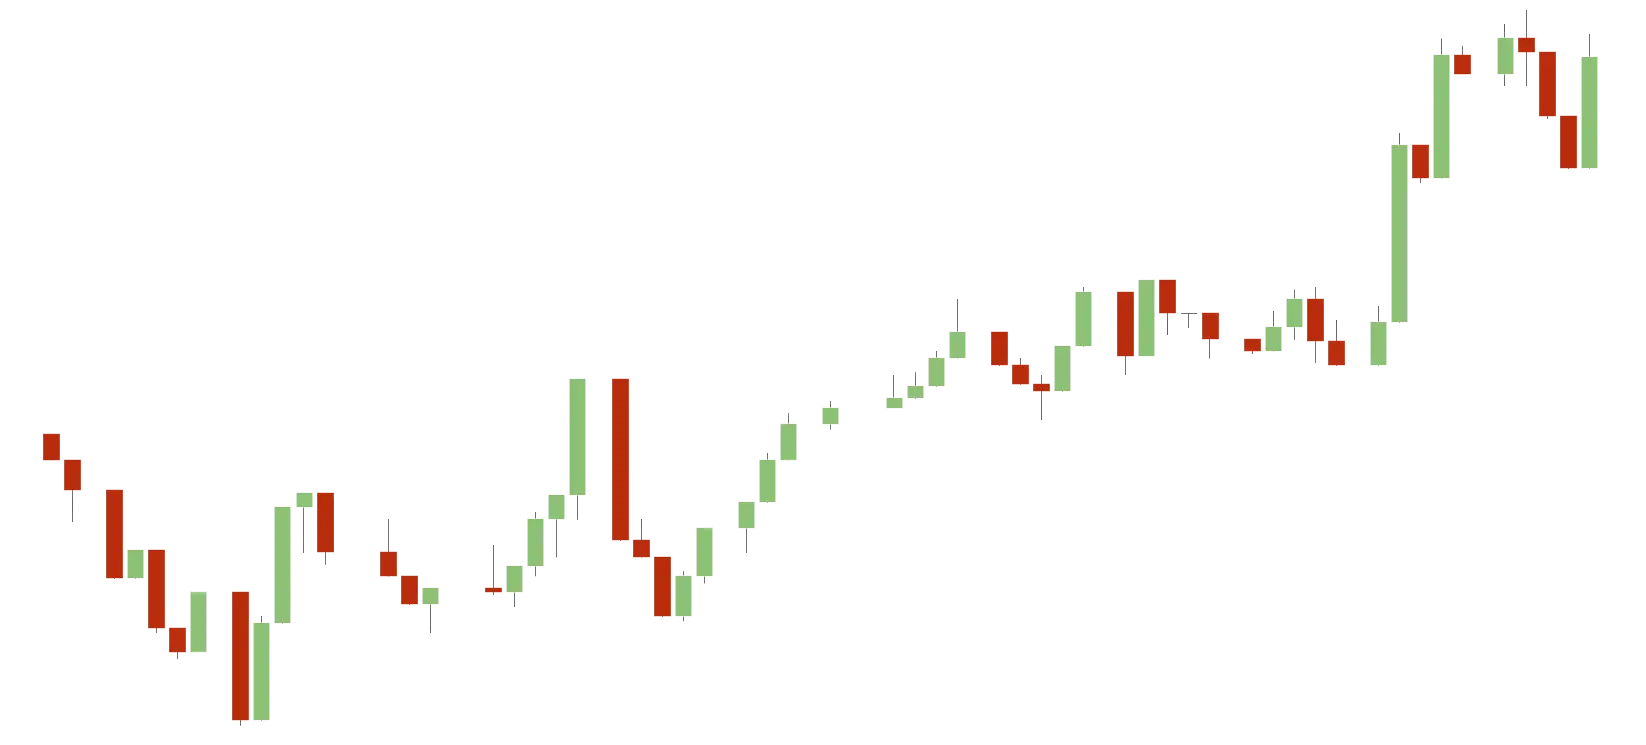
Bull Market Symbol -

House with Dollar Sign Symbol -
Check and Pen Icon for Financial Transactions -

Declining Chart Illustration -
Gold Australian Dollar Currency Symbol -

Dollar Sign Icon Representing Finance -

Book Icon with Blue Background -
National Bank Logo with Red Flag