You Might Like
-

White Cloud Blur Graphic Element -

Blue Spiral Pattern Design -

Black Wave Symbol -

Purple Crescent Moon on Clear Background -
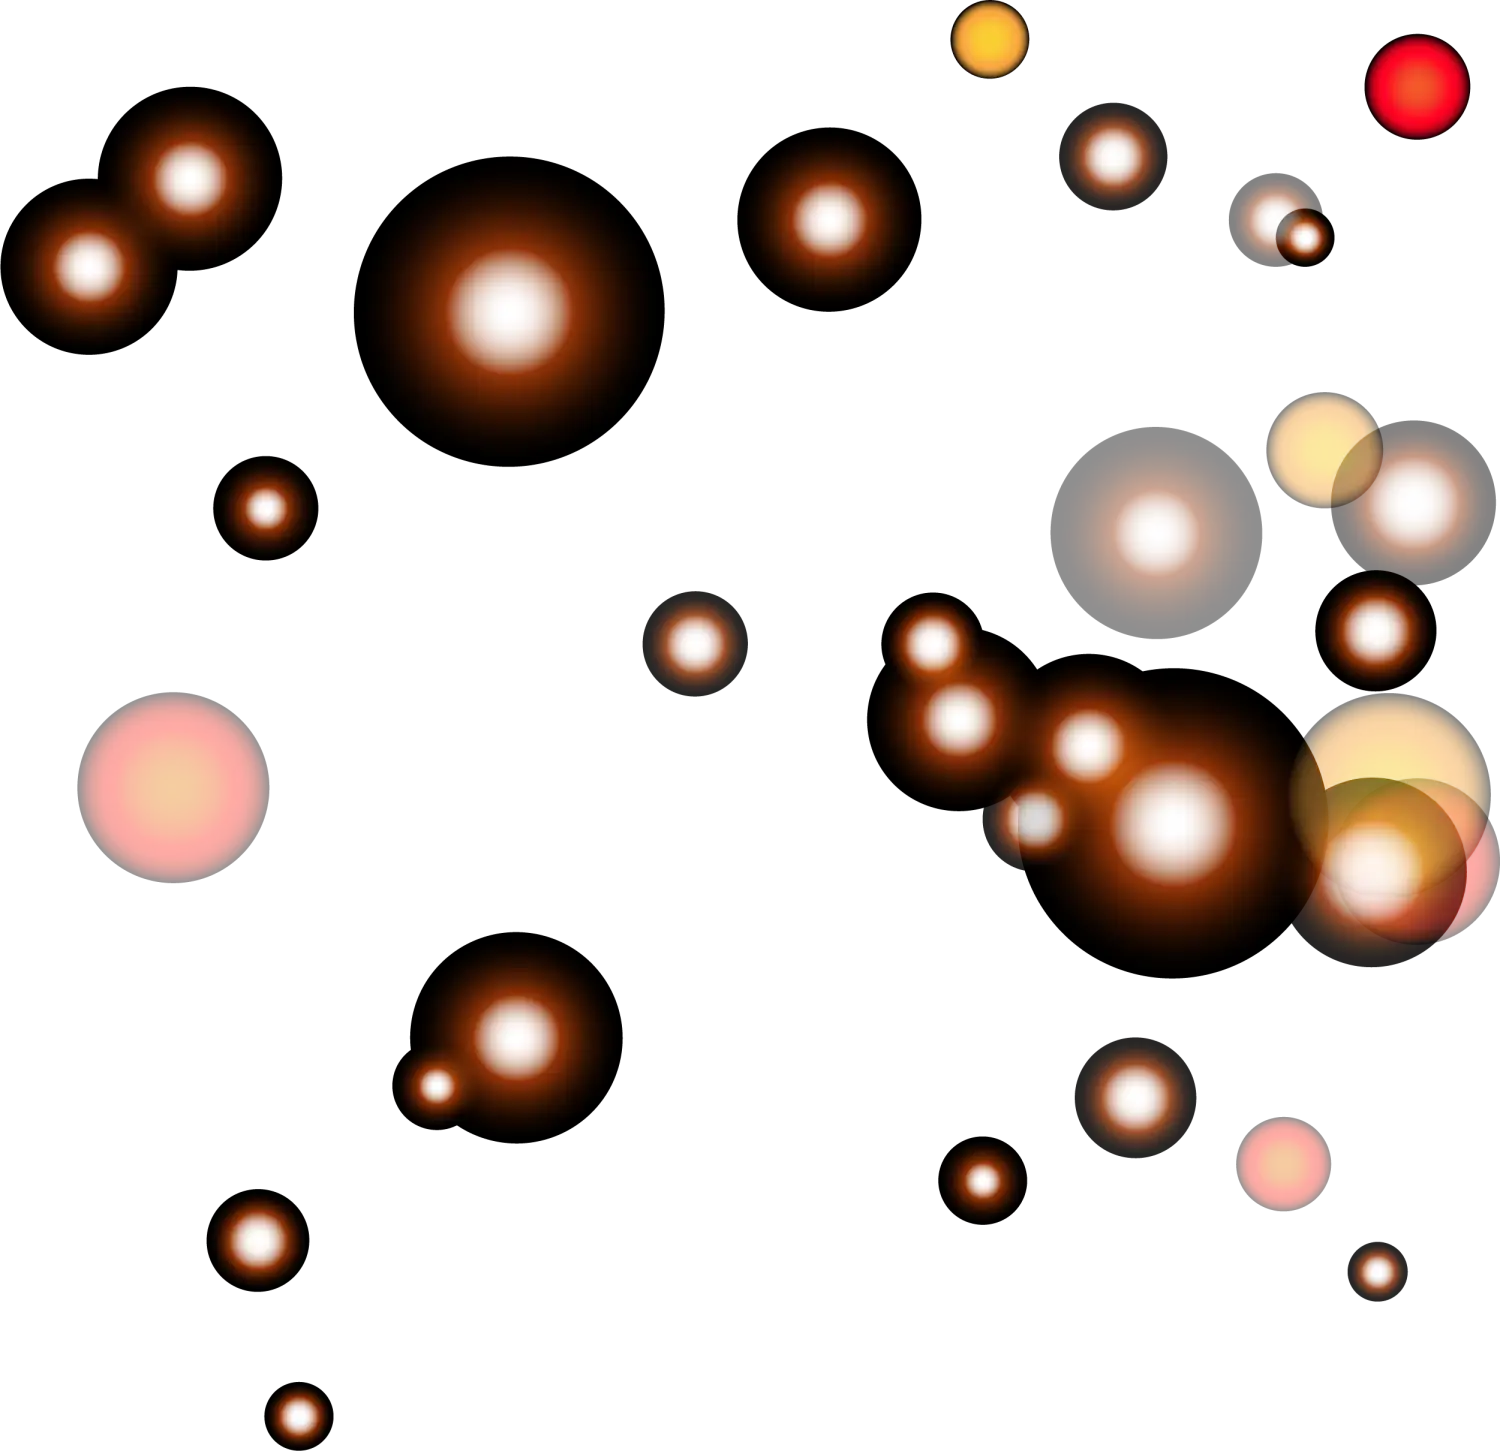
Floating Bubbles in Artistic Design -

Yellow Starburst Shape Illustration -

Stylish Black Wreath with Simple Leaf Motif -
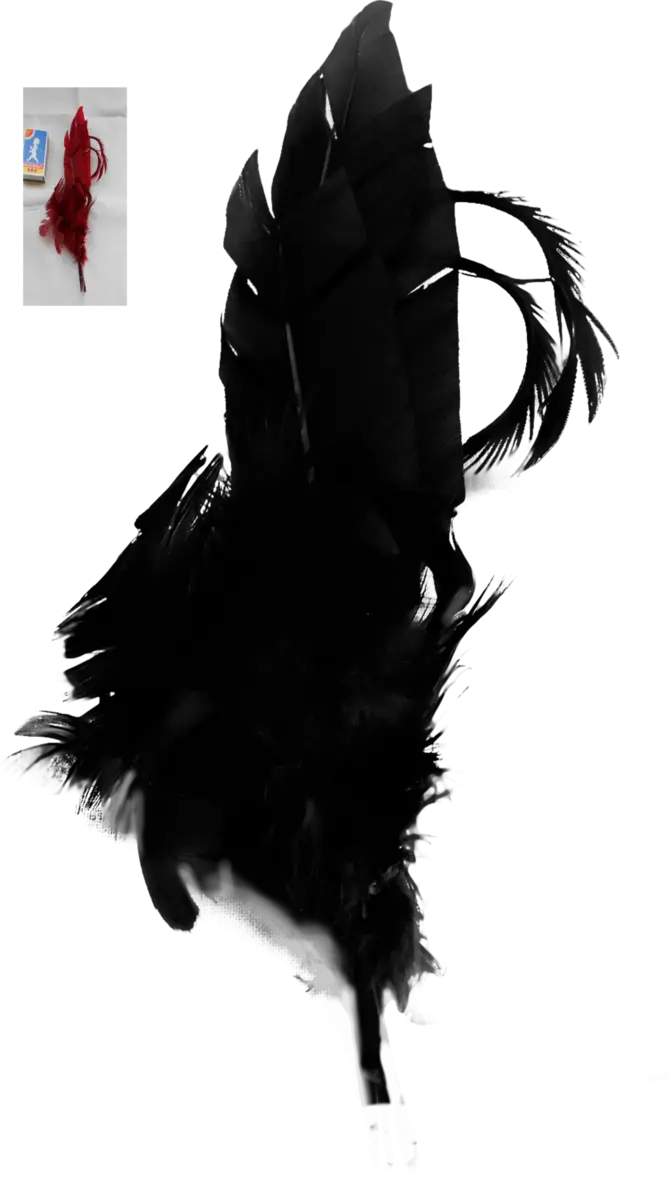
Black Feather with Plume and Dark Appearance -

Colorful Abstract Graphic Design -

Black V Symbol -

Simple Silhouette of a Human Figure -

Black Mandala Decorative Pattern Design -
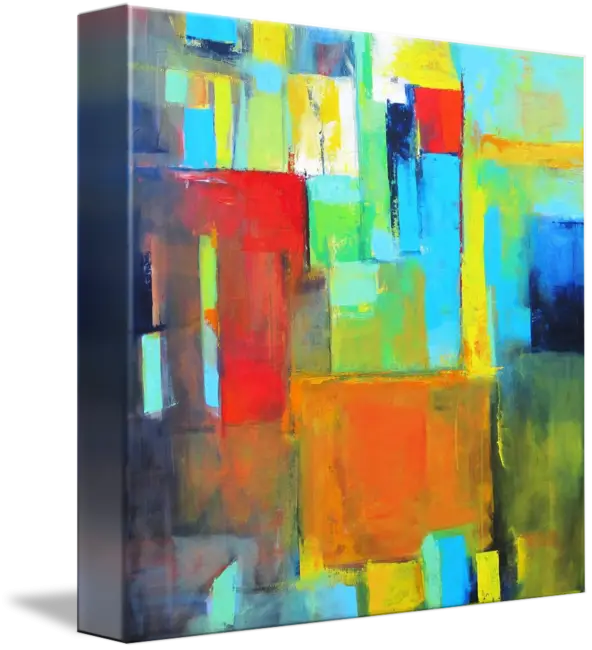
Colorful Abstract Painting with Geometric Shapes -

Black Angle Brackets Symbol -

Bright Yellow Stars Illustration -

Colorful Stained Glass Heart -
Colorful Geometric Sphere -

Abstract Colorful Geometric Design -

Abstract Geometric Design -
Collapsing Building with Debris and Running Person -

Ornate Black Frame with Intricate Design -

Abstract Blue Flame Icon Design -
Black and White Mandala Design Outline -
Patterned Lion Design -

Vibrant and Colorful Butterfly Illustration -
Colorful Watercolor Flowers -

Broken Sword Icon -

Grunge Black Hearts -

Symbolic Black Wings Silhouette -
Colorful Photo Frames