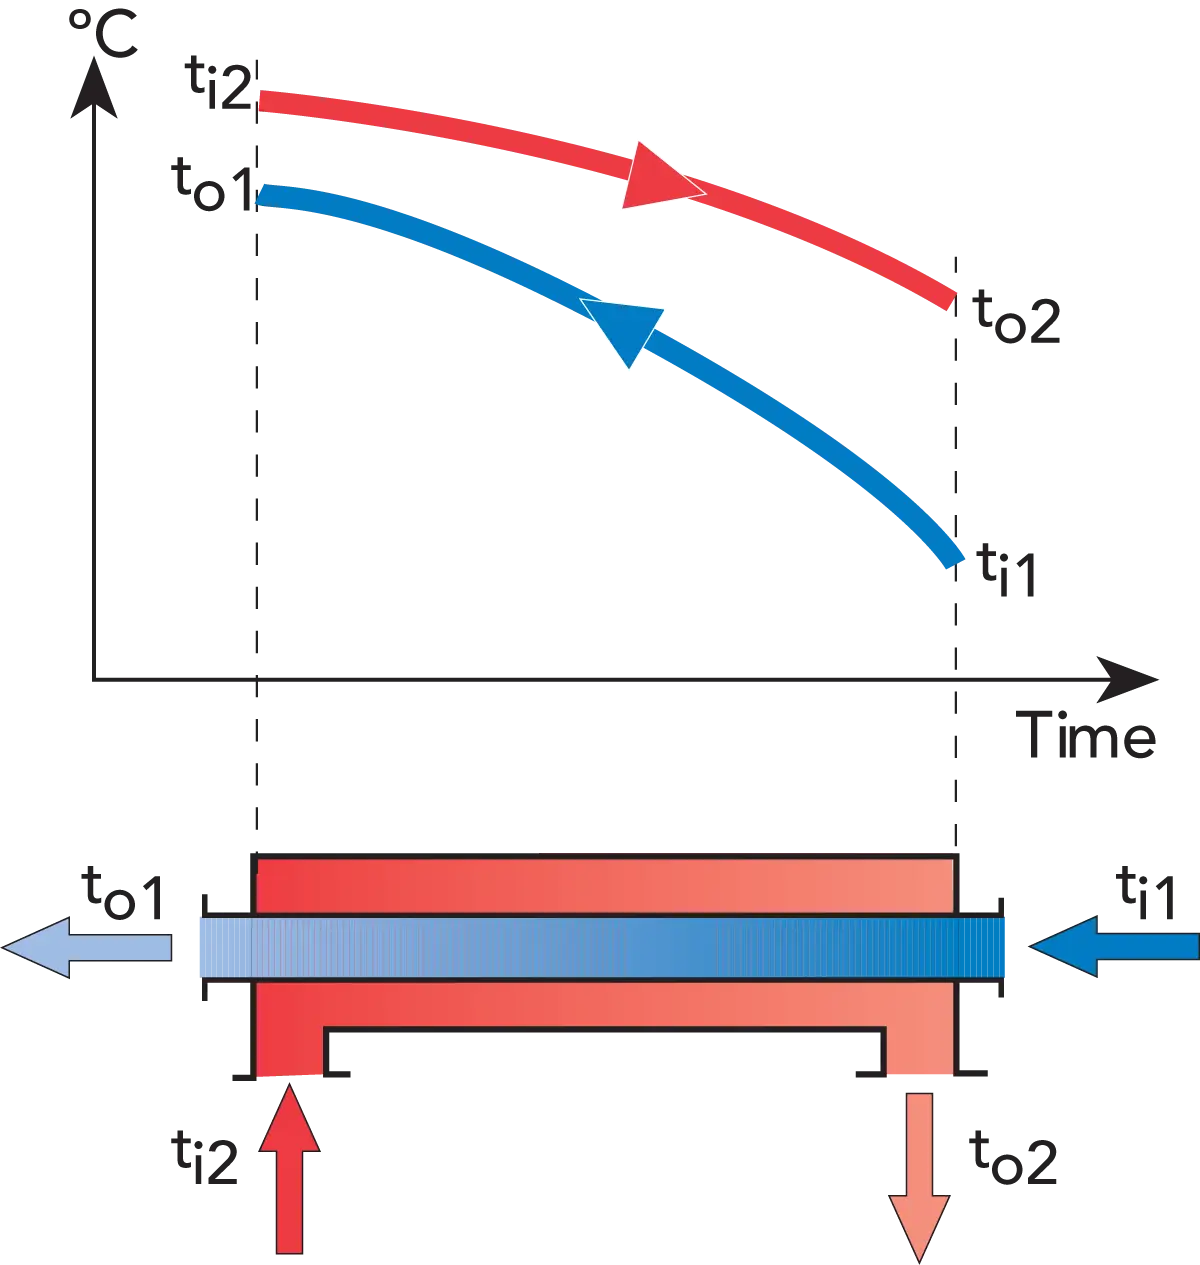
Illustrative Graph of Fluid Temperature Changes and Heat Exchange in a Counter-Flow System
Temperature Change Over Time Graph
This image effectively visualizes the principles of heat transfer within a counter-flow heat exchanger. The upper section presents a clear graph depicting the temperature changes of two fluids: a hot fluid (represented by the red line) undergoing a temperature decrease, and a cold fluid (the blue line) experiencing a temperature increase. These temperature variations are shown along the heat transfer length or area of the exchanger. Below the graph, a concise schematic illustrates the physical arrangement of a double-pipe heat exchanger in a counter-flow configuration, with arrows clearly indicating the inlet and outlet paths for both the hot and cold fluid streams. This diagram highlights how fluids flow in opposite directions to optimize the heat exchange process.