You Might Like
-
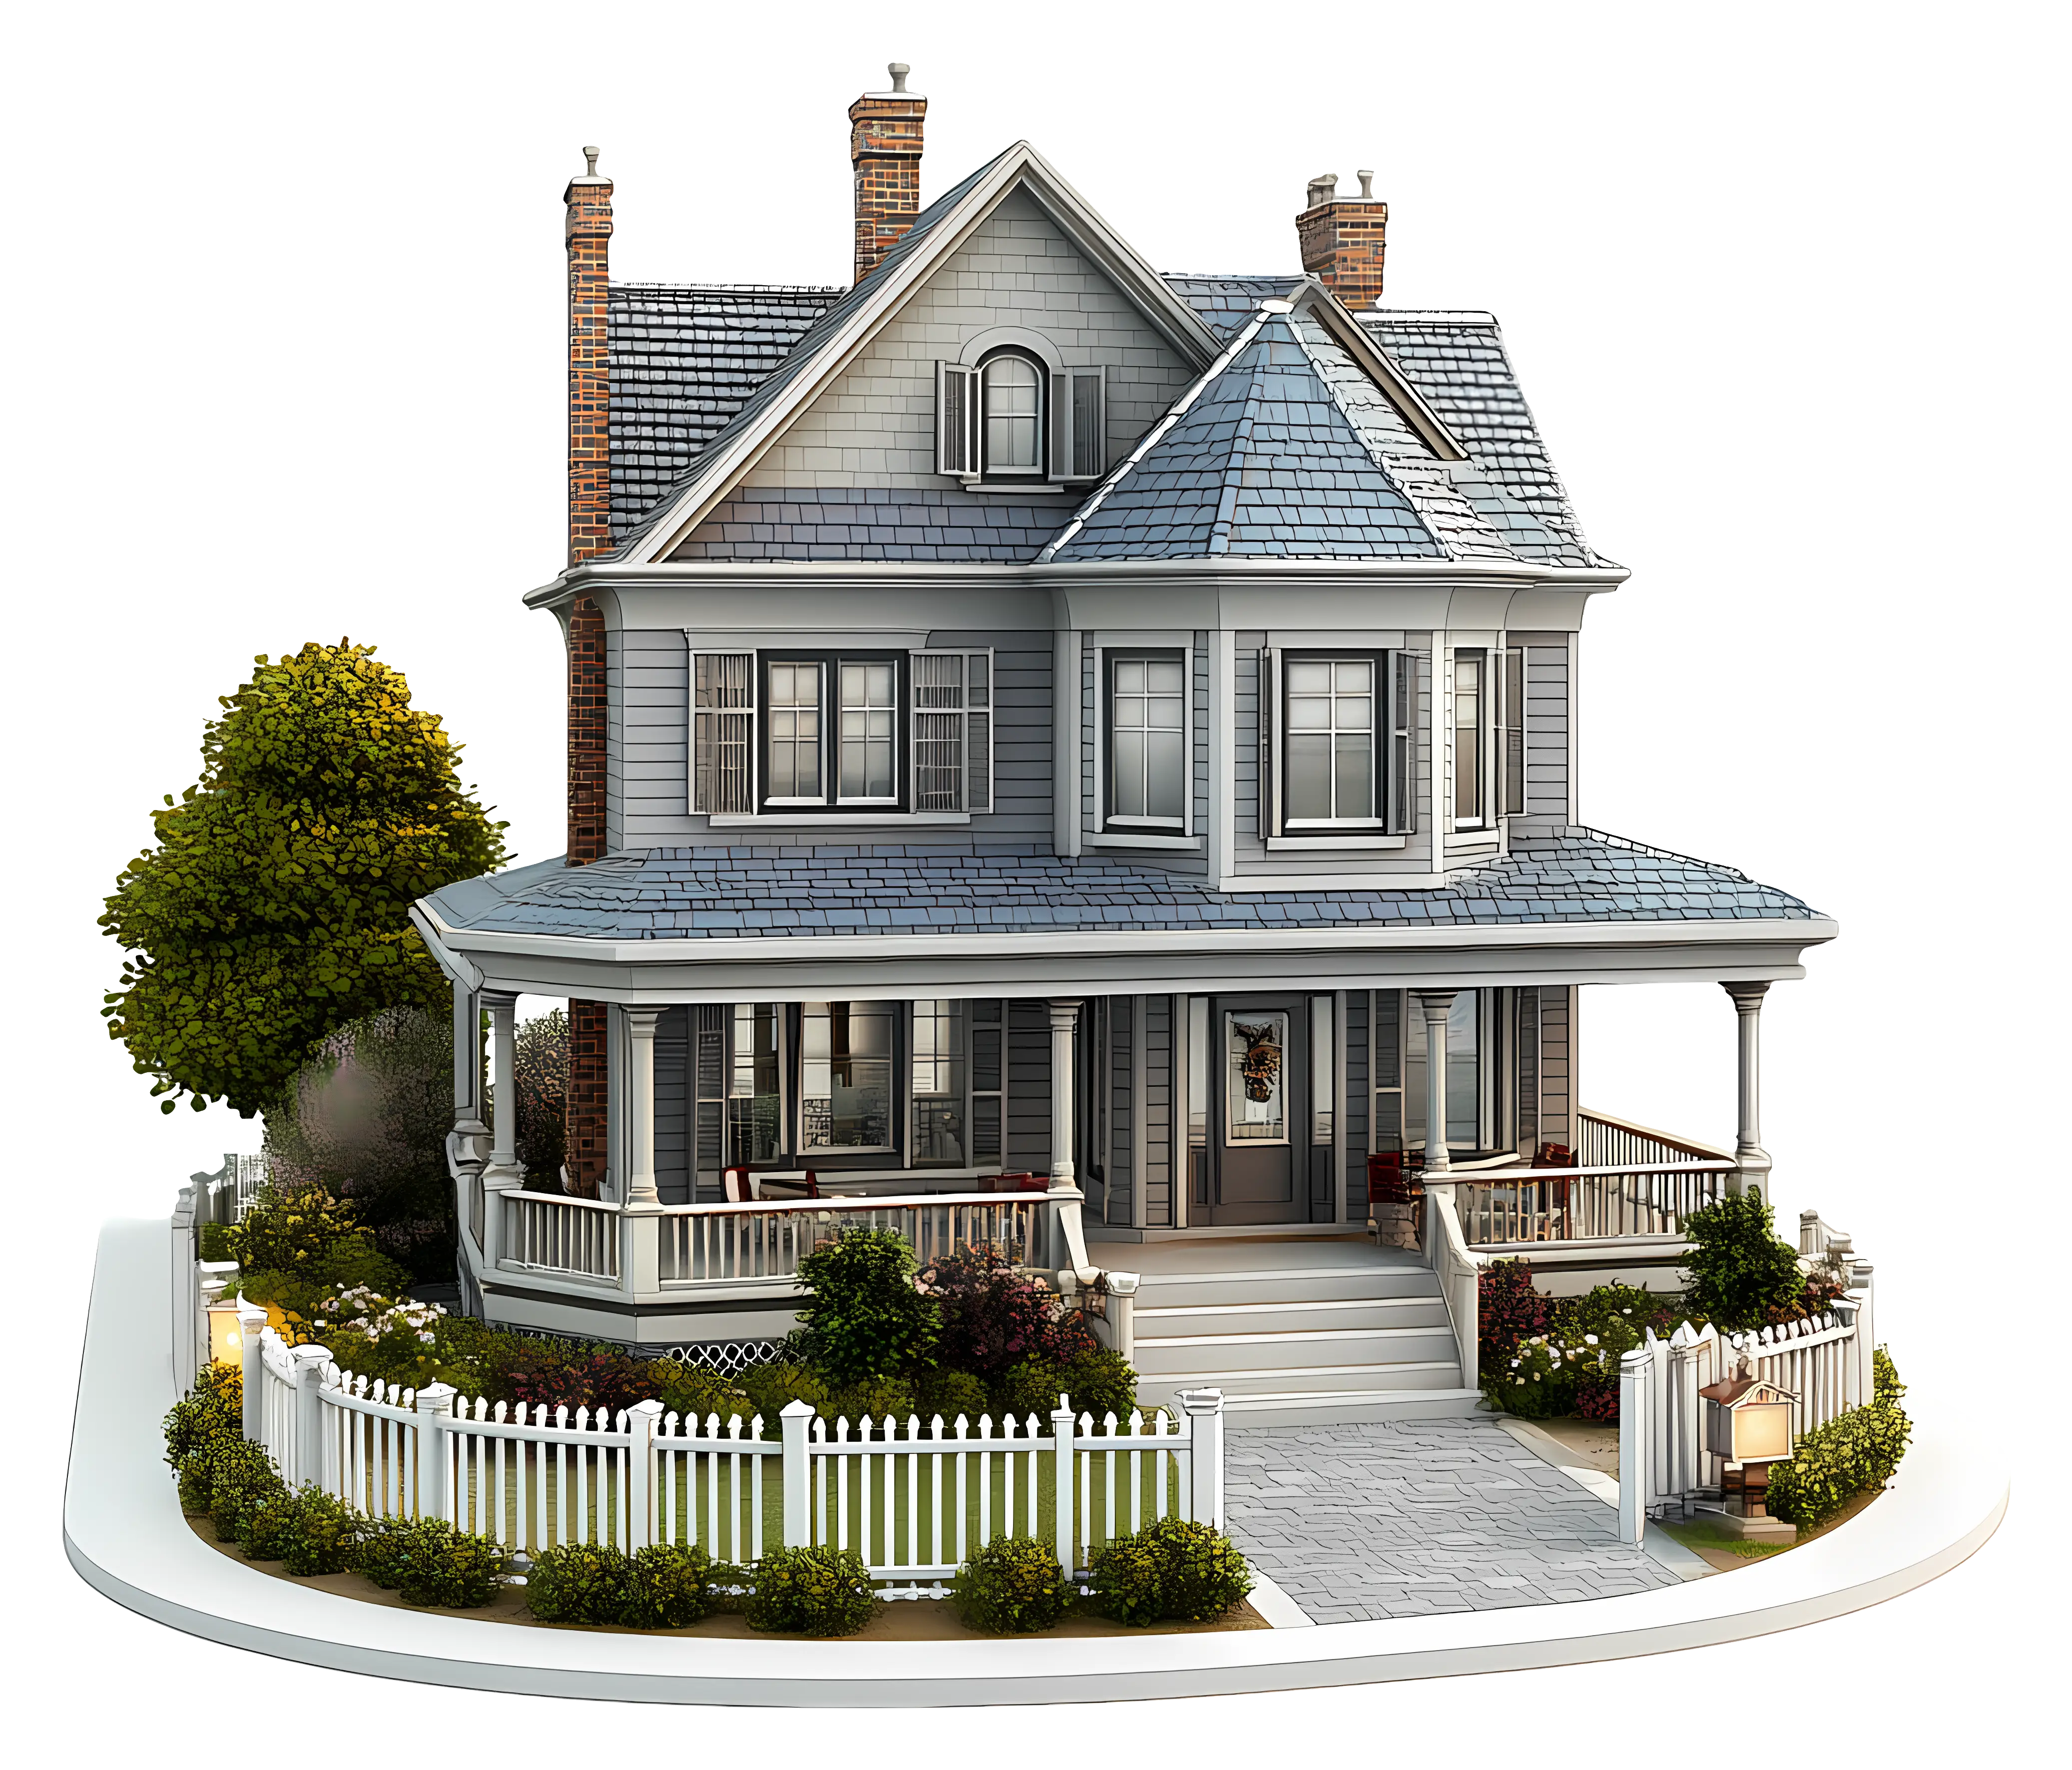
Charming House with Garden Illustration -

Colorful Broom for Cleaning -
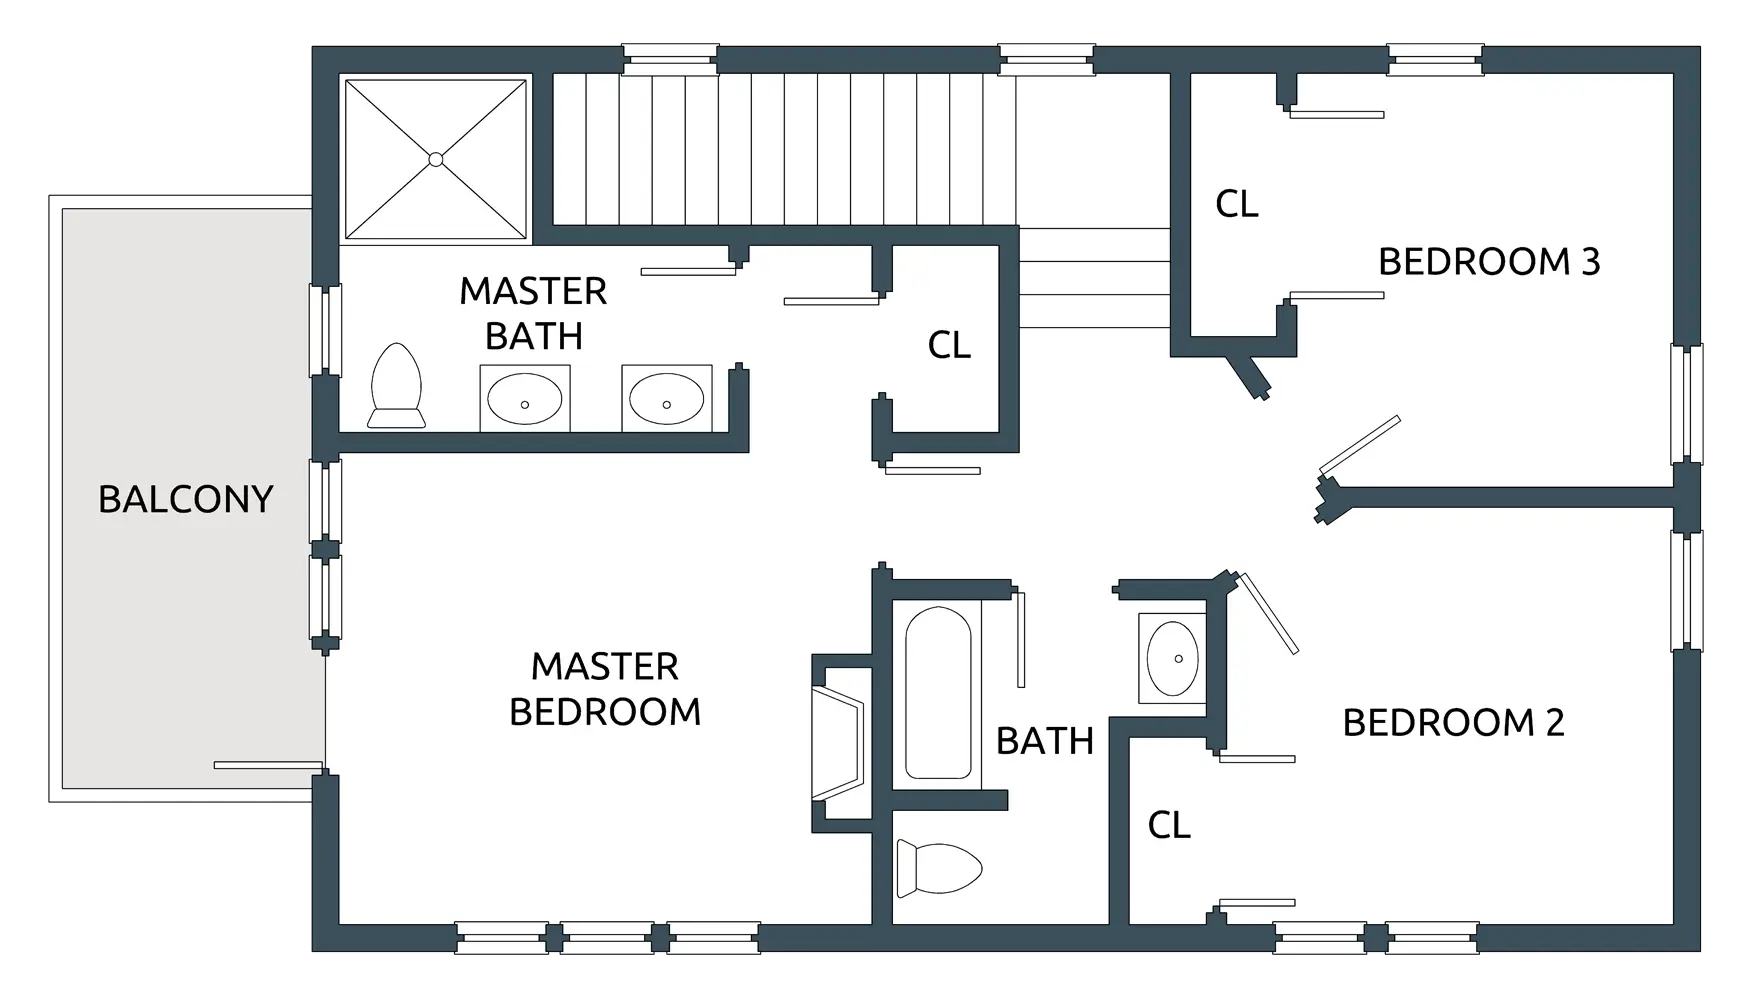
House Floor Plan with Three Bedrooms -
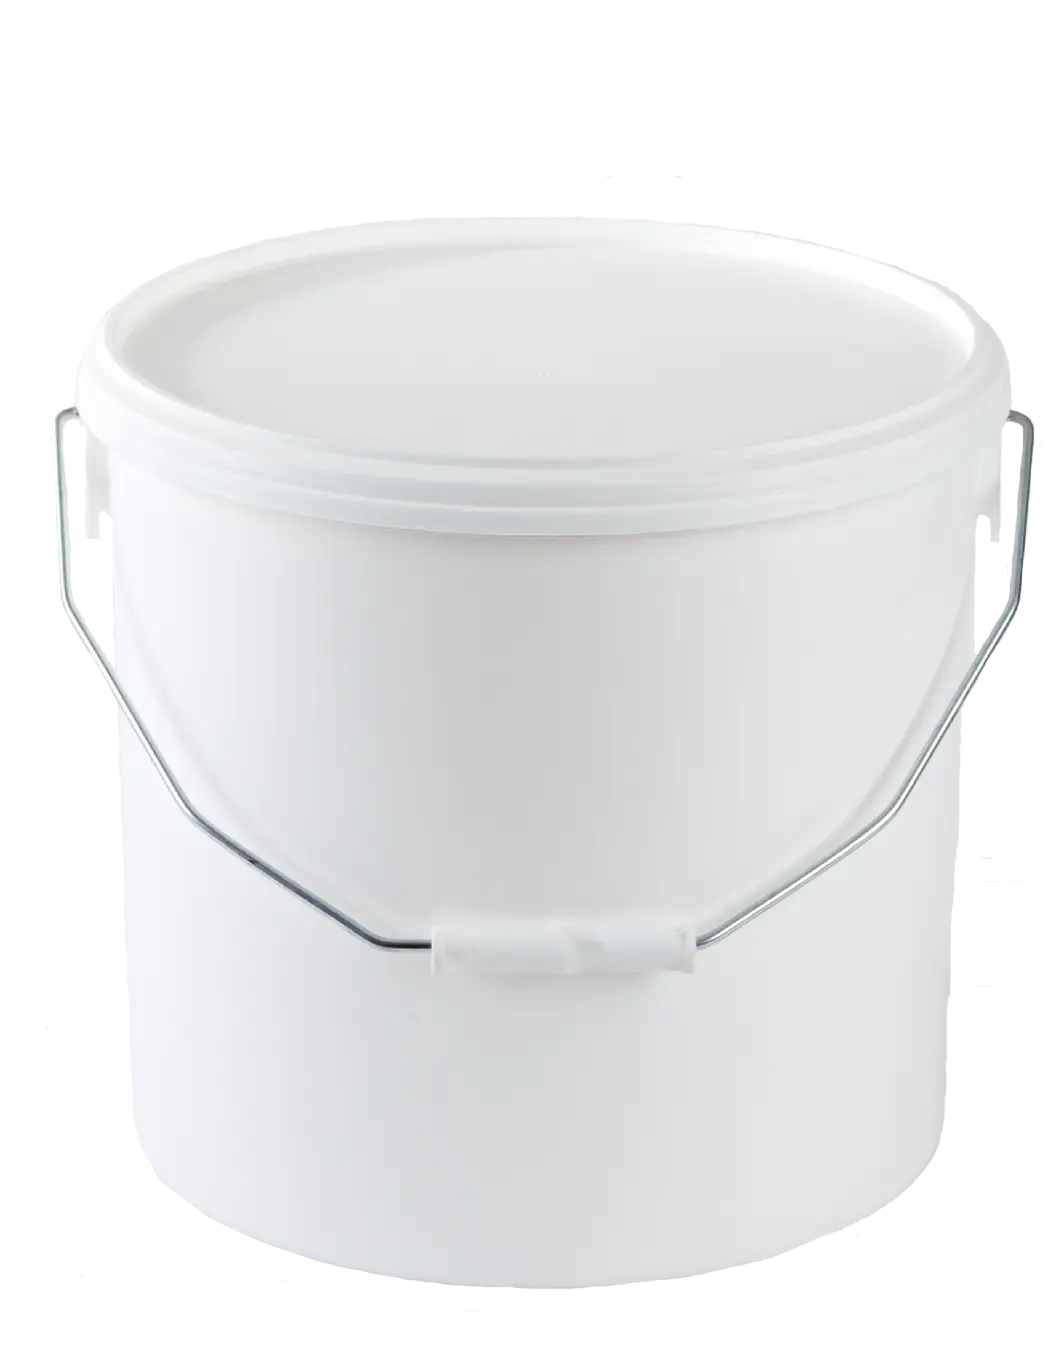
White Plastic Bucket with Handle -
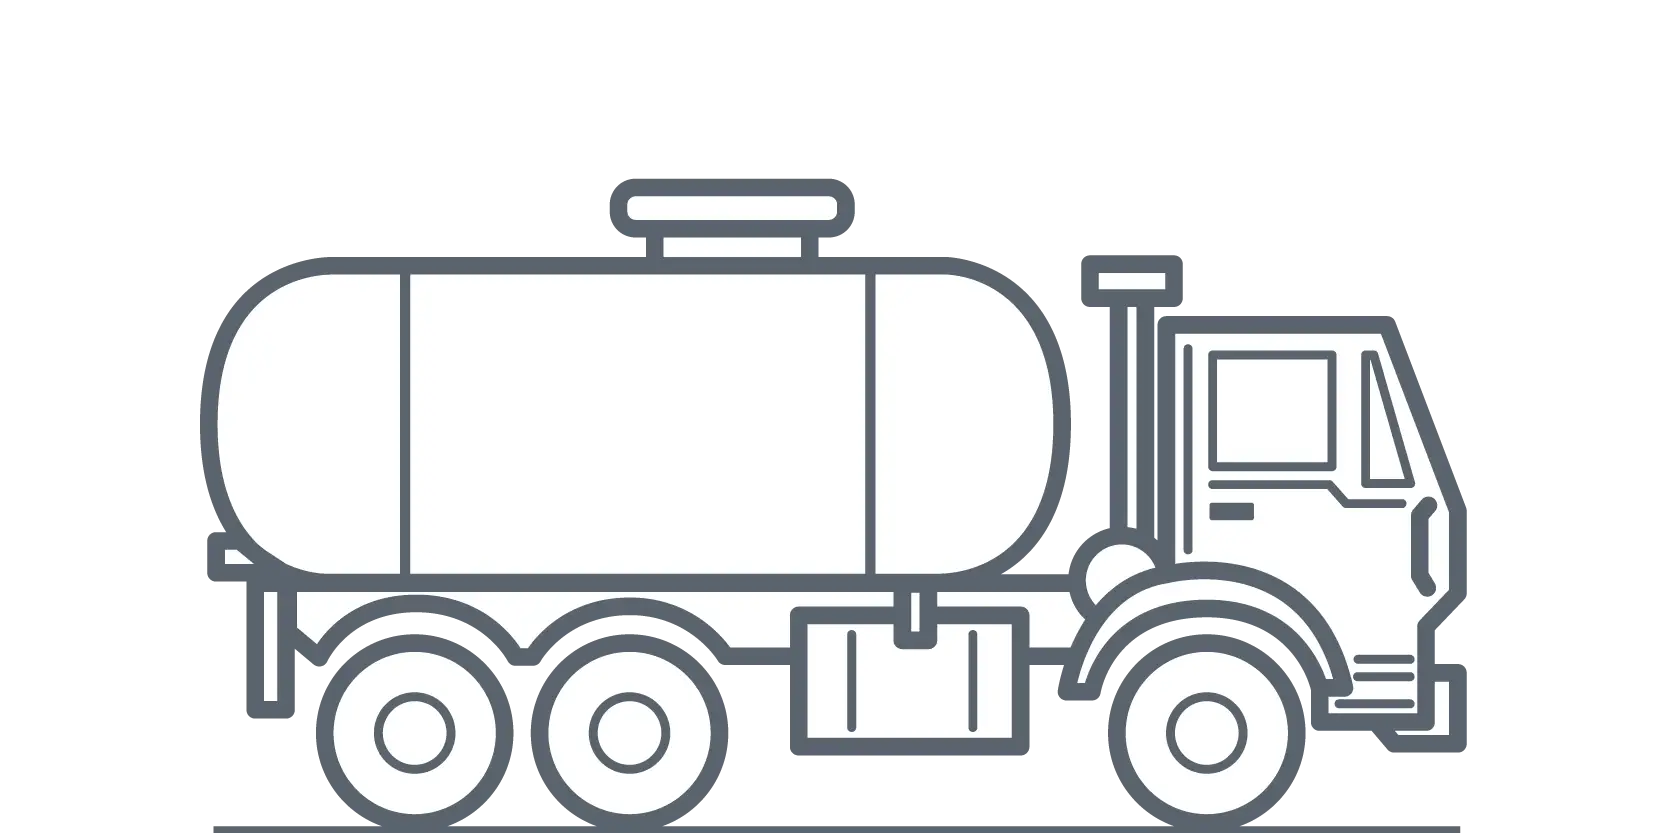
Tanker Truck Illustration in Outline Style -
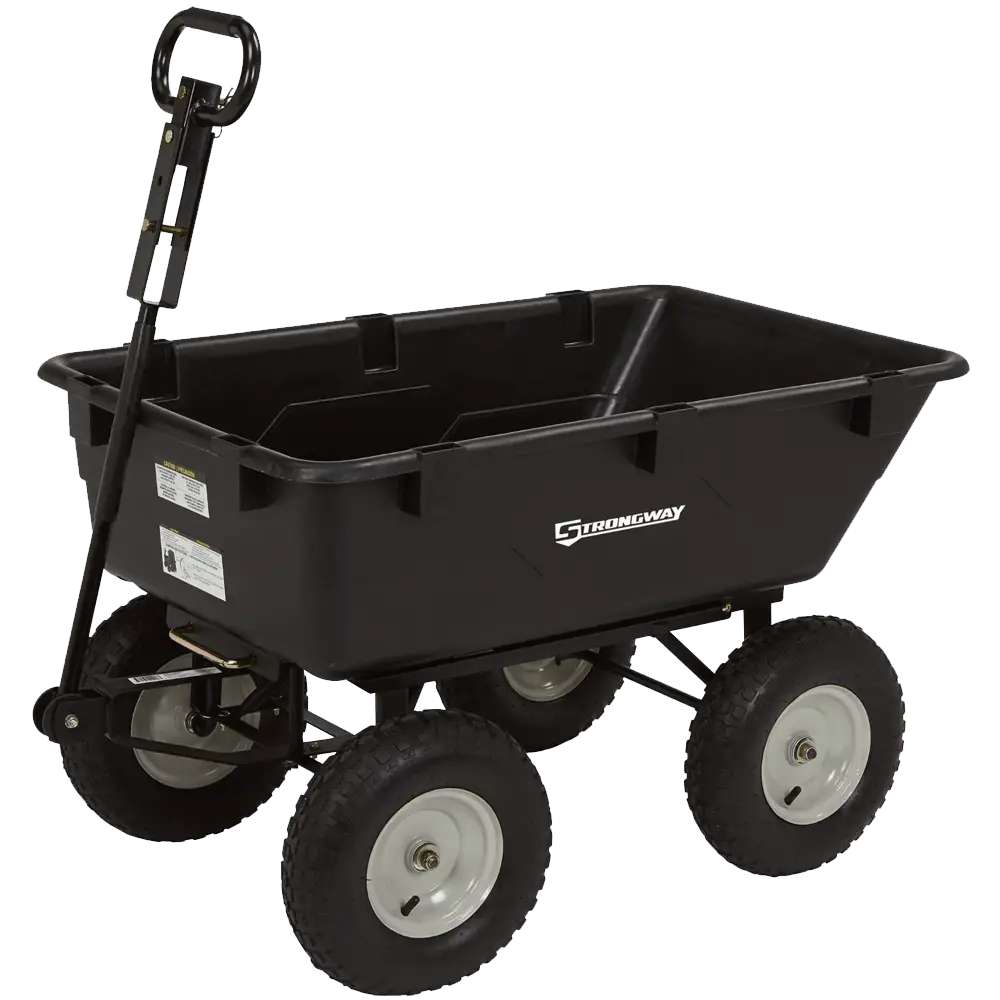
Black Garden Cart with Handle -
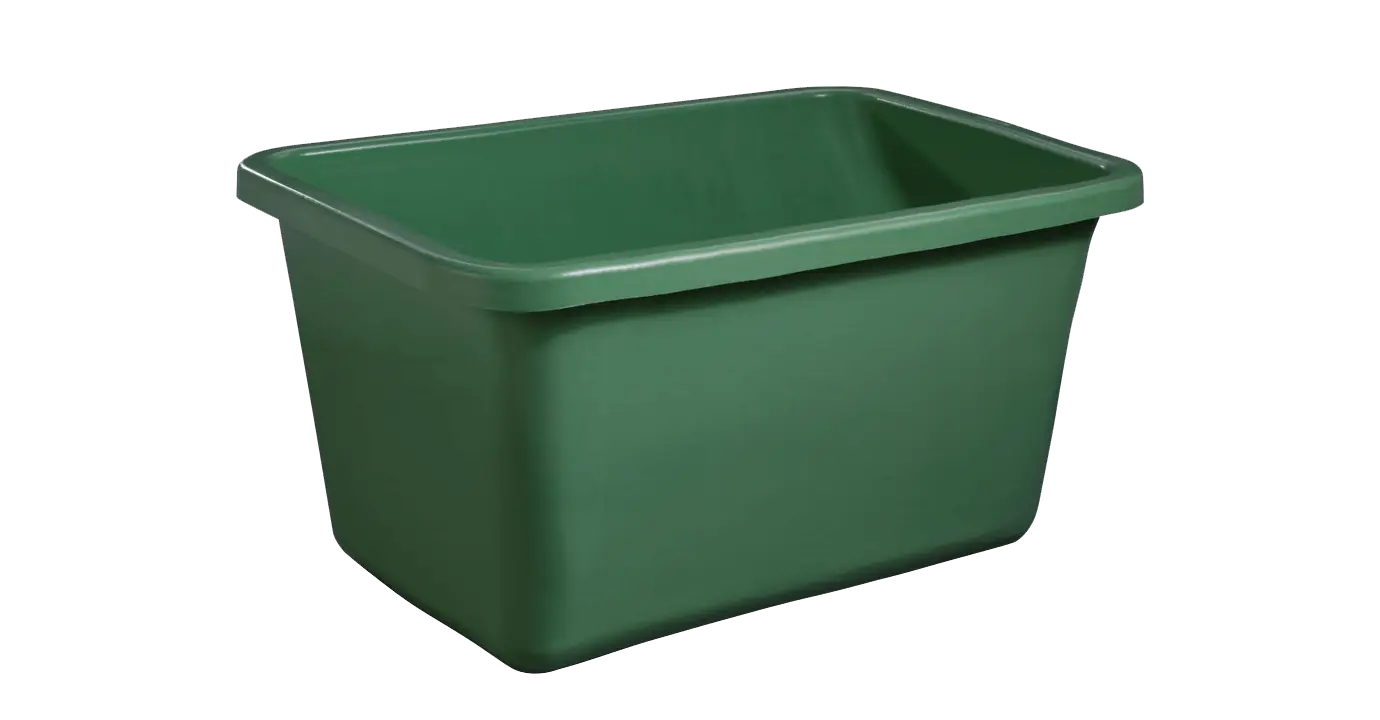
Green Plastic Bin for Household Storage -
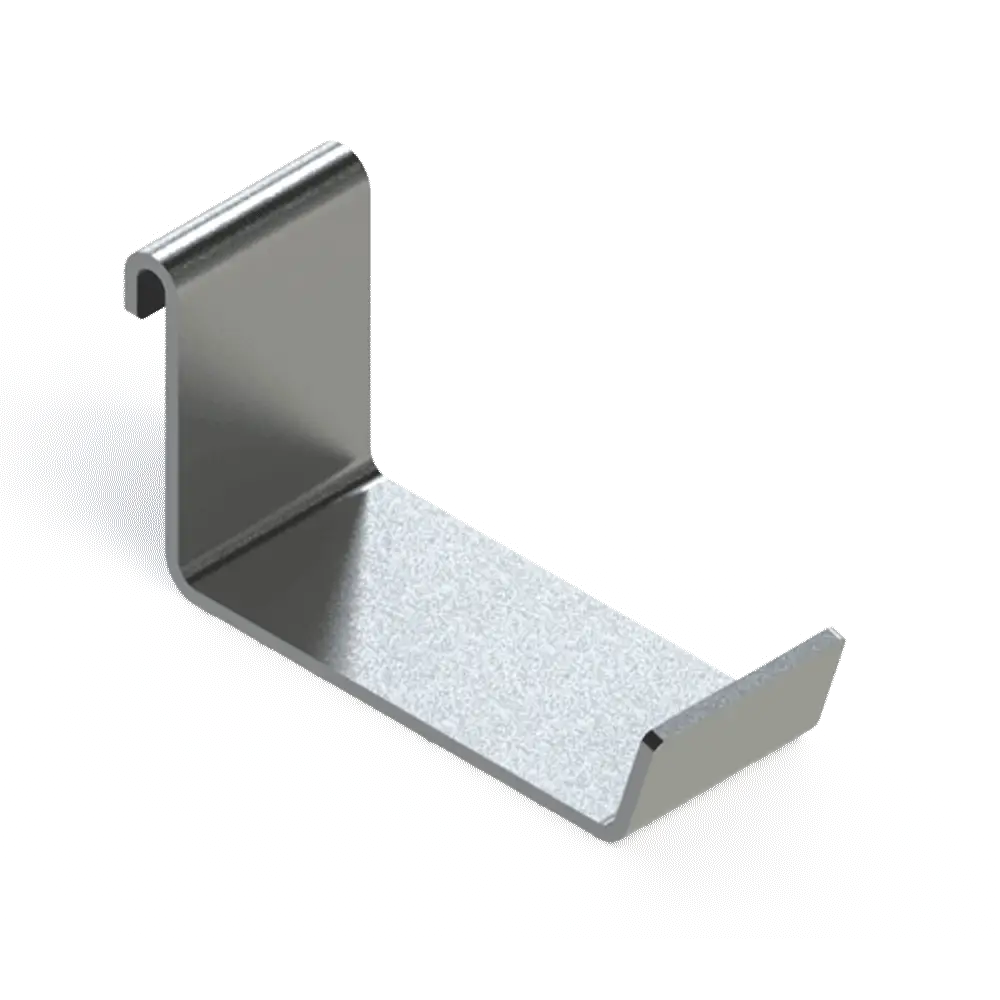
Metal Hook for Hanging -

Modern Toilet Fixture with Flush System -
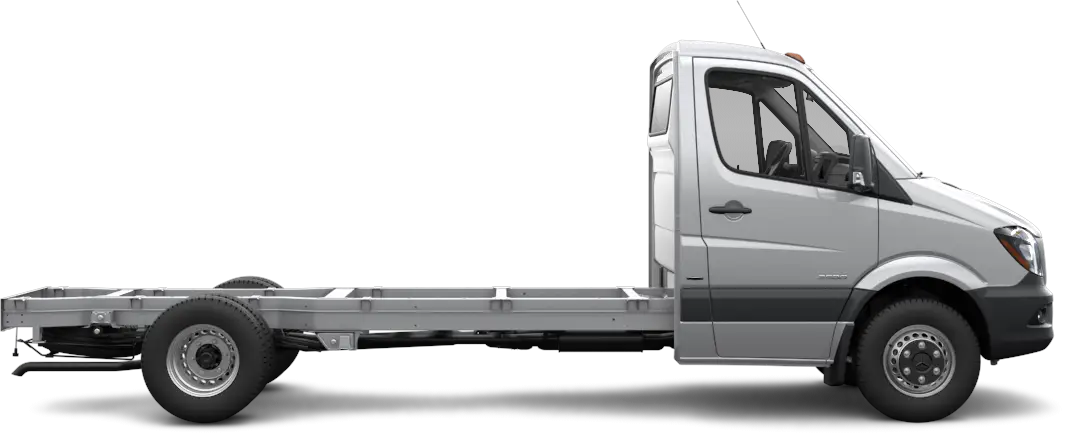
Minimalistic Chassis Truck Vehicle Frame -

Transportation Logistics with Global Shipment -
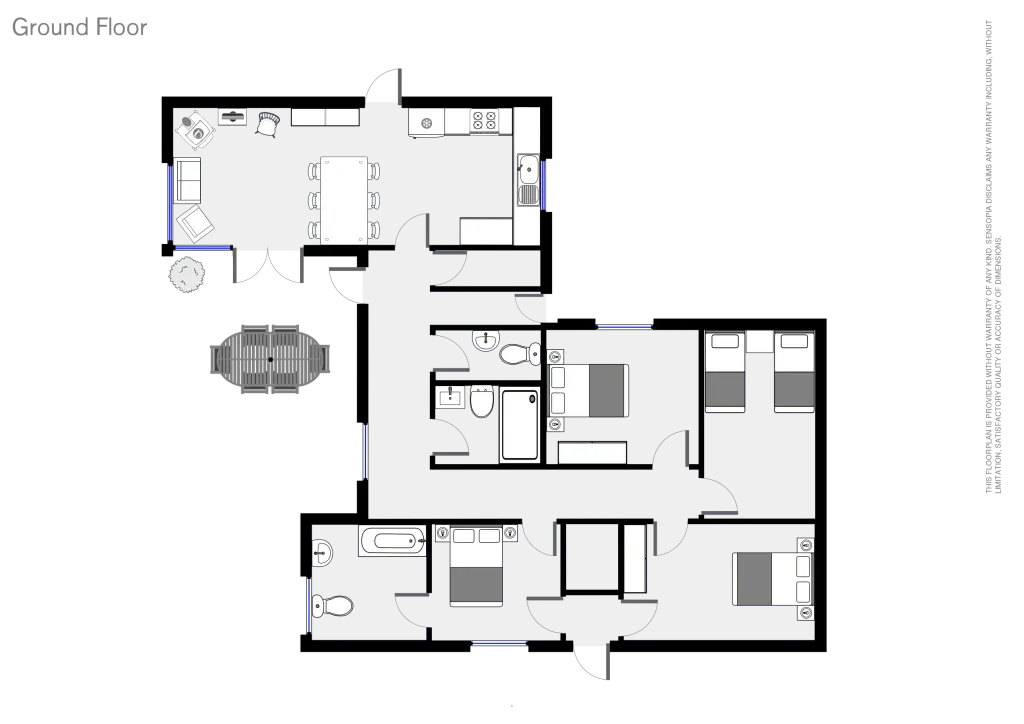
Ground Floor Plan Diagram Illustration -
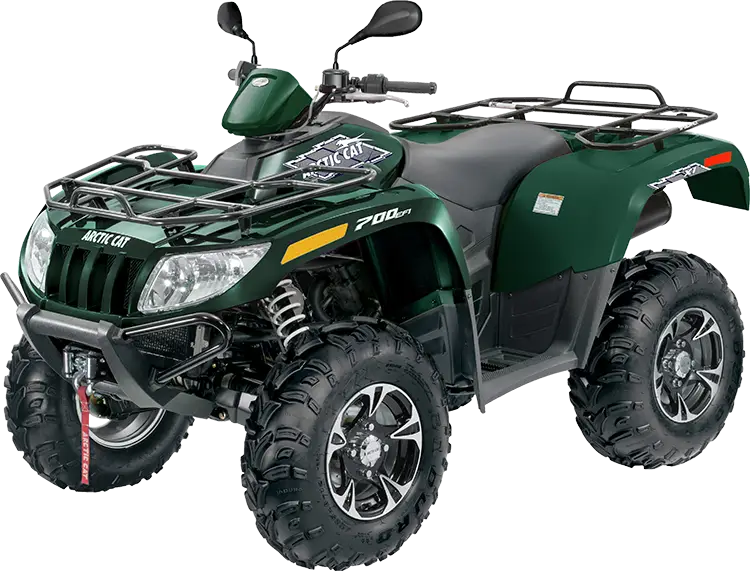
Green All-Terrain Vehicle for Off-Roading -
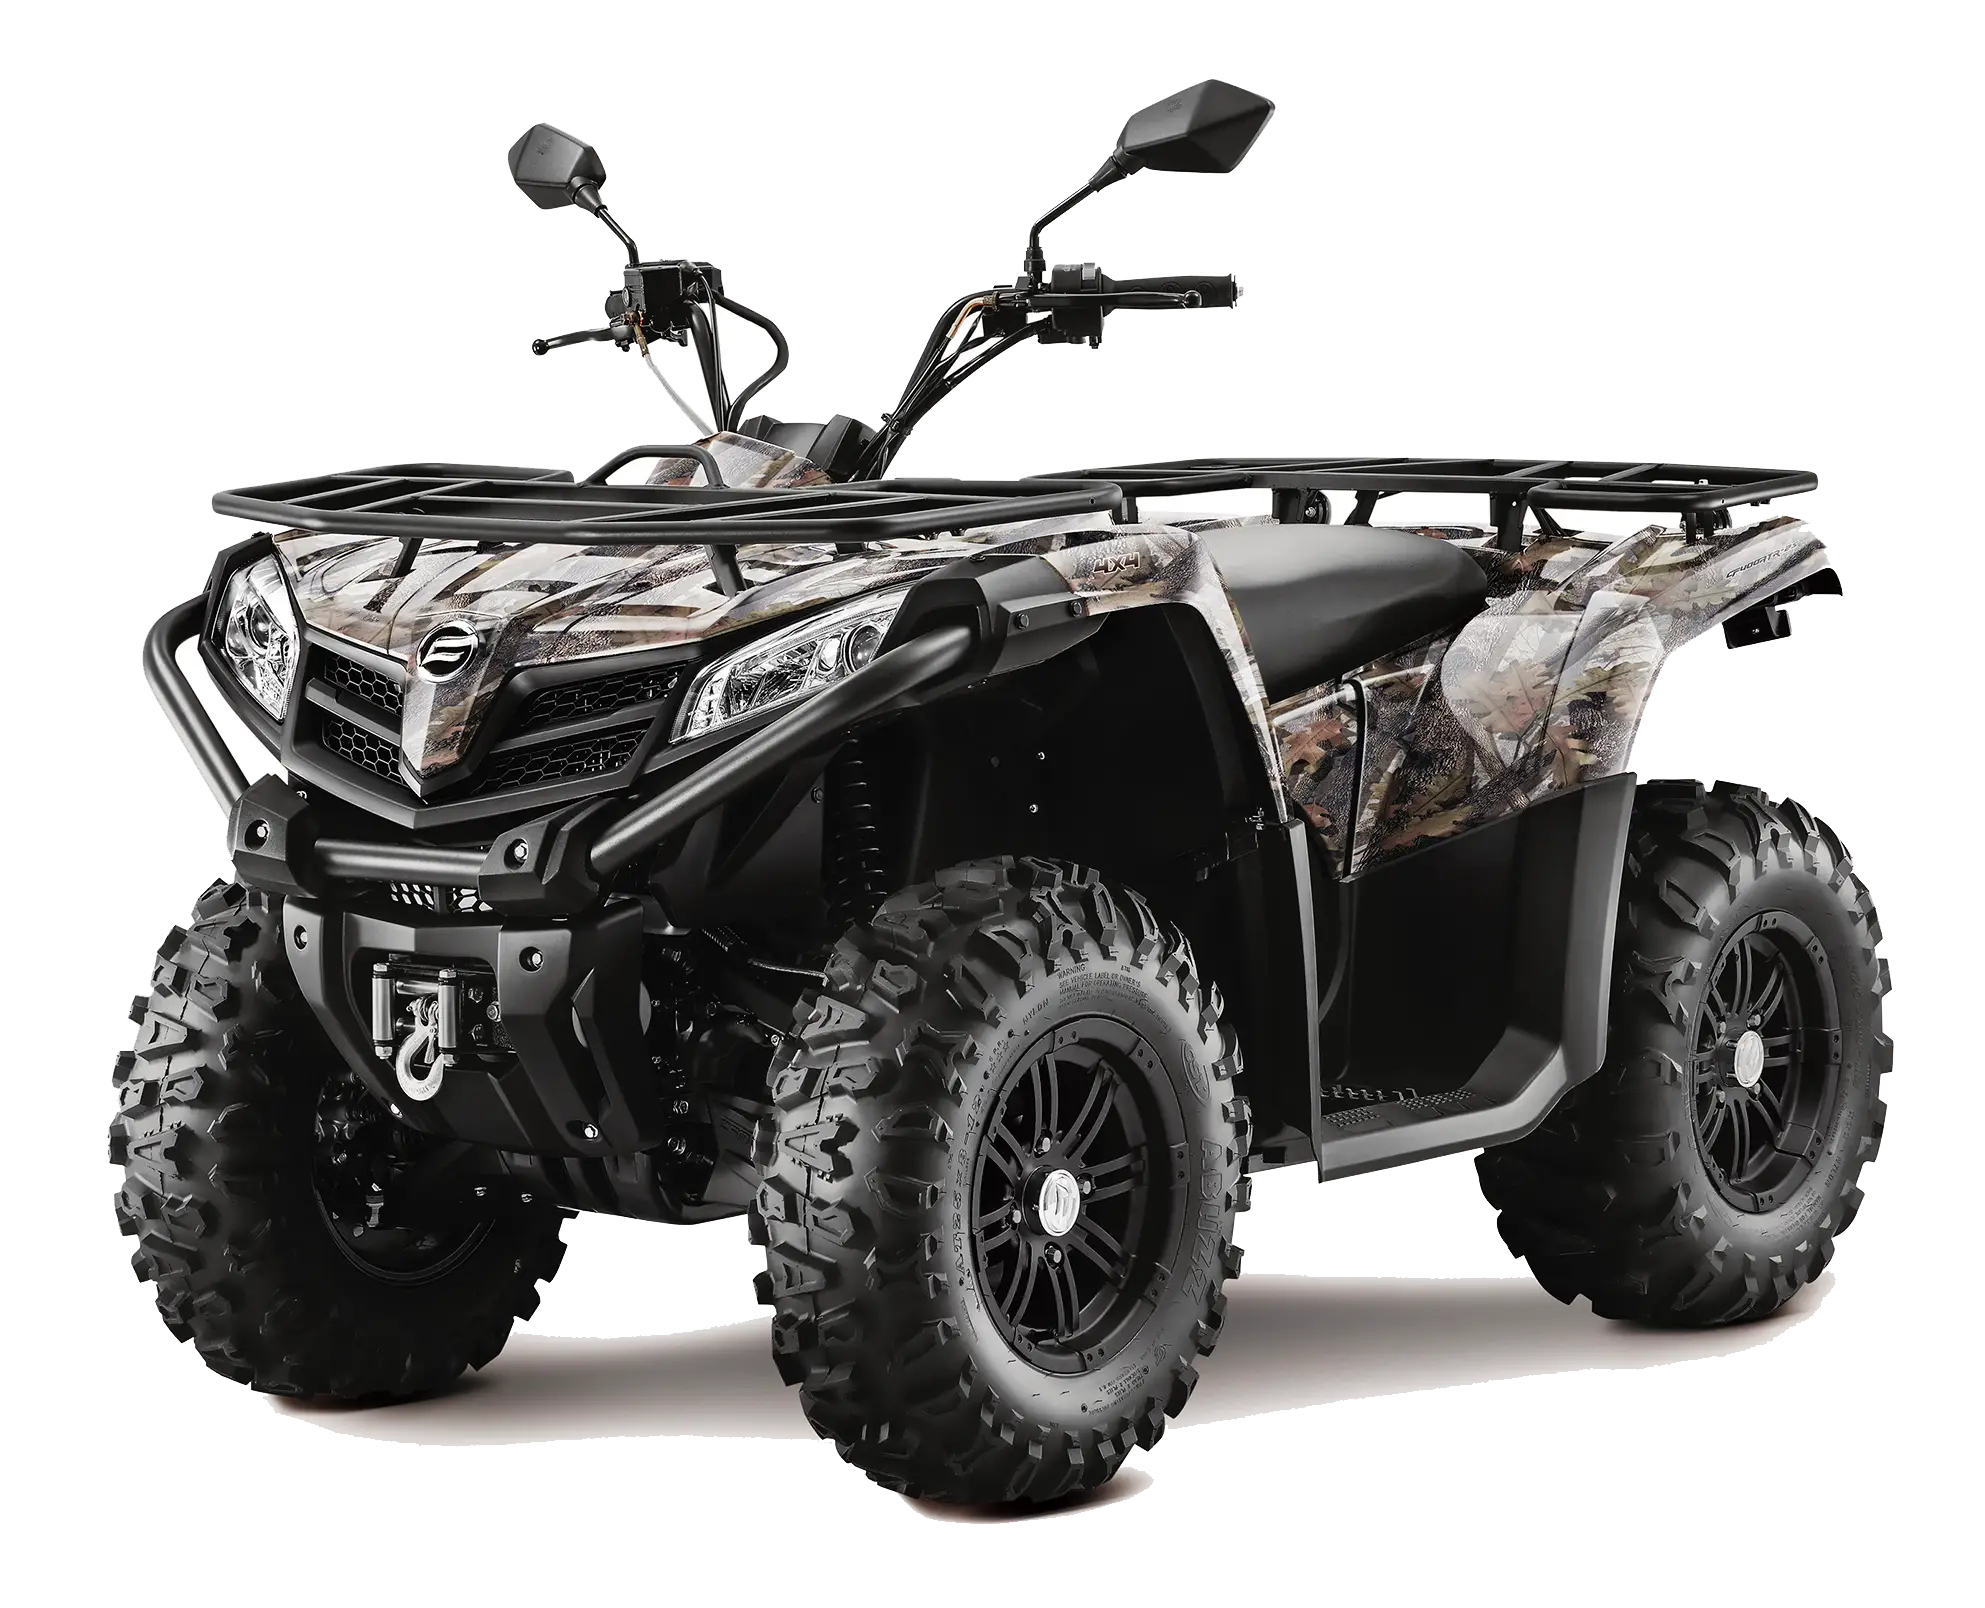
Camouflage All-Terrain Quad Bike -
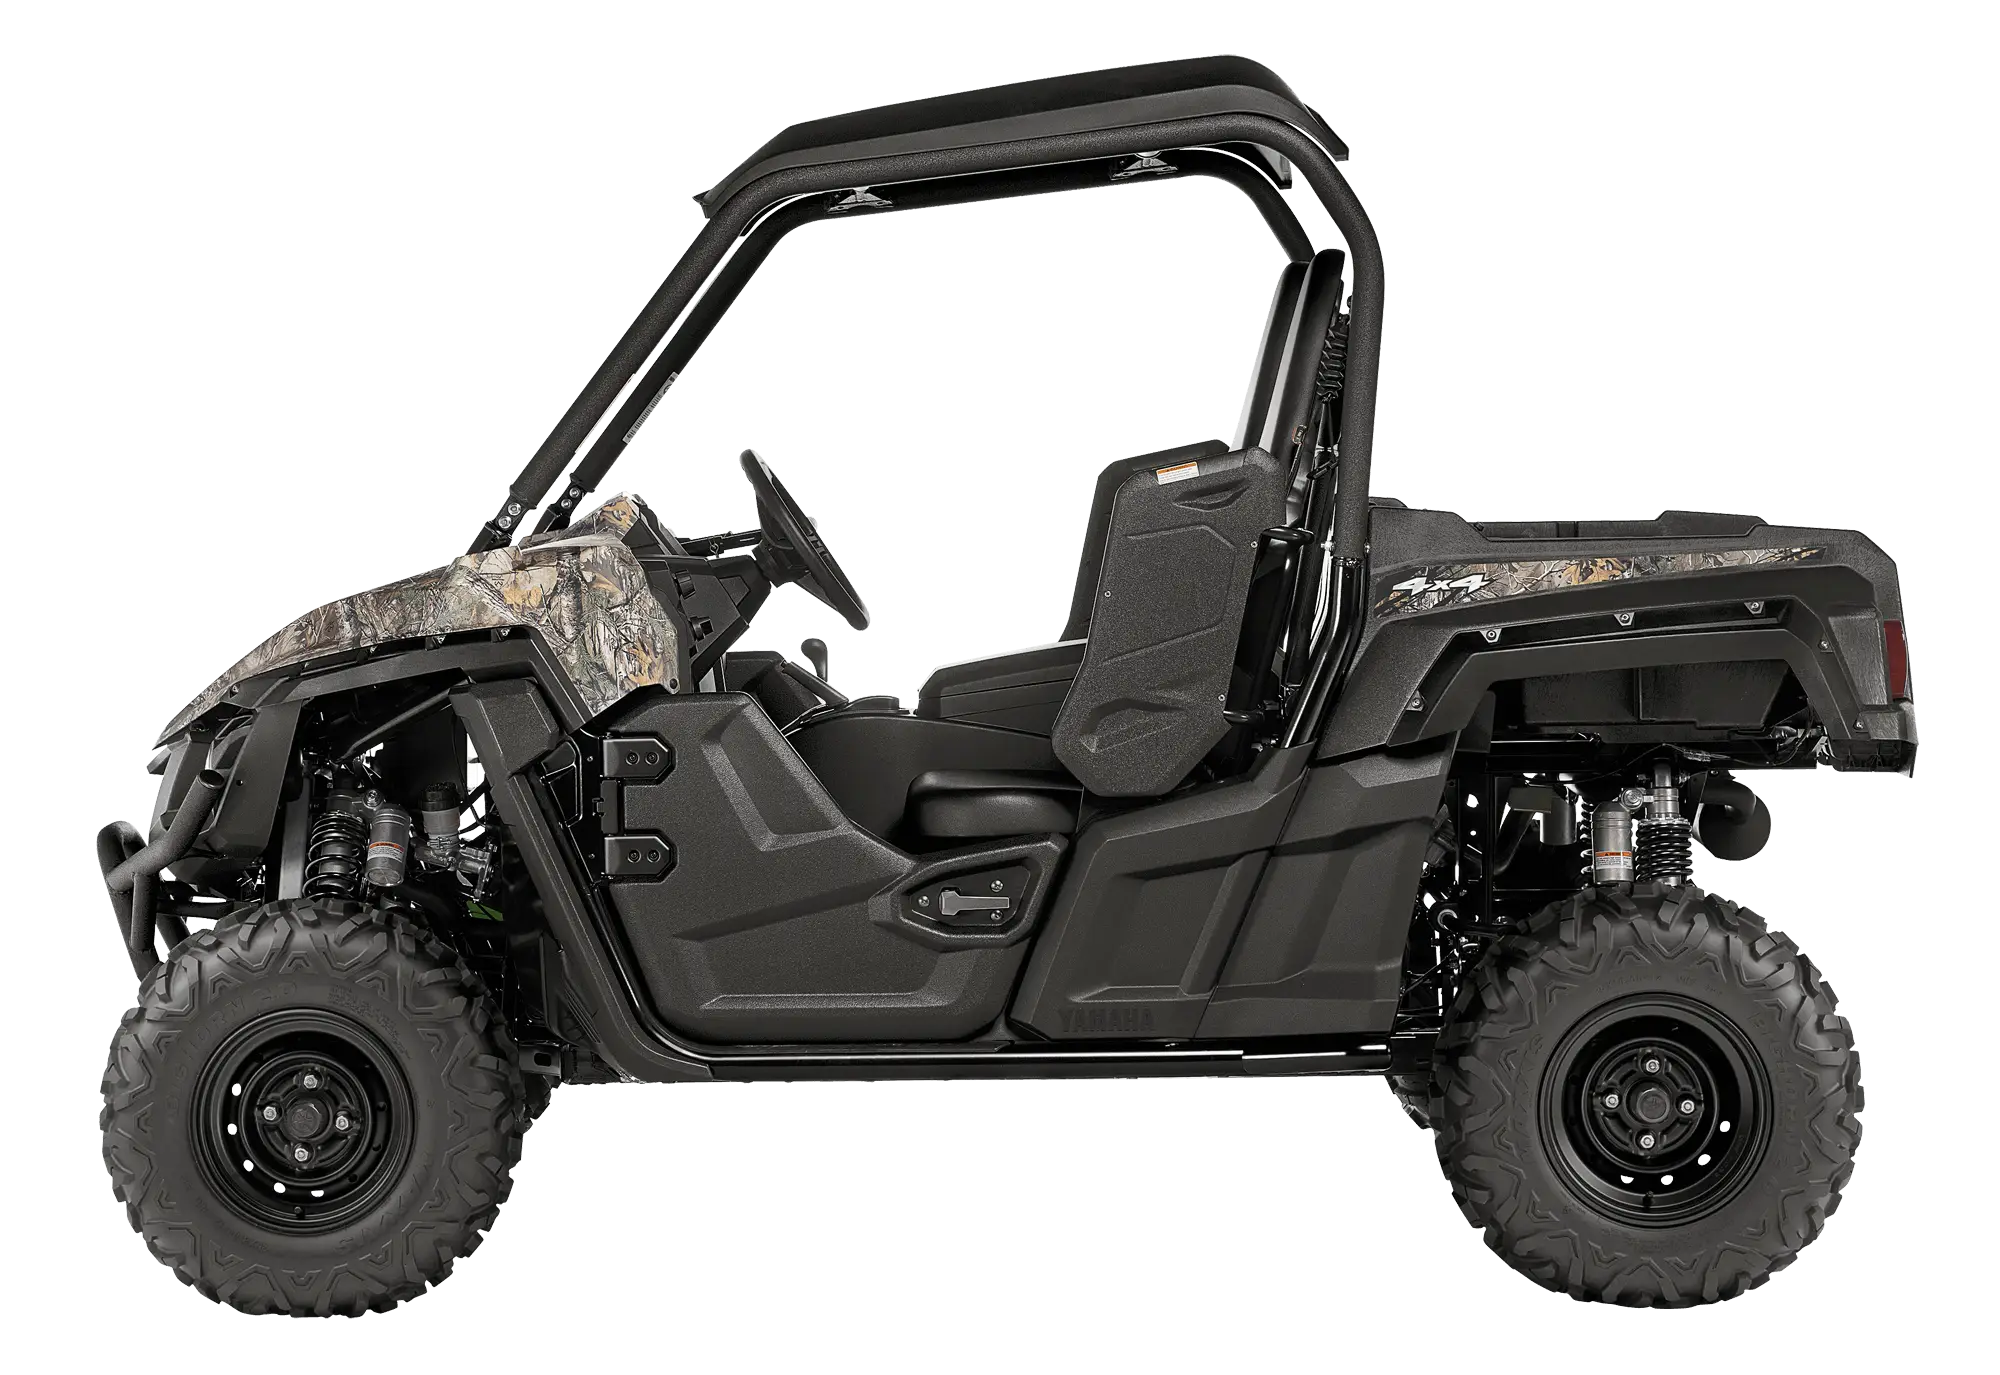
Black UTV for Off-Road Adventures -

Large Water Tank for Storage -

Wrench and Screwdriver Tools -

Large Residential House -

Photographer in Studio -
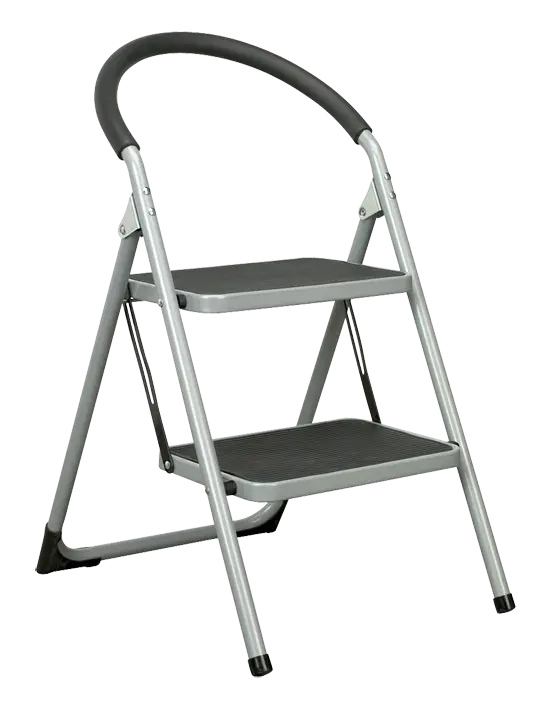
Foldable Two-Step Ladder in Gray -
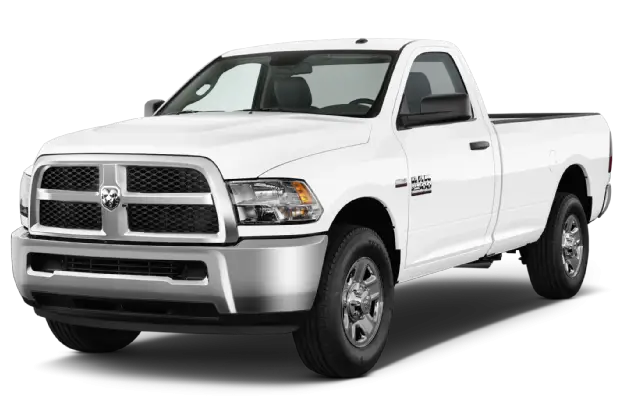
White Pickup Truck with Modern Design -
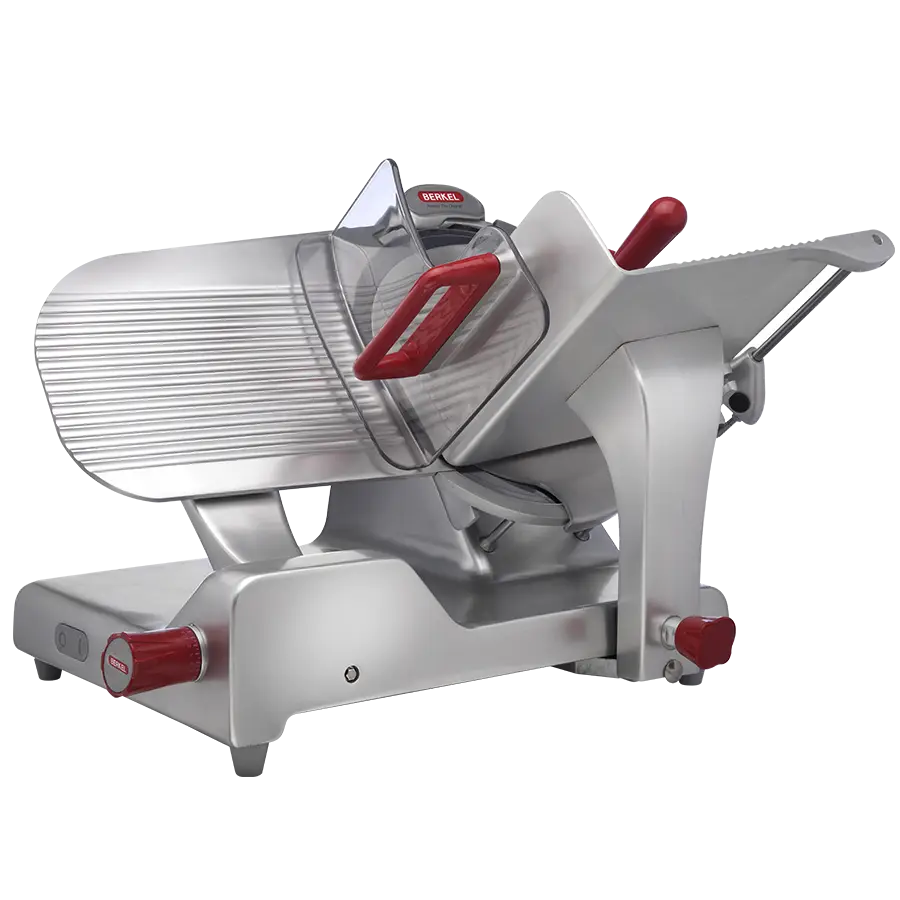
Professional Meat Slicer for Kitchen -
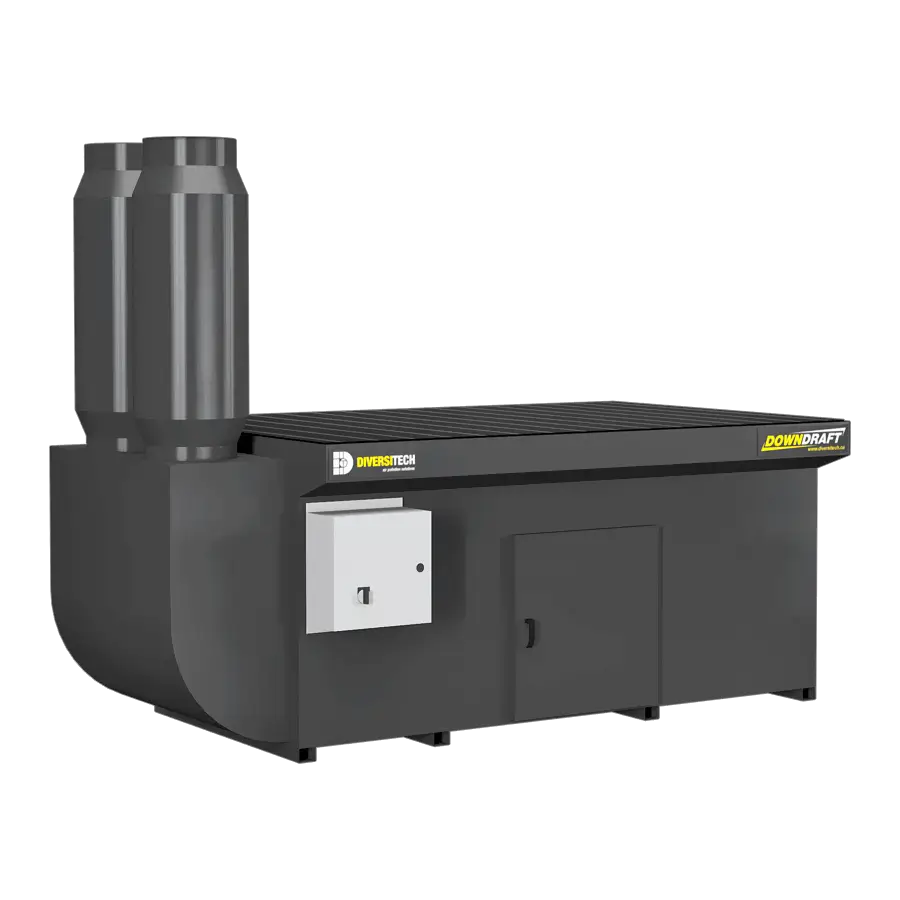
Industrial Equipment with Modern Design -
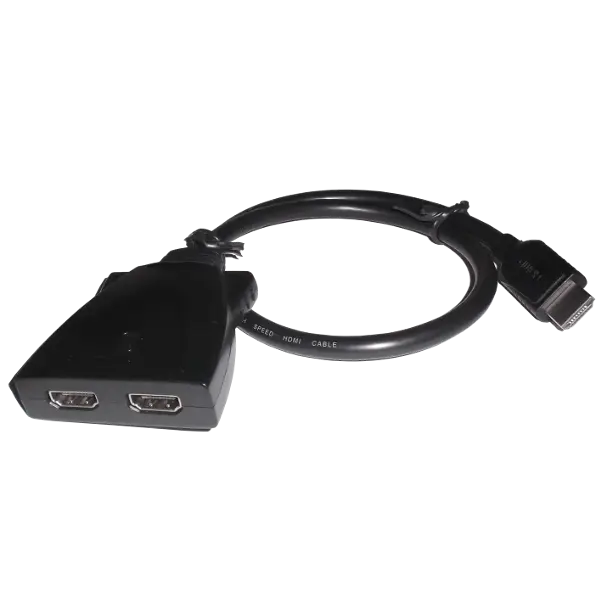
HDMI Splitter Cable -

Plain White Cargo Truck for Logistics -
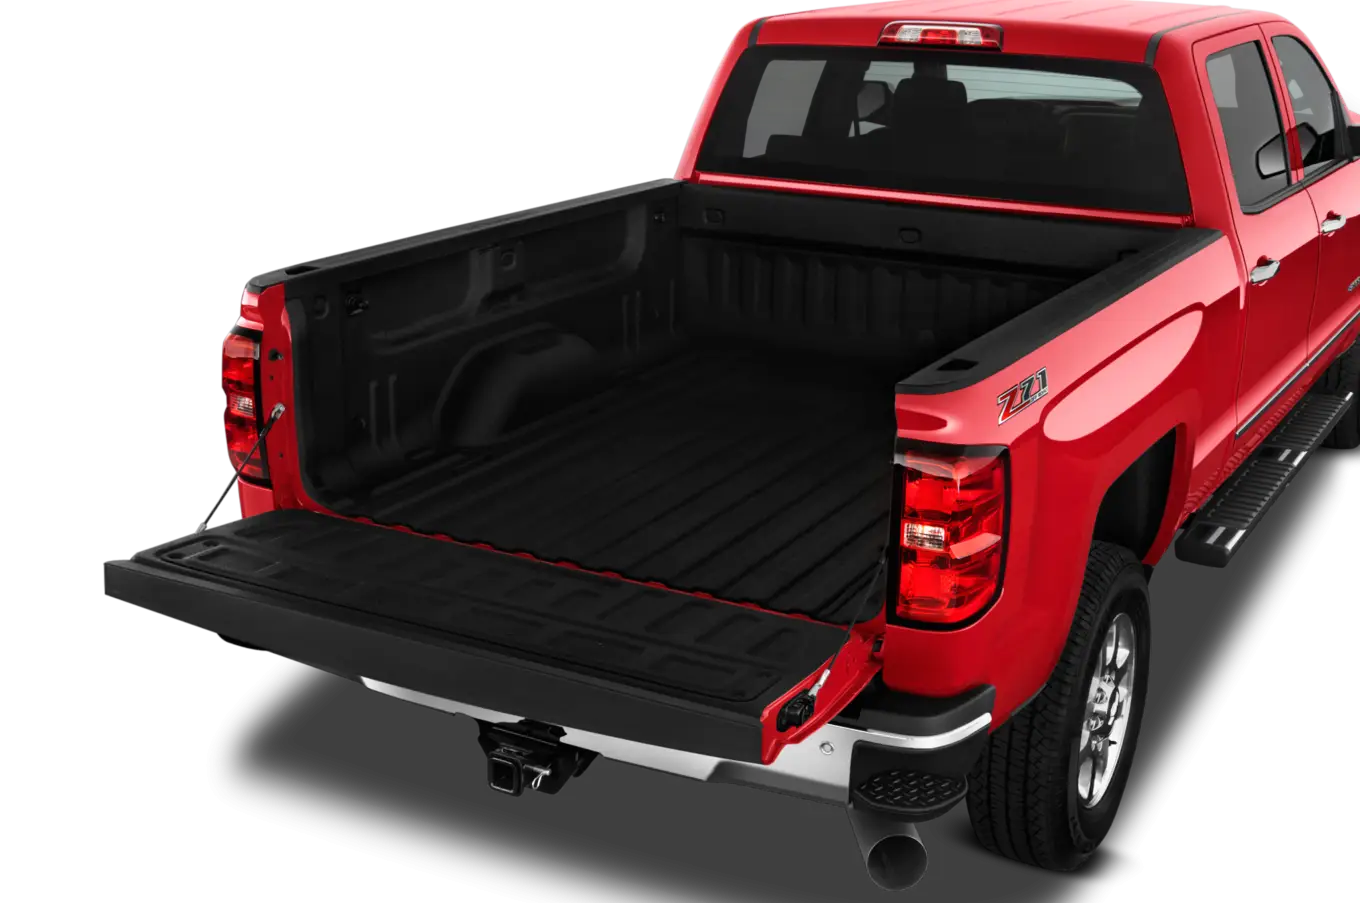
Red Pickup Truck Bed with Utility Design -

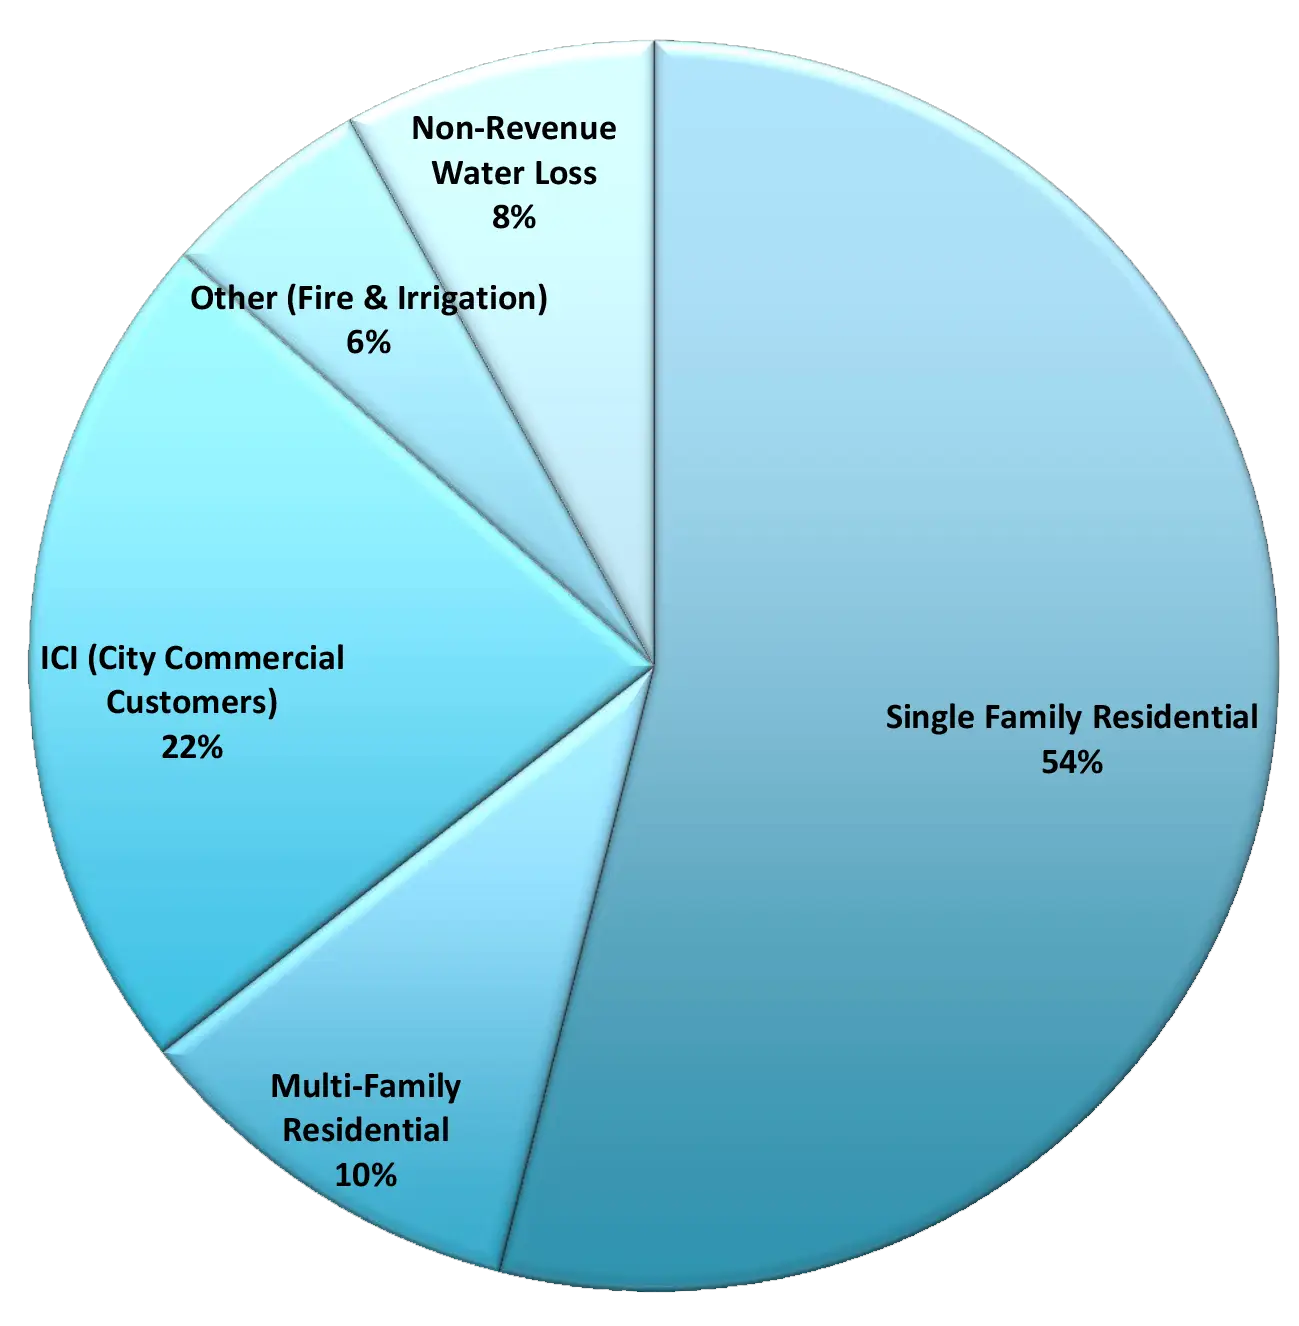
Colorful Statistical Pie Chart -

7zip Logo with Pink Background -
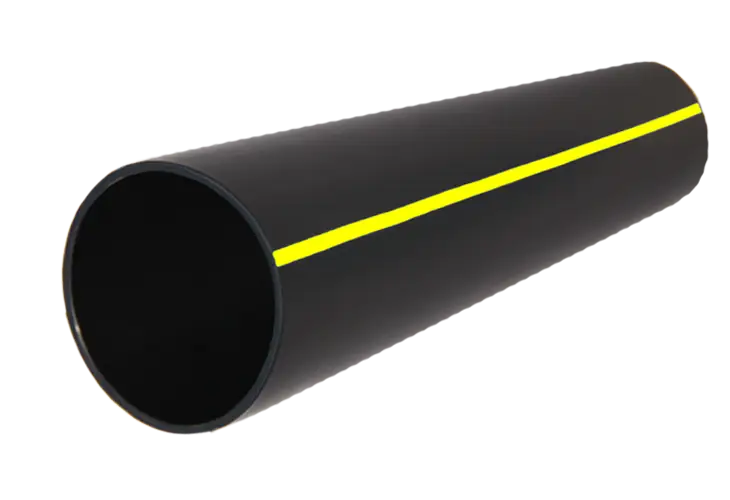
Black Pipe with Yellow Stripe for Utility Uses -

Young Living Essential Oils Logo