You Might Like
-

Green Globe Icon Representing Sustainability -
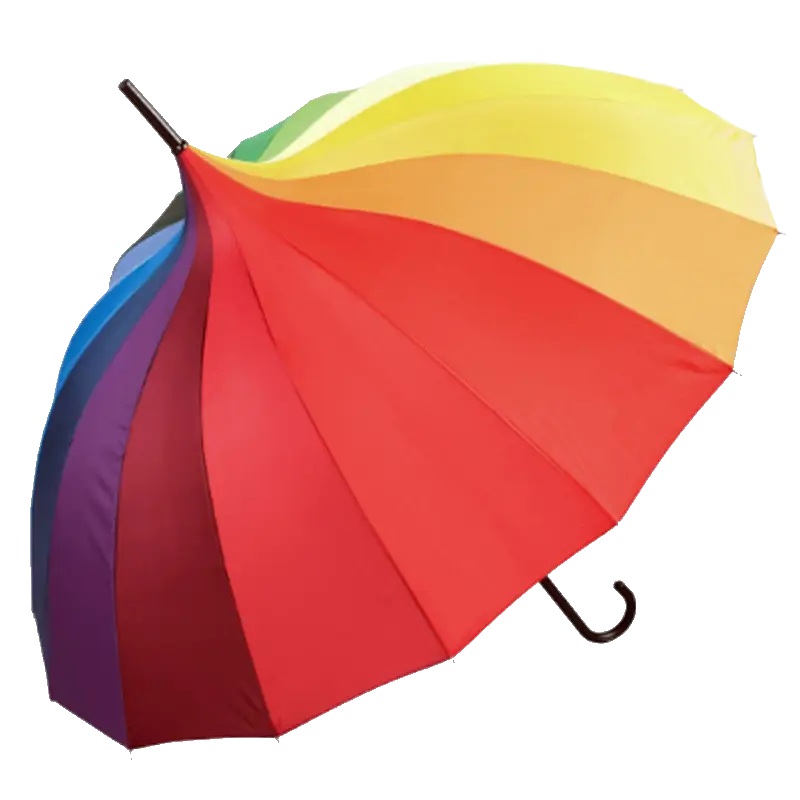
Multicolored Umbrella for Weather Protection -
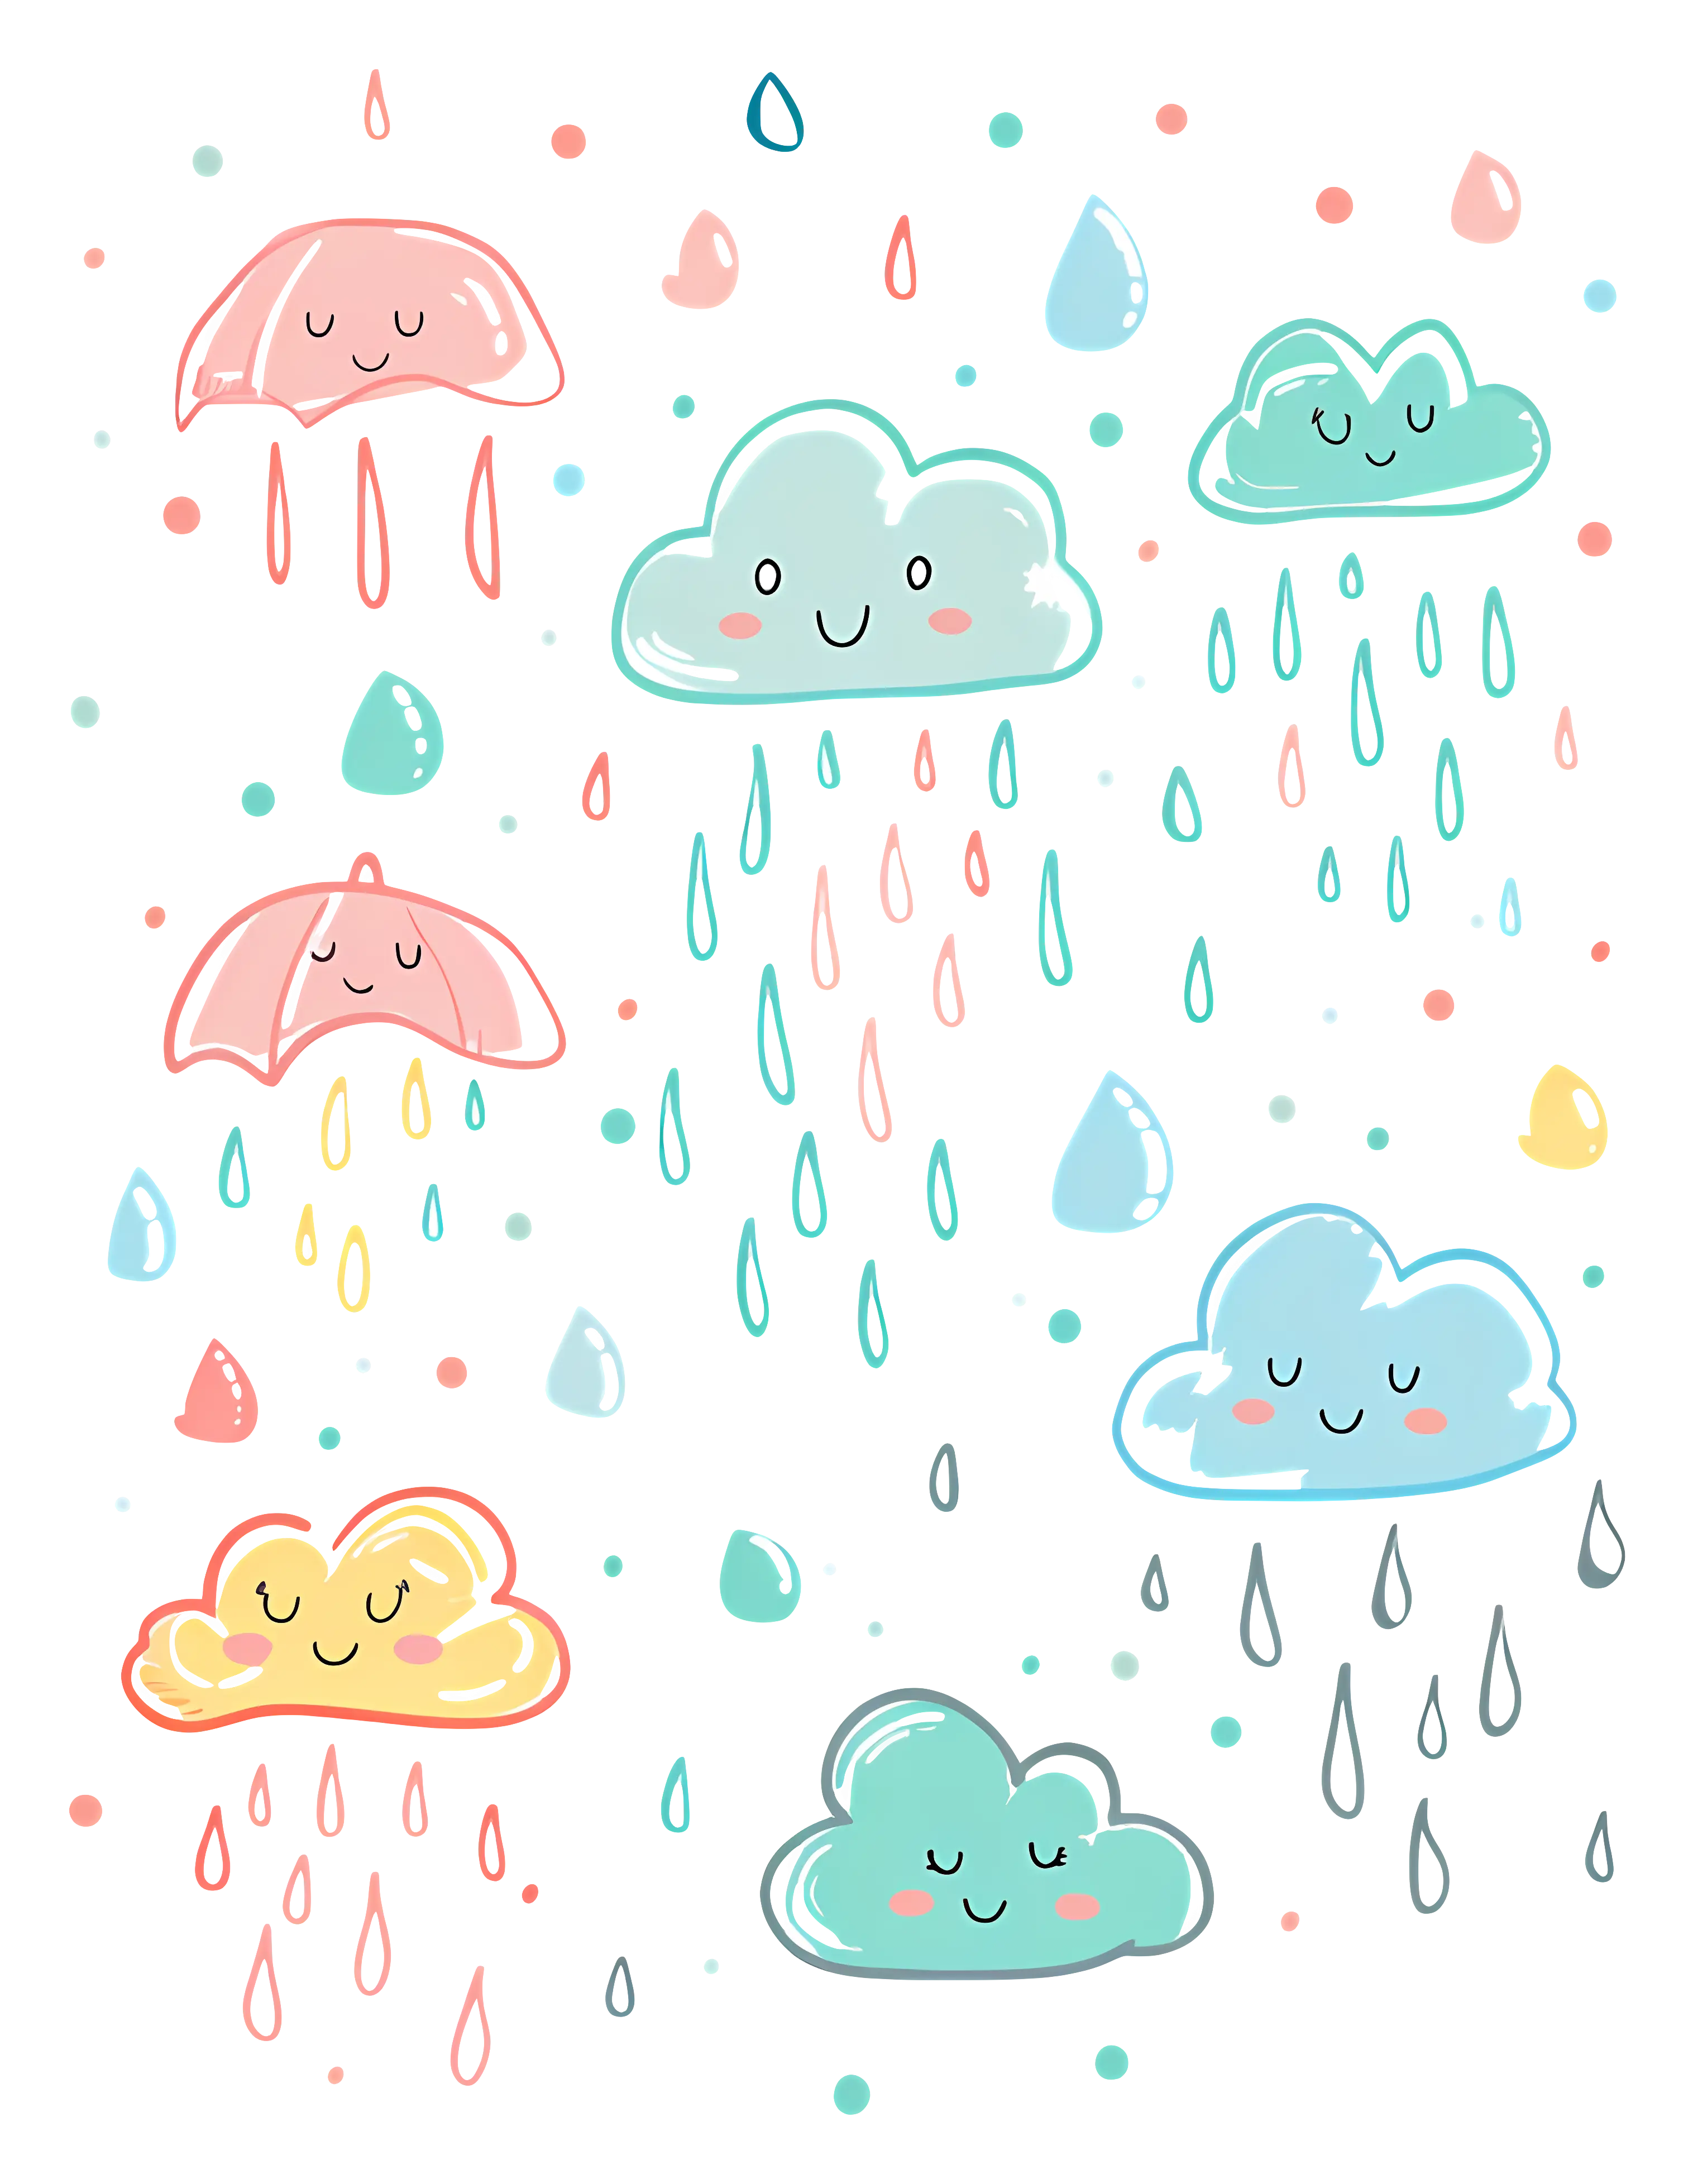
Cute Rain Clouds and Umbrellas Illustration -

Cute Cartoon Clouds in Blue Sky -

Black Windy Weather Icon -

Electric Room Heater -
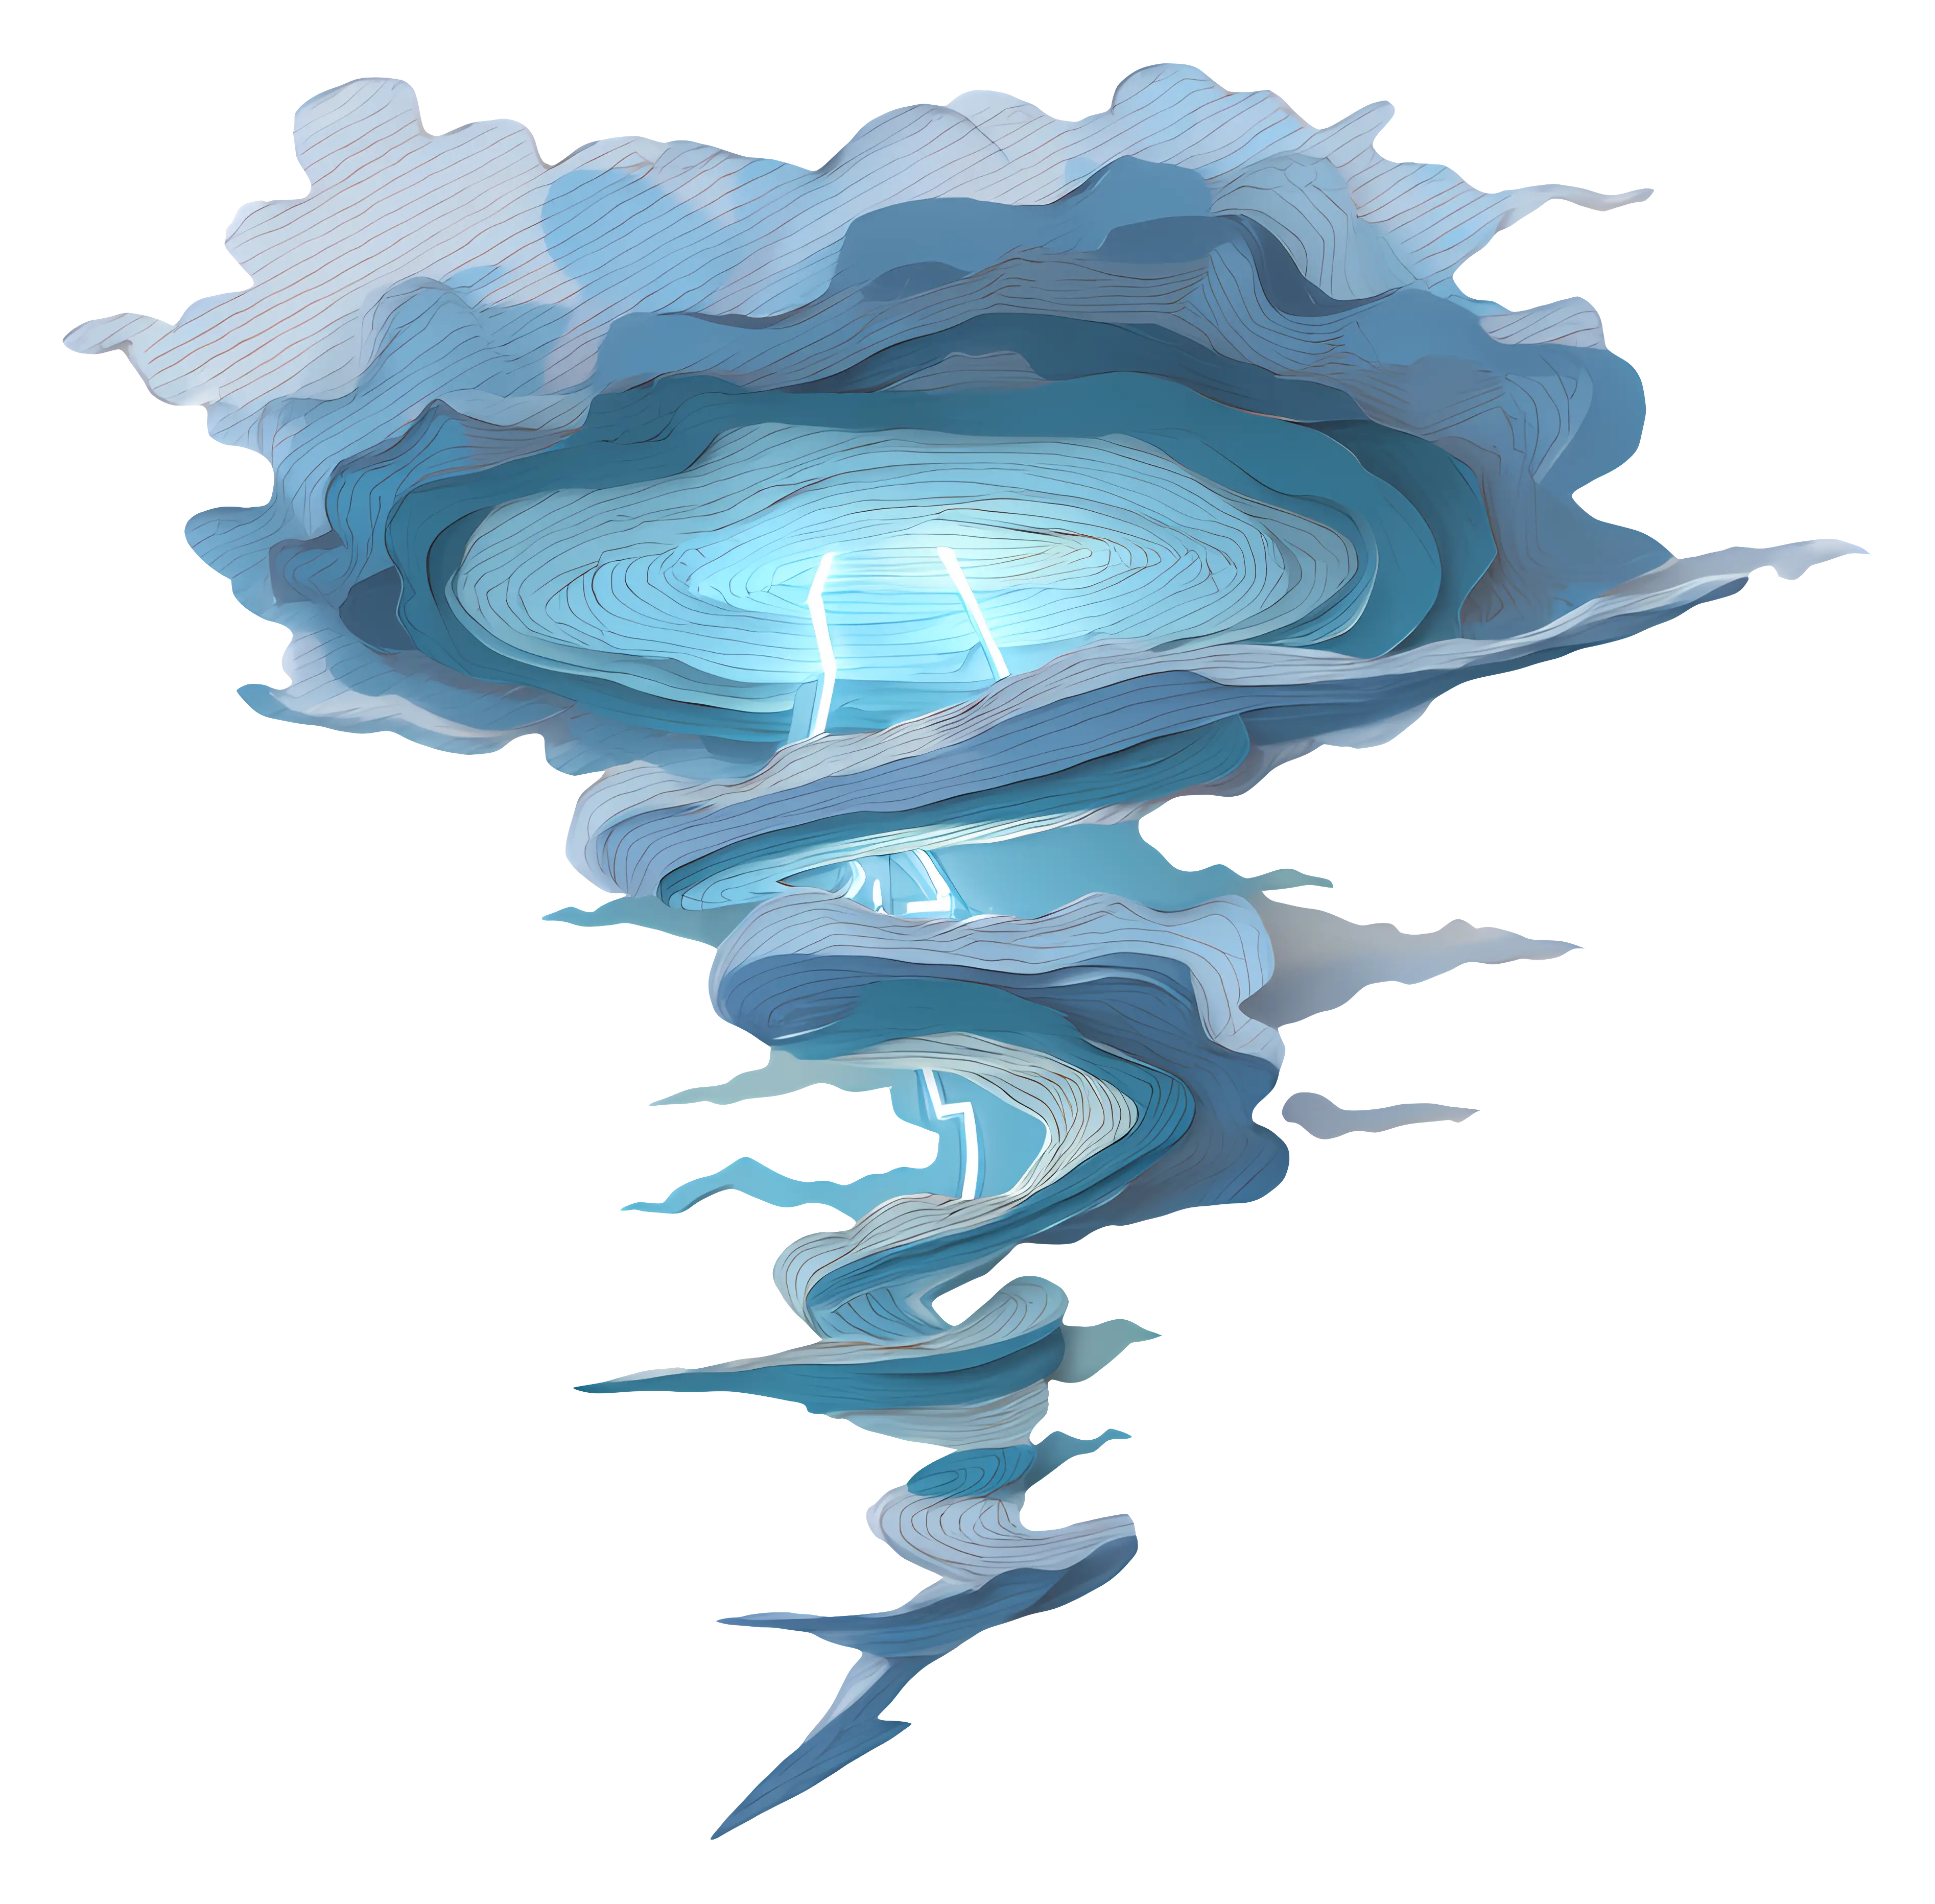
Storm Cloud with Lightning -
Classic Black Rubber Rain Boot -

Red Triangle Wind Warning Road Sign -
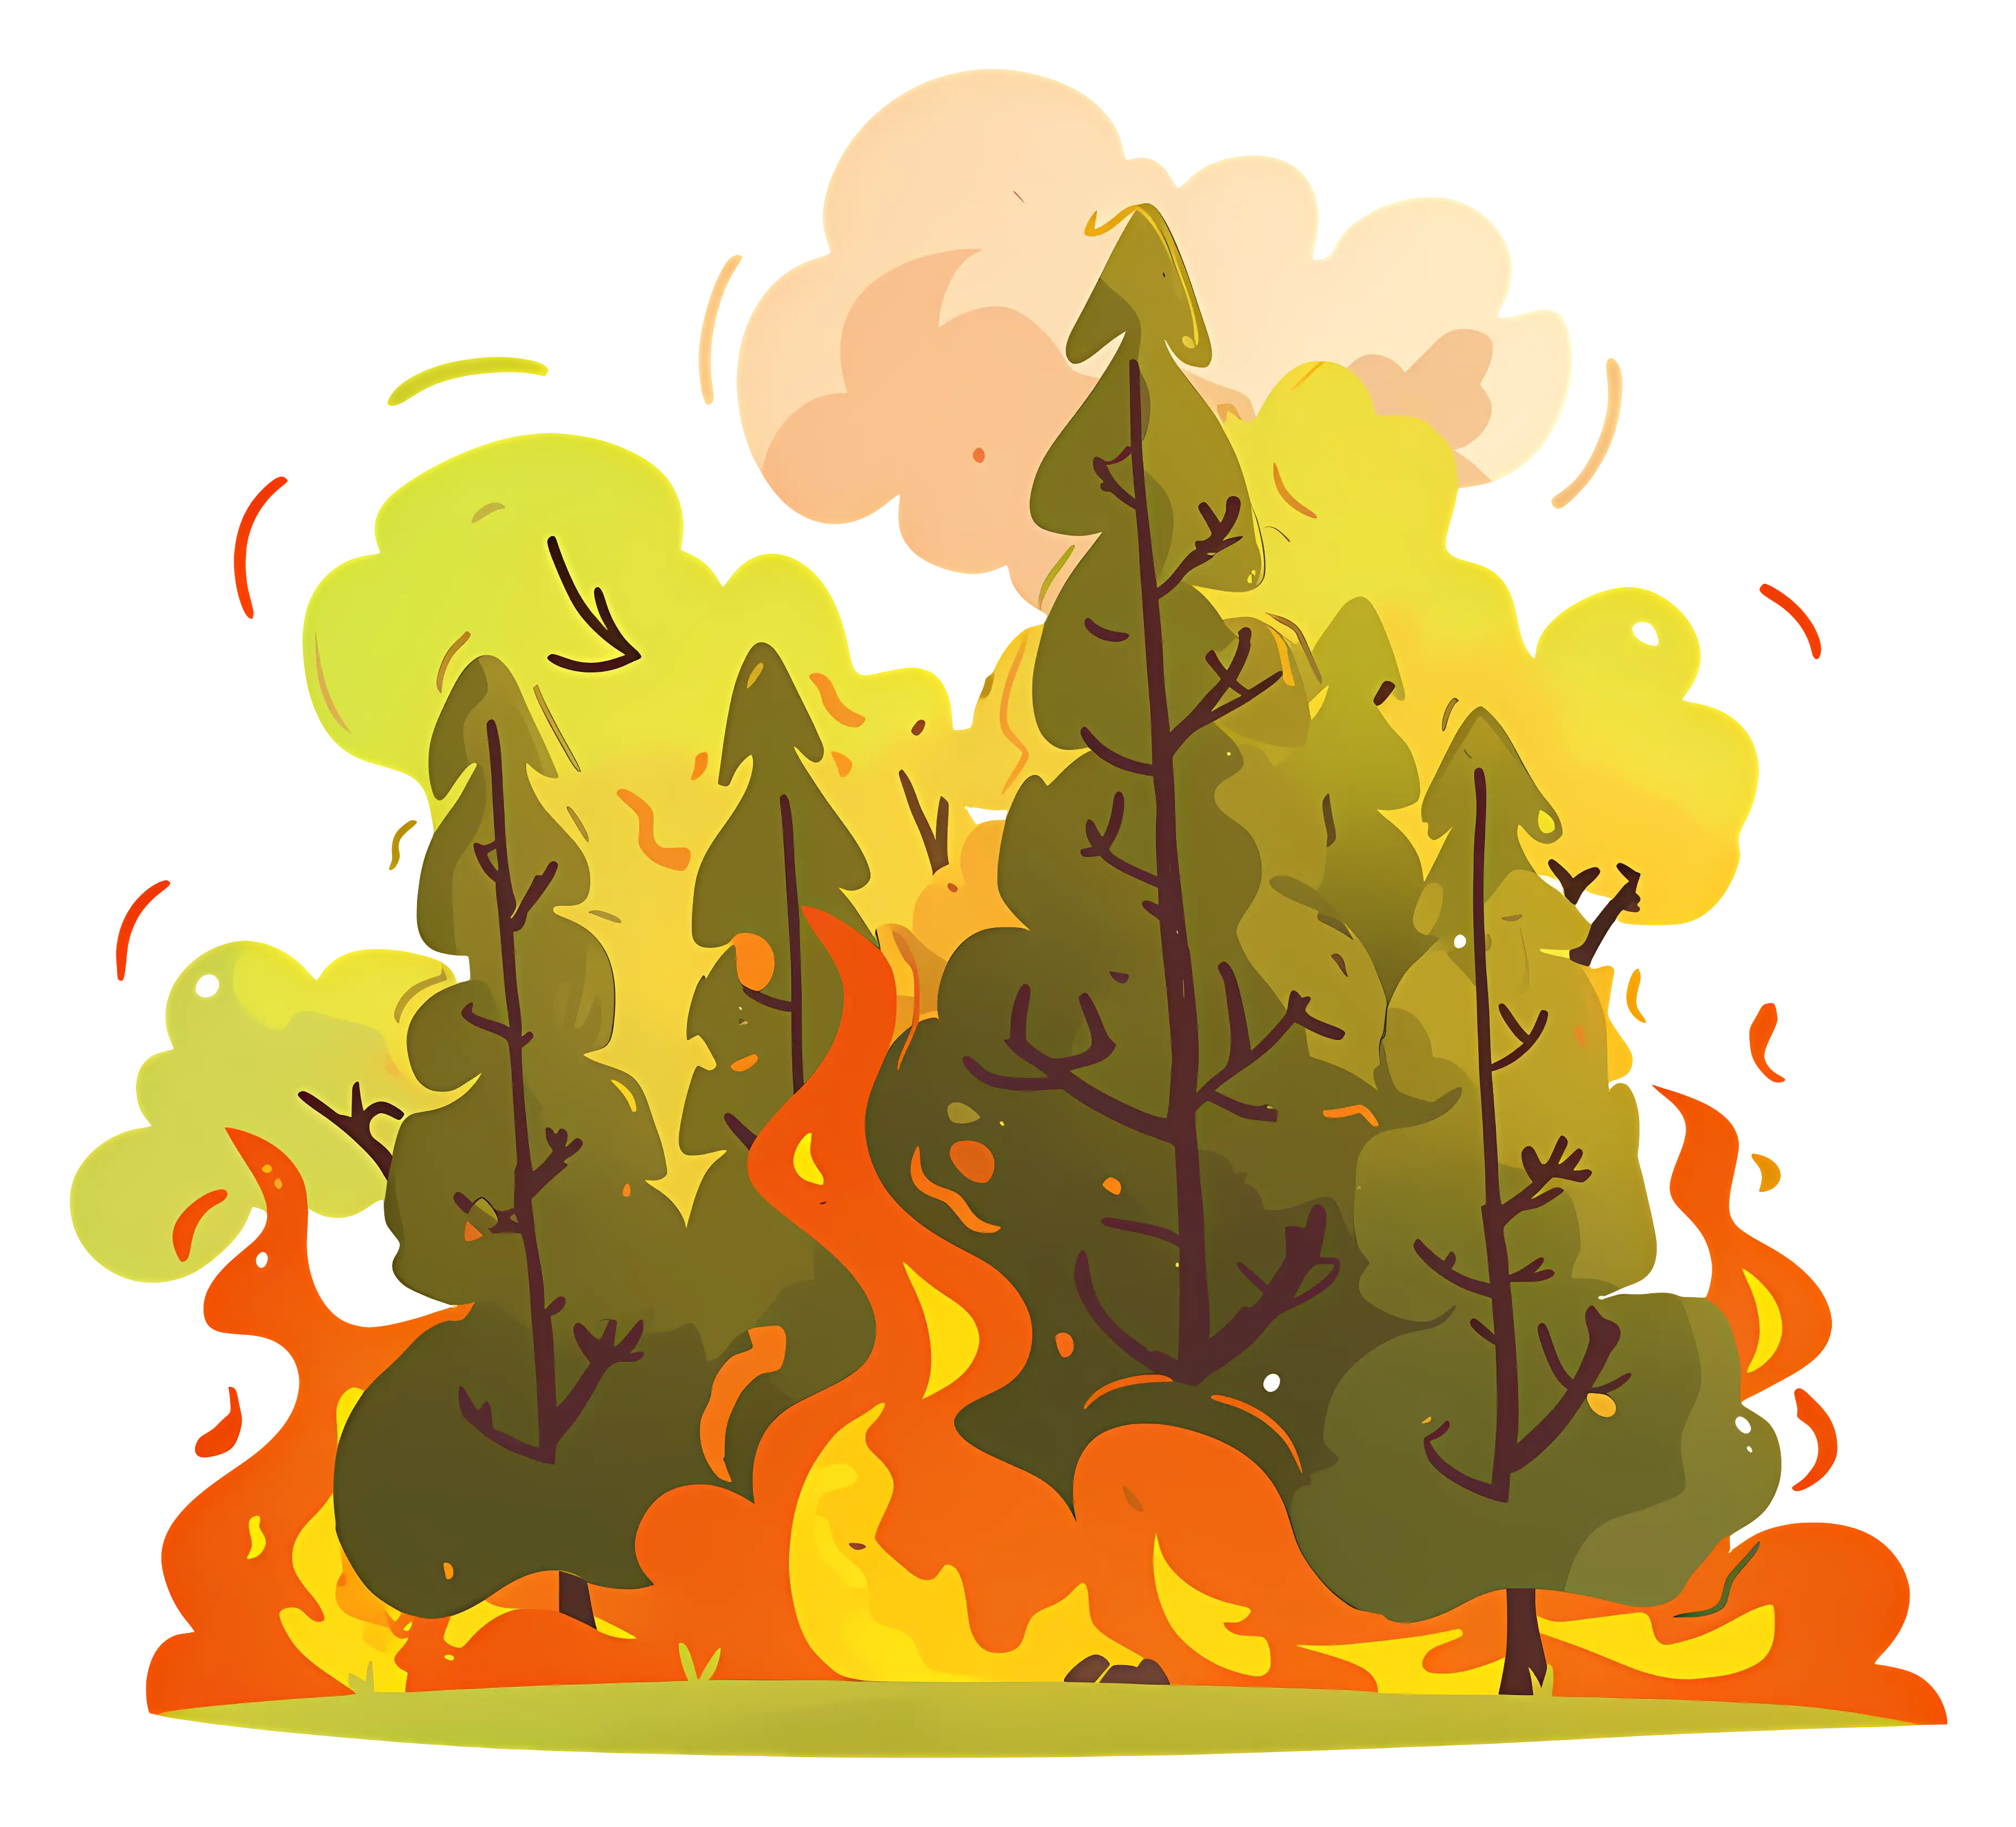
Burning Forest with Flames -

Digestive System Diagram -
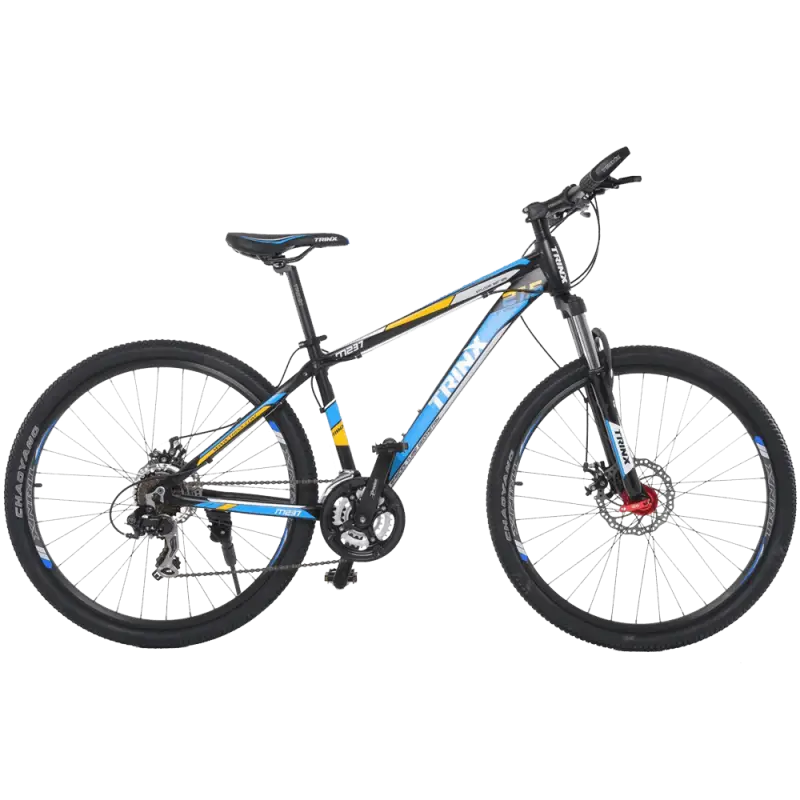
Durable Off-Road Mountain Bicycle -

HR Workflow Diagram -

Eco-friendly Green Hourglass -

Umbrella with Falling Raindrops Icon -

Beautiful Mountain Scenery -

Detailed Lungs Diagram Illustration -
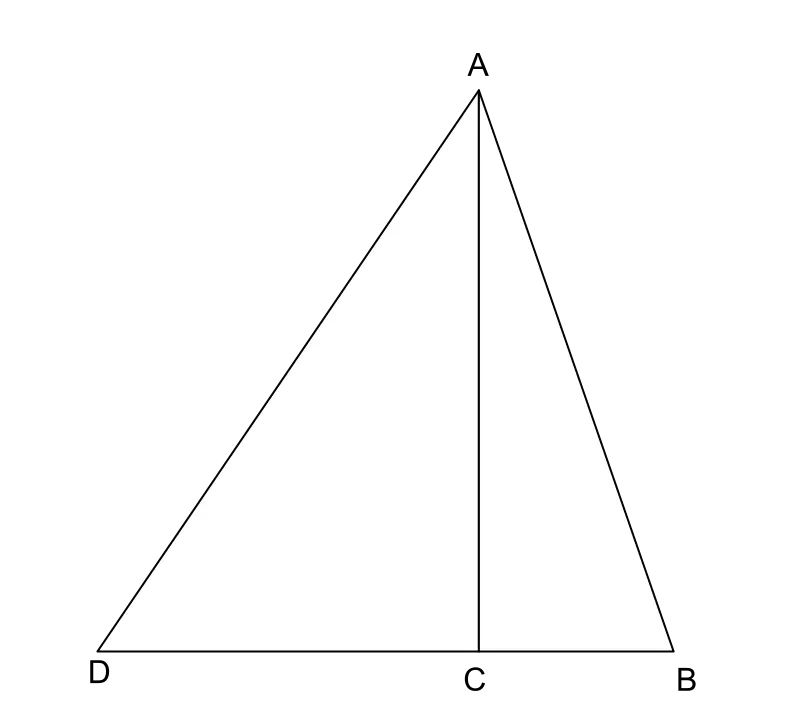
Triangle Diagram for Geometric Representation -

Orange Thermometer Icon Illustration -
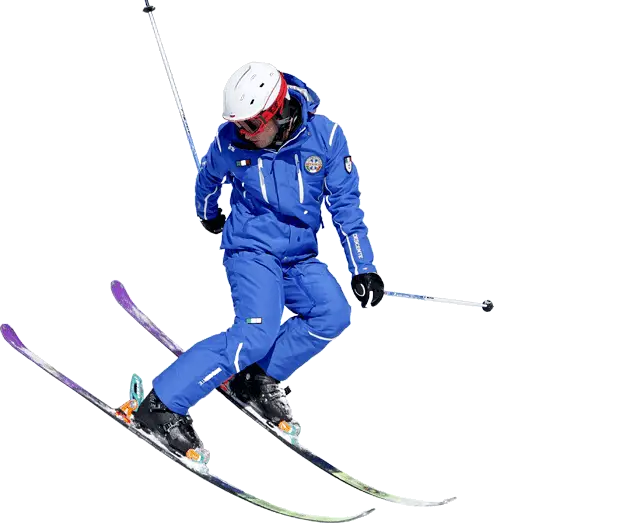
Skier in Blue Suit -
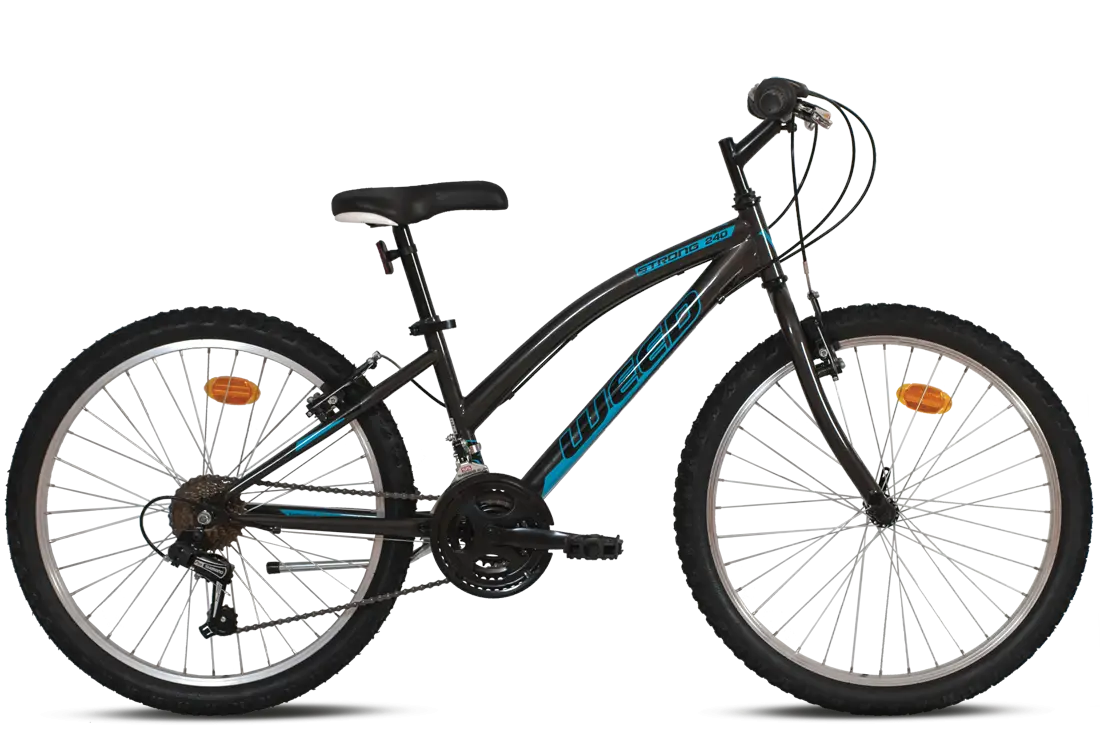
Durable Black Mountain Bicycle for Outdoor Adventures -
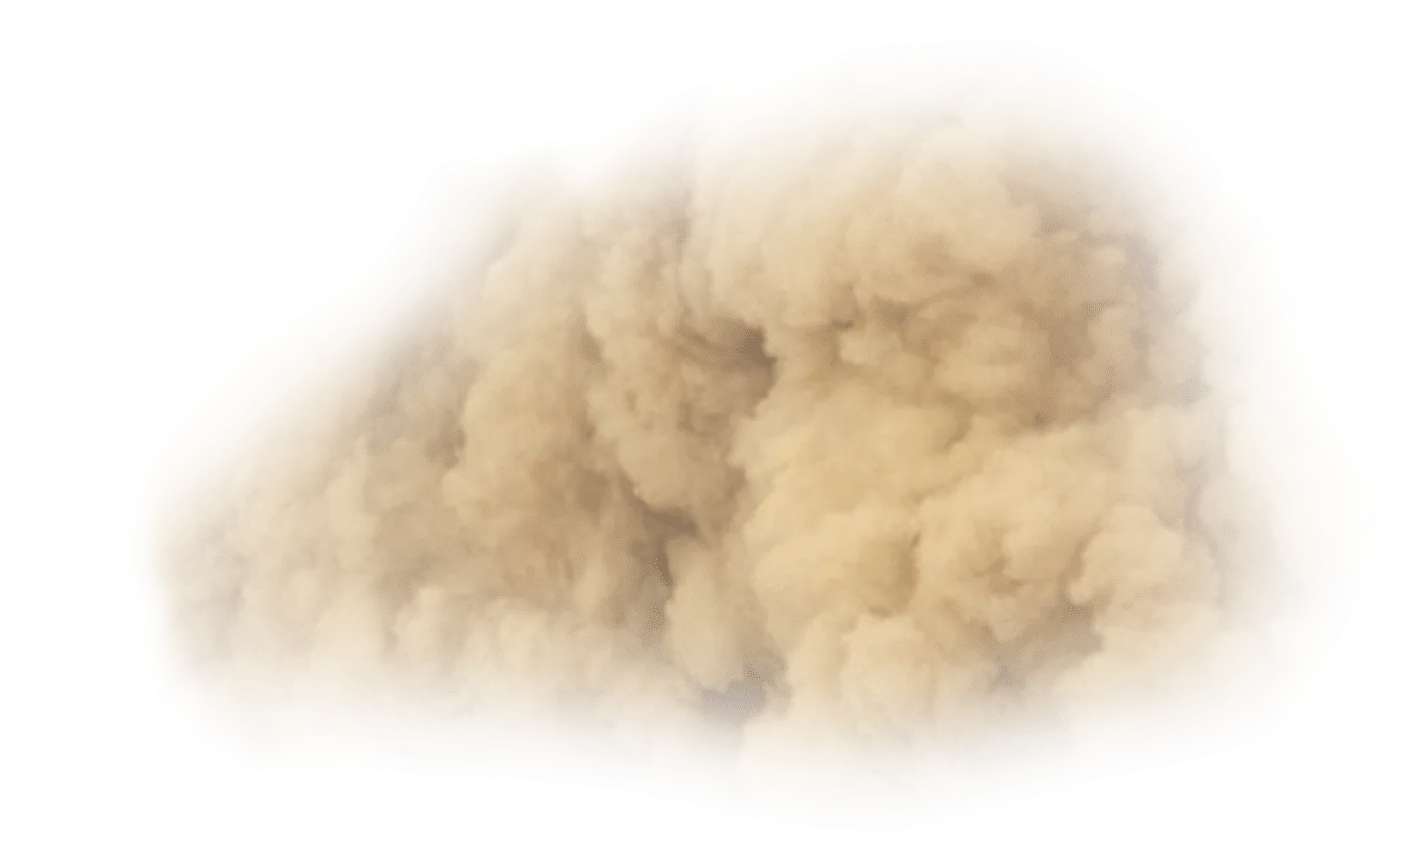
Dust Cloud Illustration -

Crying Polar Bear on Iceberg -

Earth with Leaves in a Hand for Sustainability Concept -

Car on Earth for World Environment Day -
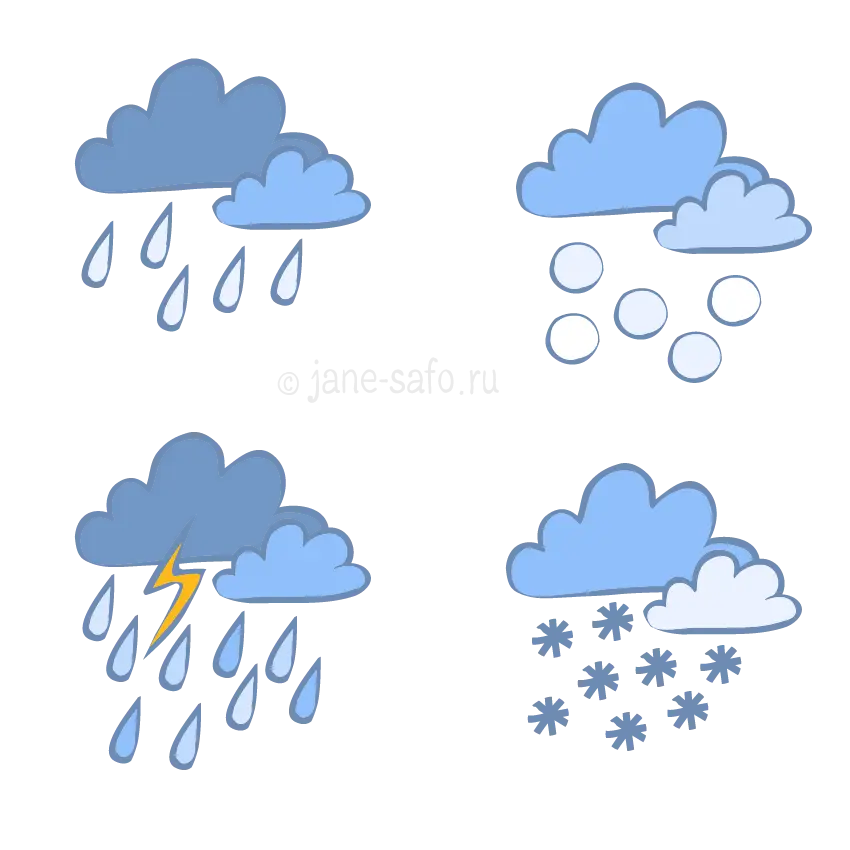
Weather Icons Showing Rain, Snow, and Storm -
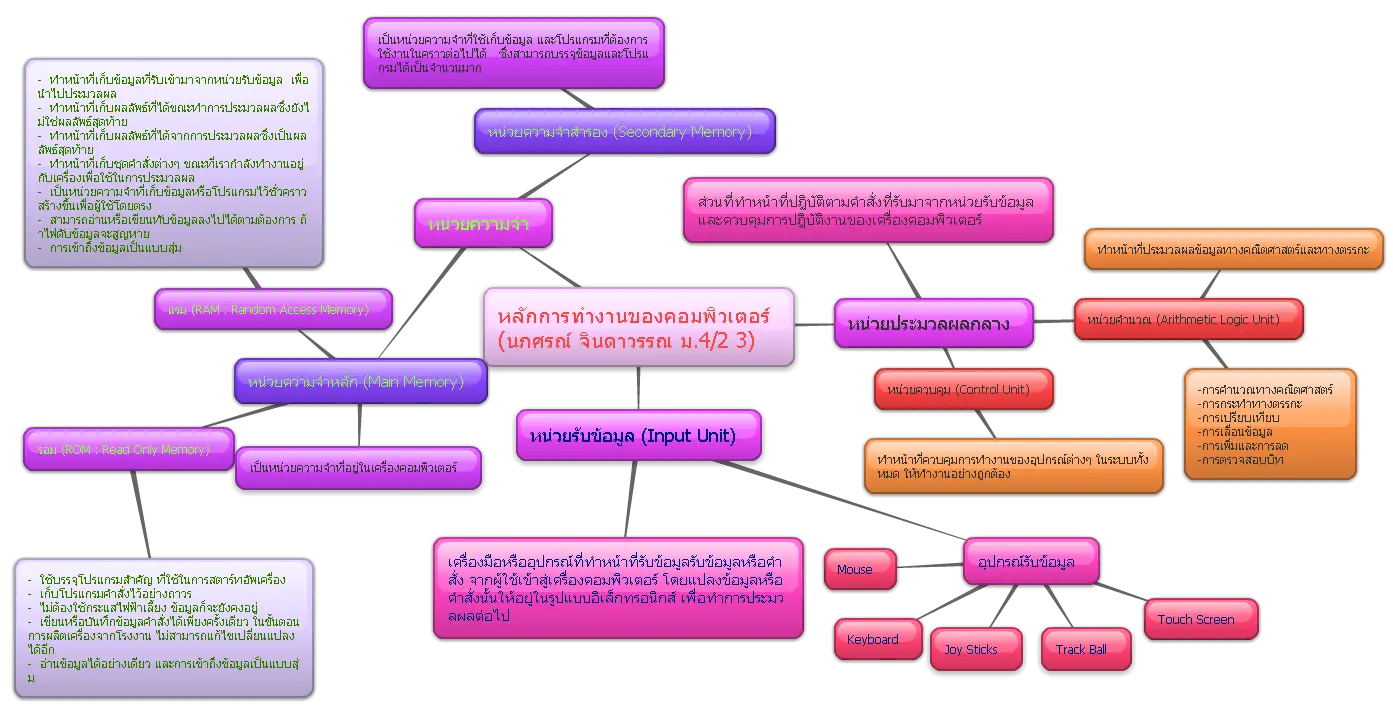
Mind Map Diagram in Colorful Design -

Green Flowchart Diagram -

Black and White Logo -

Realistic Fluffy Cloud Illustration