You Might Like
-
Russian Flag -
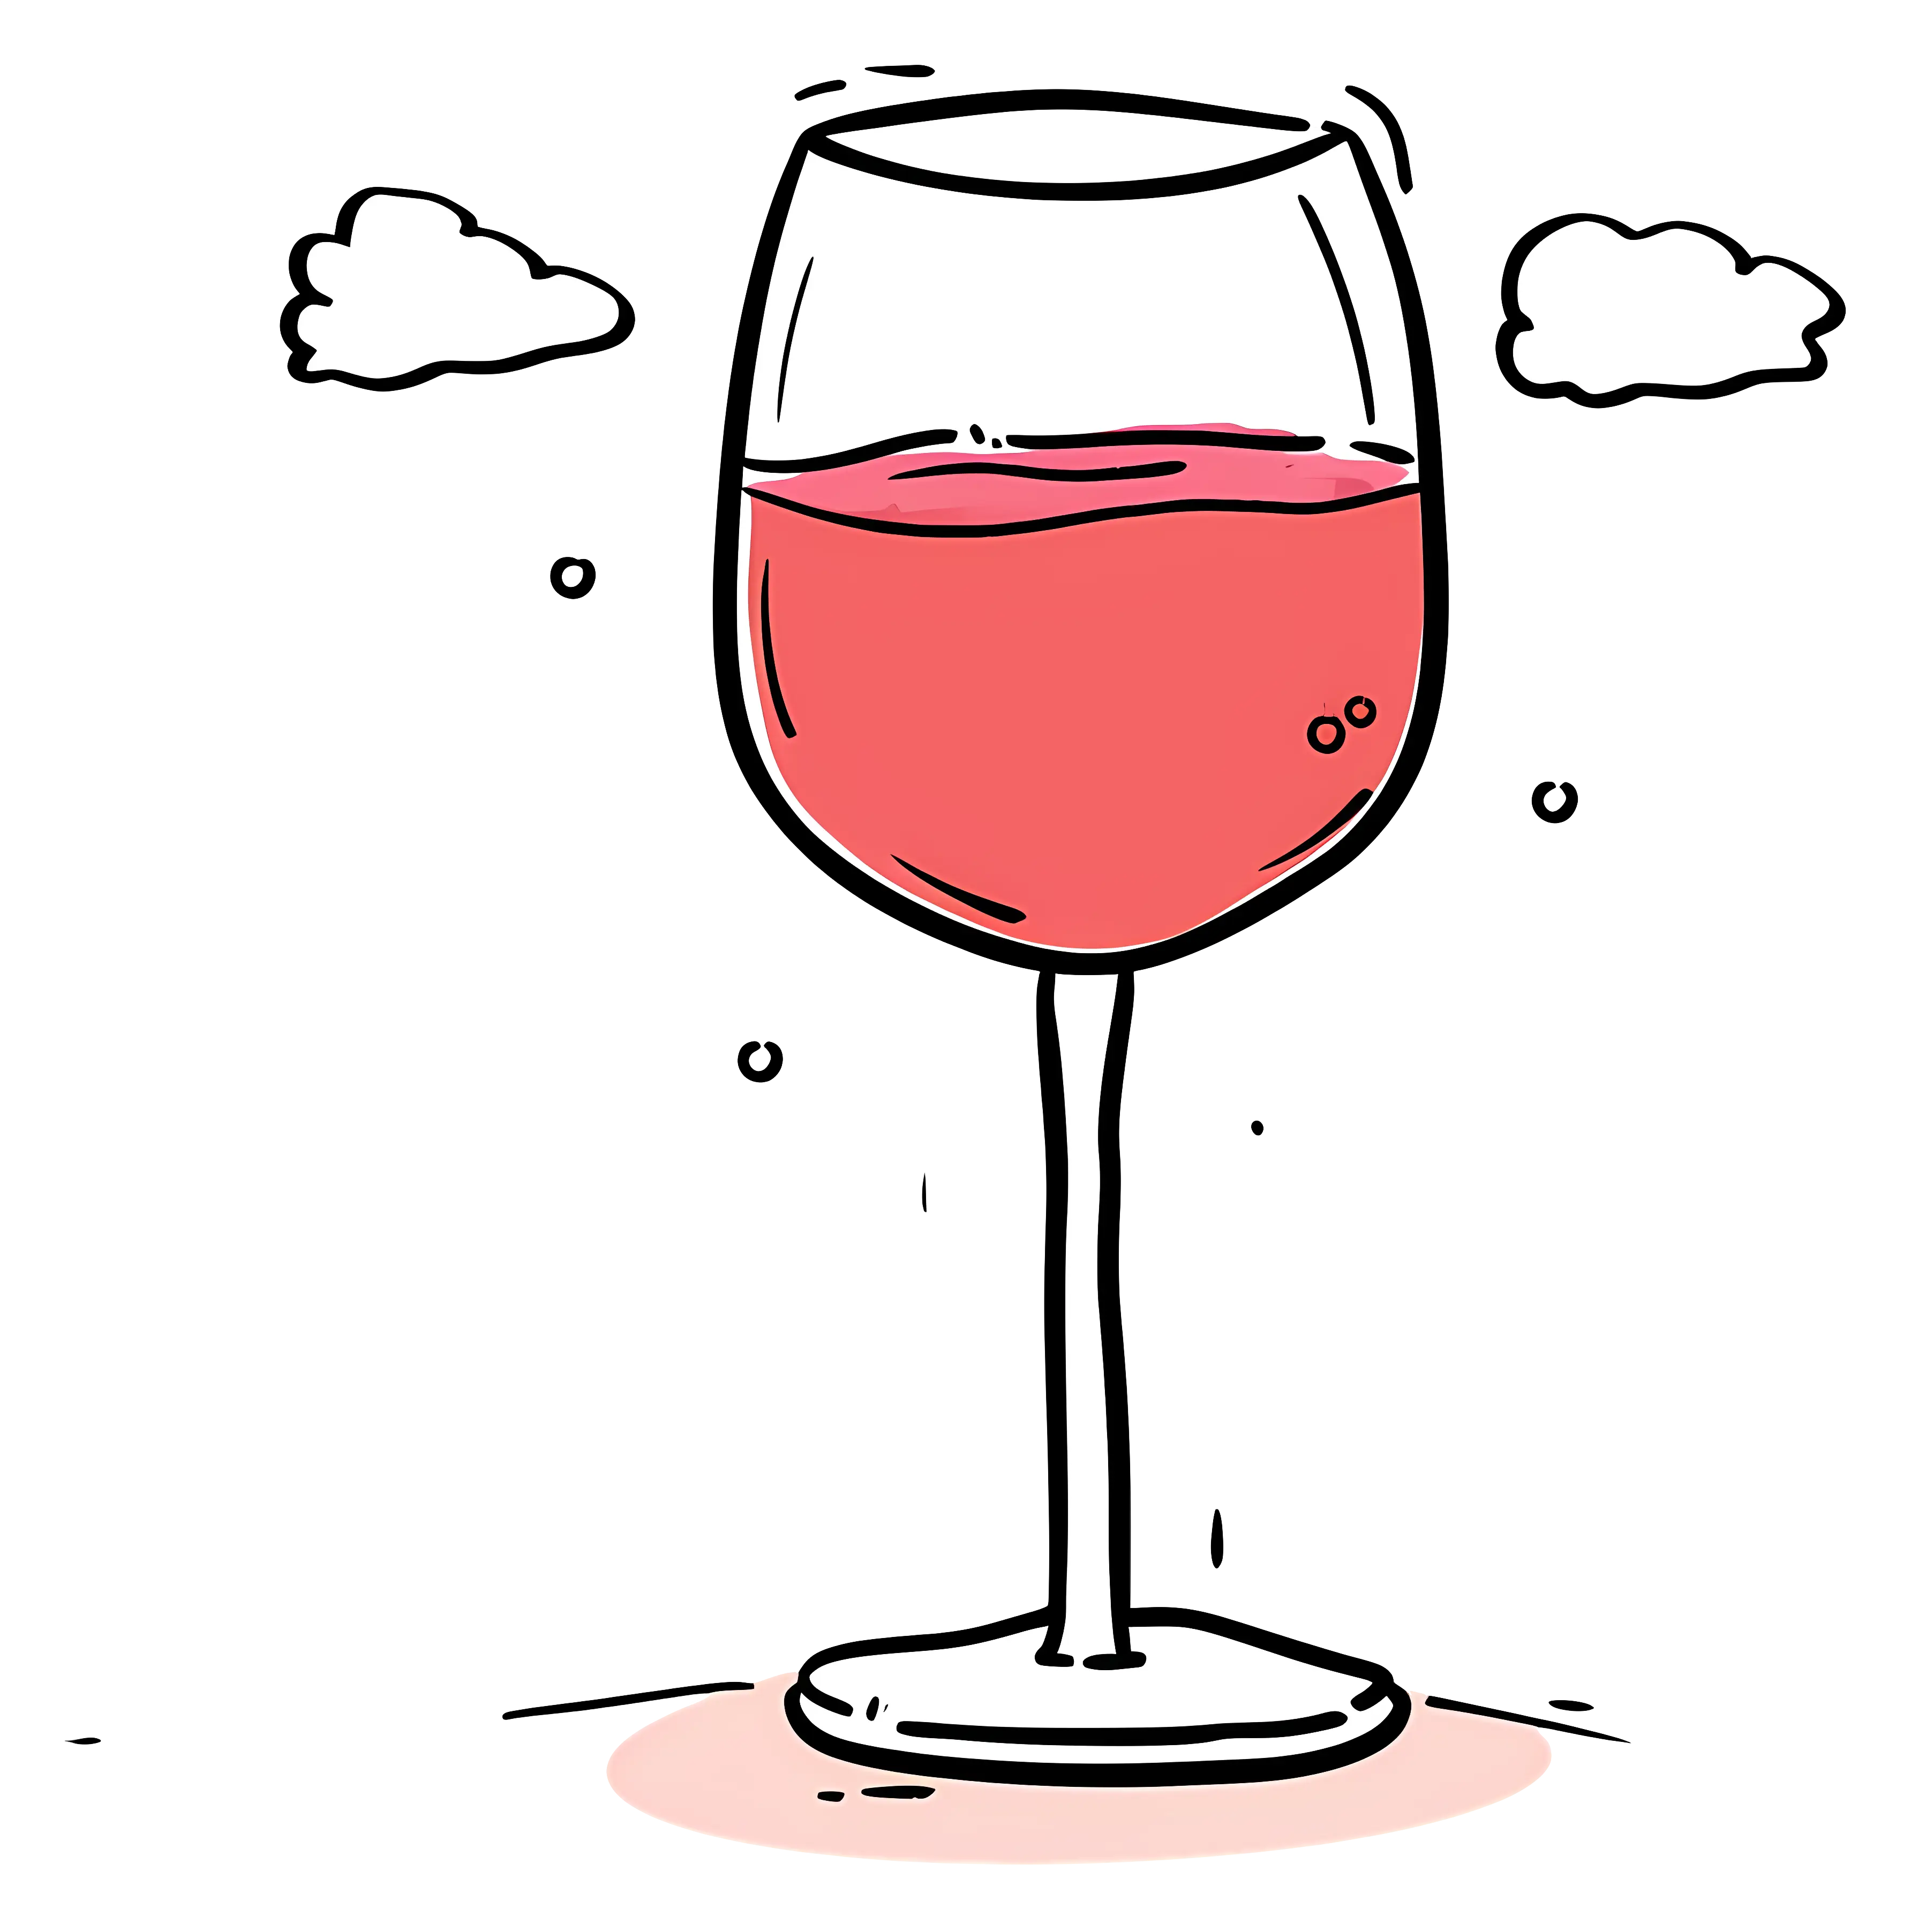
Wine Glass with Red Wine -

Green Globe Icon Representing Sustainability -

Elegant Blue Rose with Vibrant Petals -

Magnifying Glass with Blue Lens -
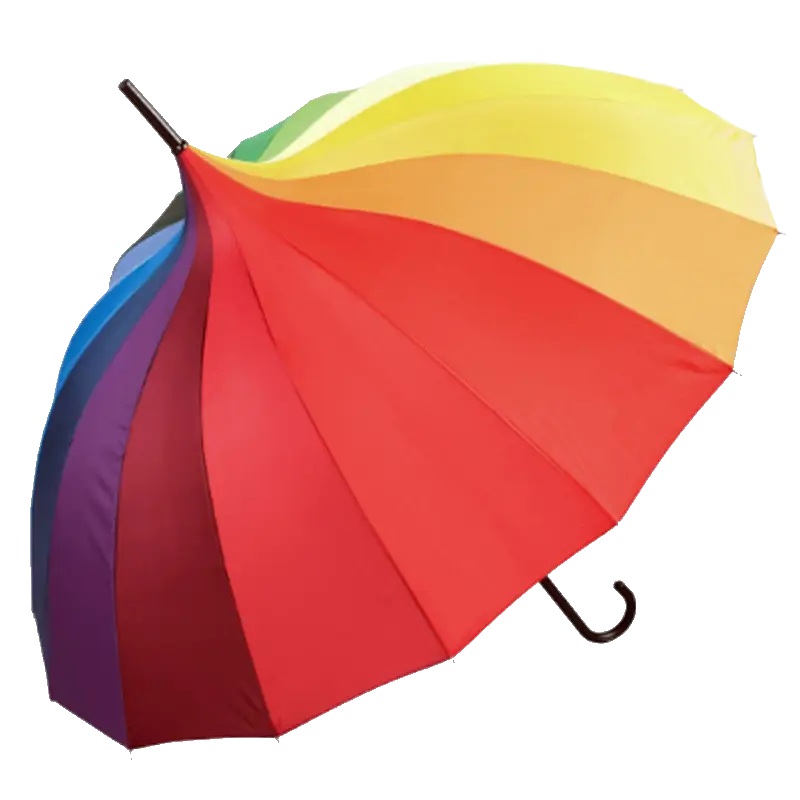
Multicolored Umbrella for Weather Protection -
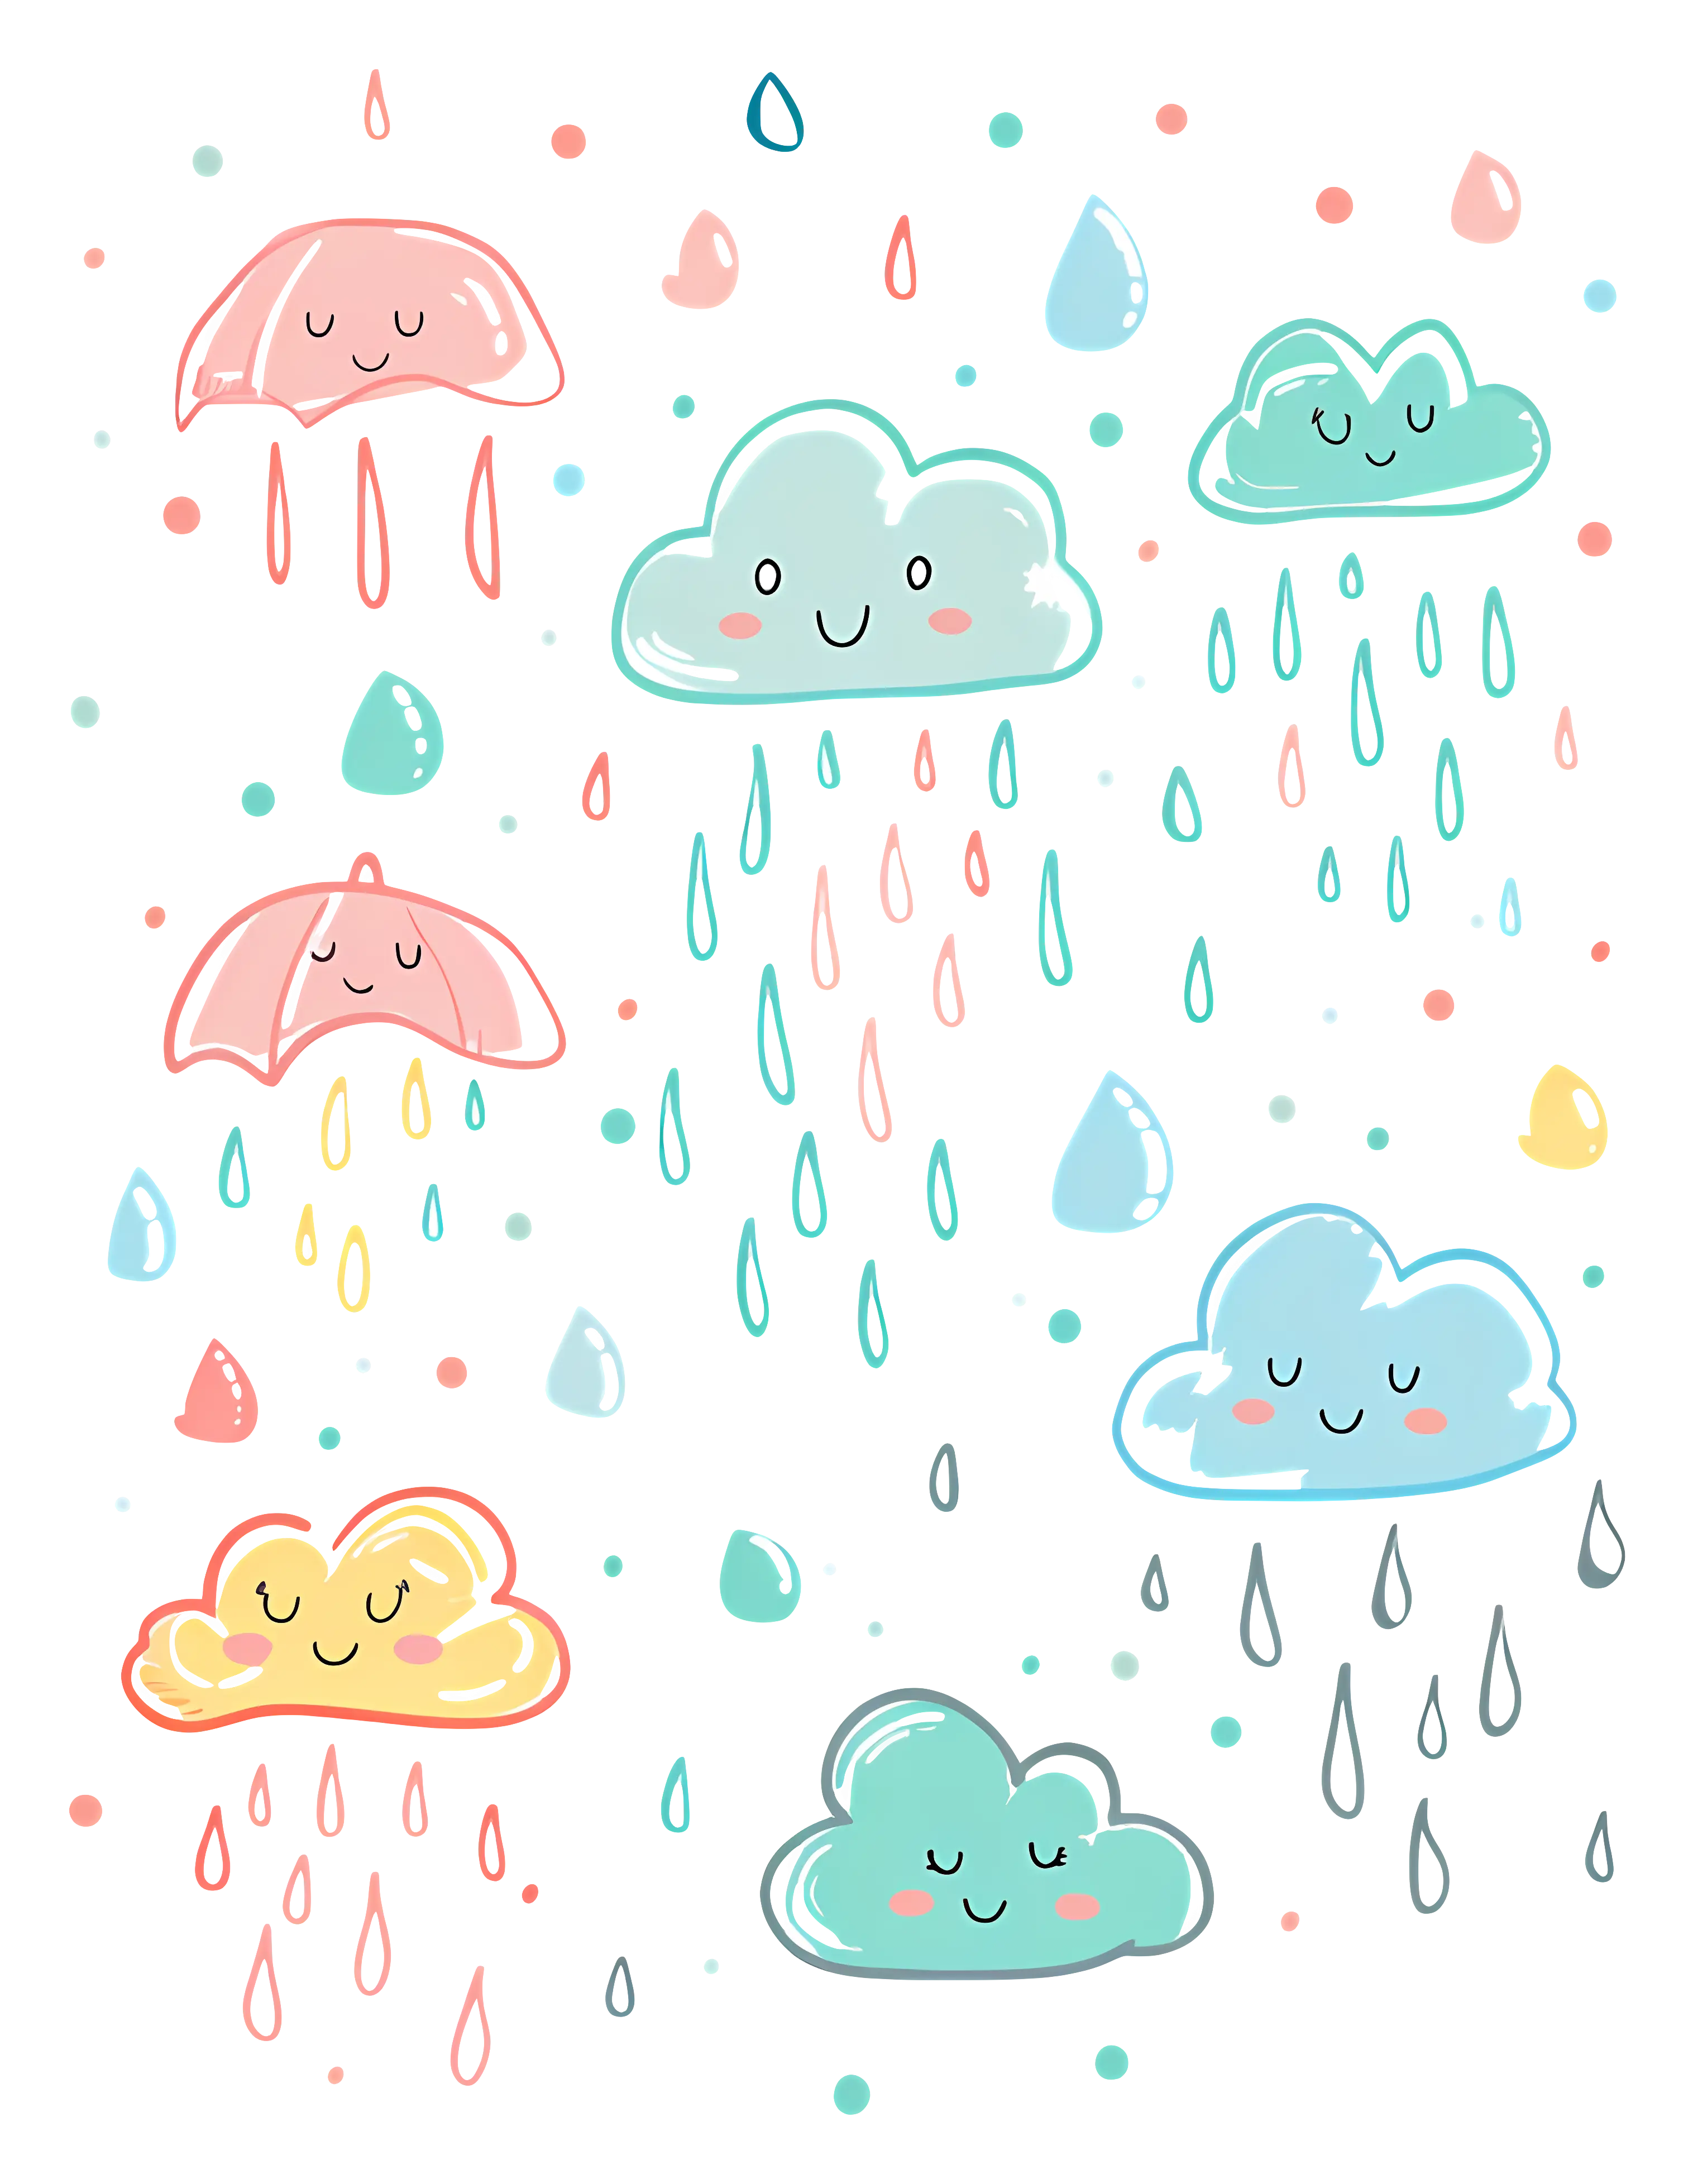
Cute Rain Clouds and Umbrellas Illustration -

Graph Plot with Blue Curve Illustration -

Black Windy Weather Icon -

Love You Lots Text with Rose and Arrow Design -

Vibrant Red Rose Flower in Full Bloom -

Electric Room Heater -

Black and White Floral Illustration Sketch -
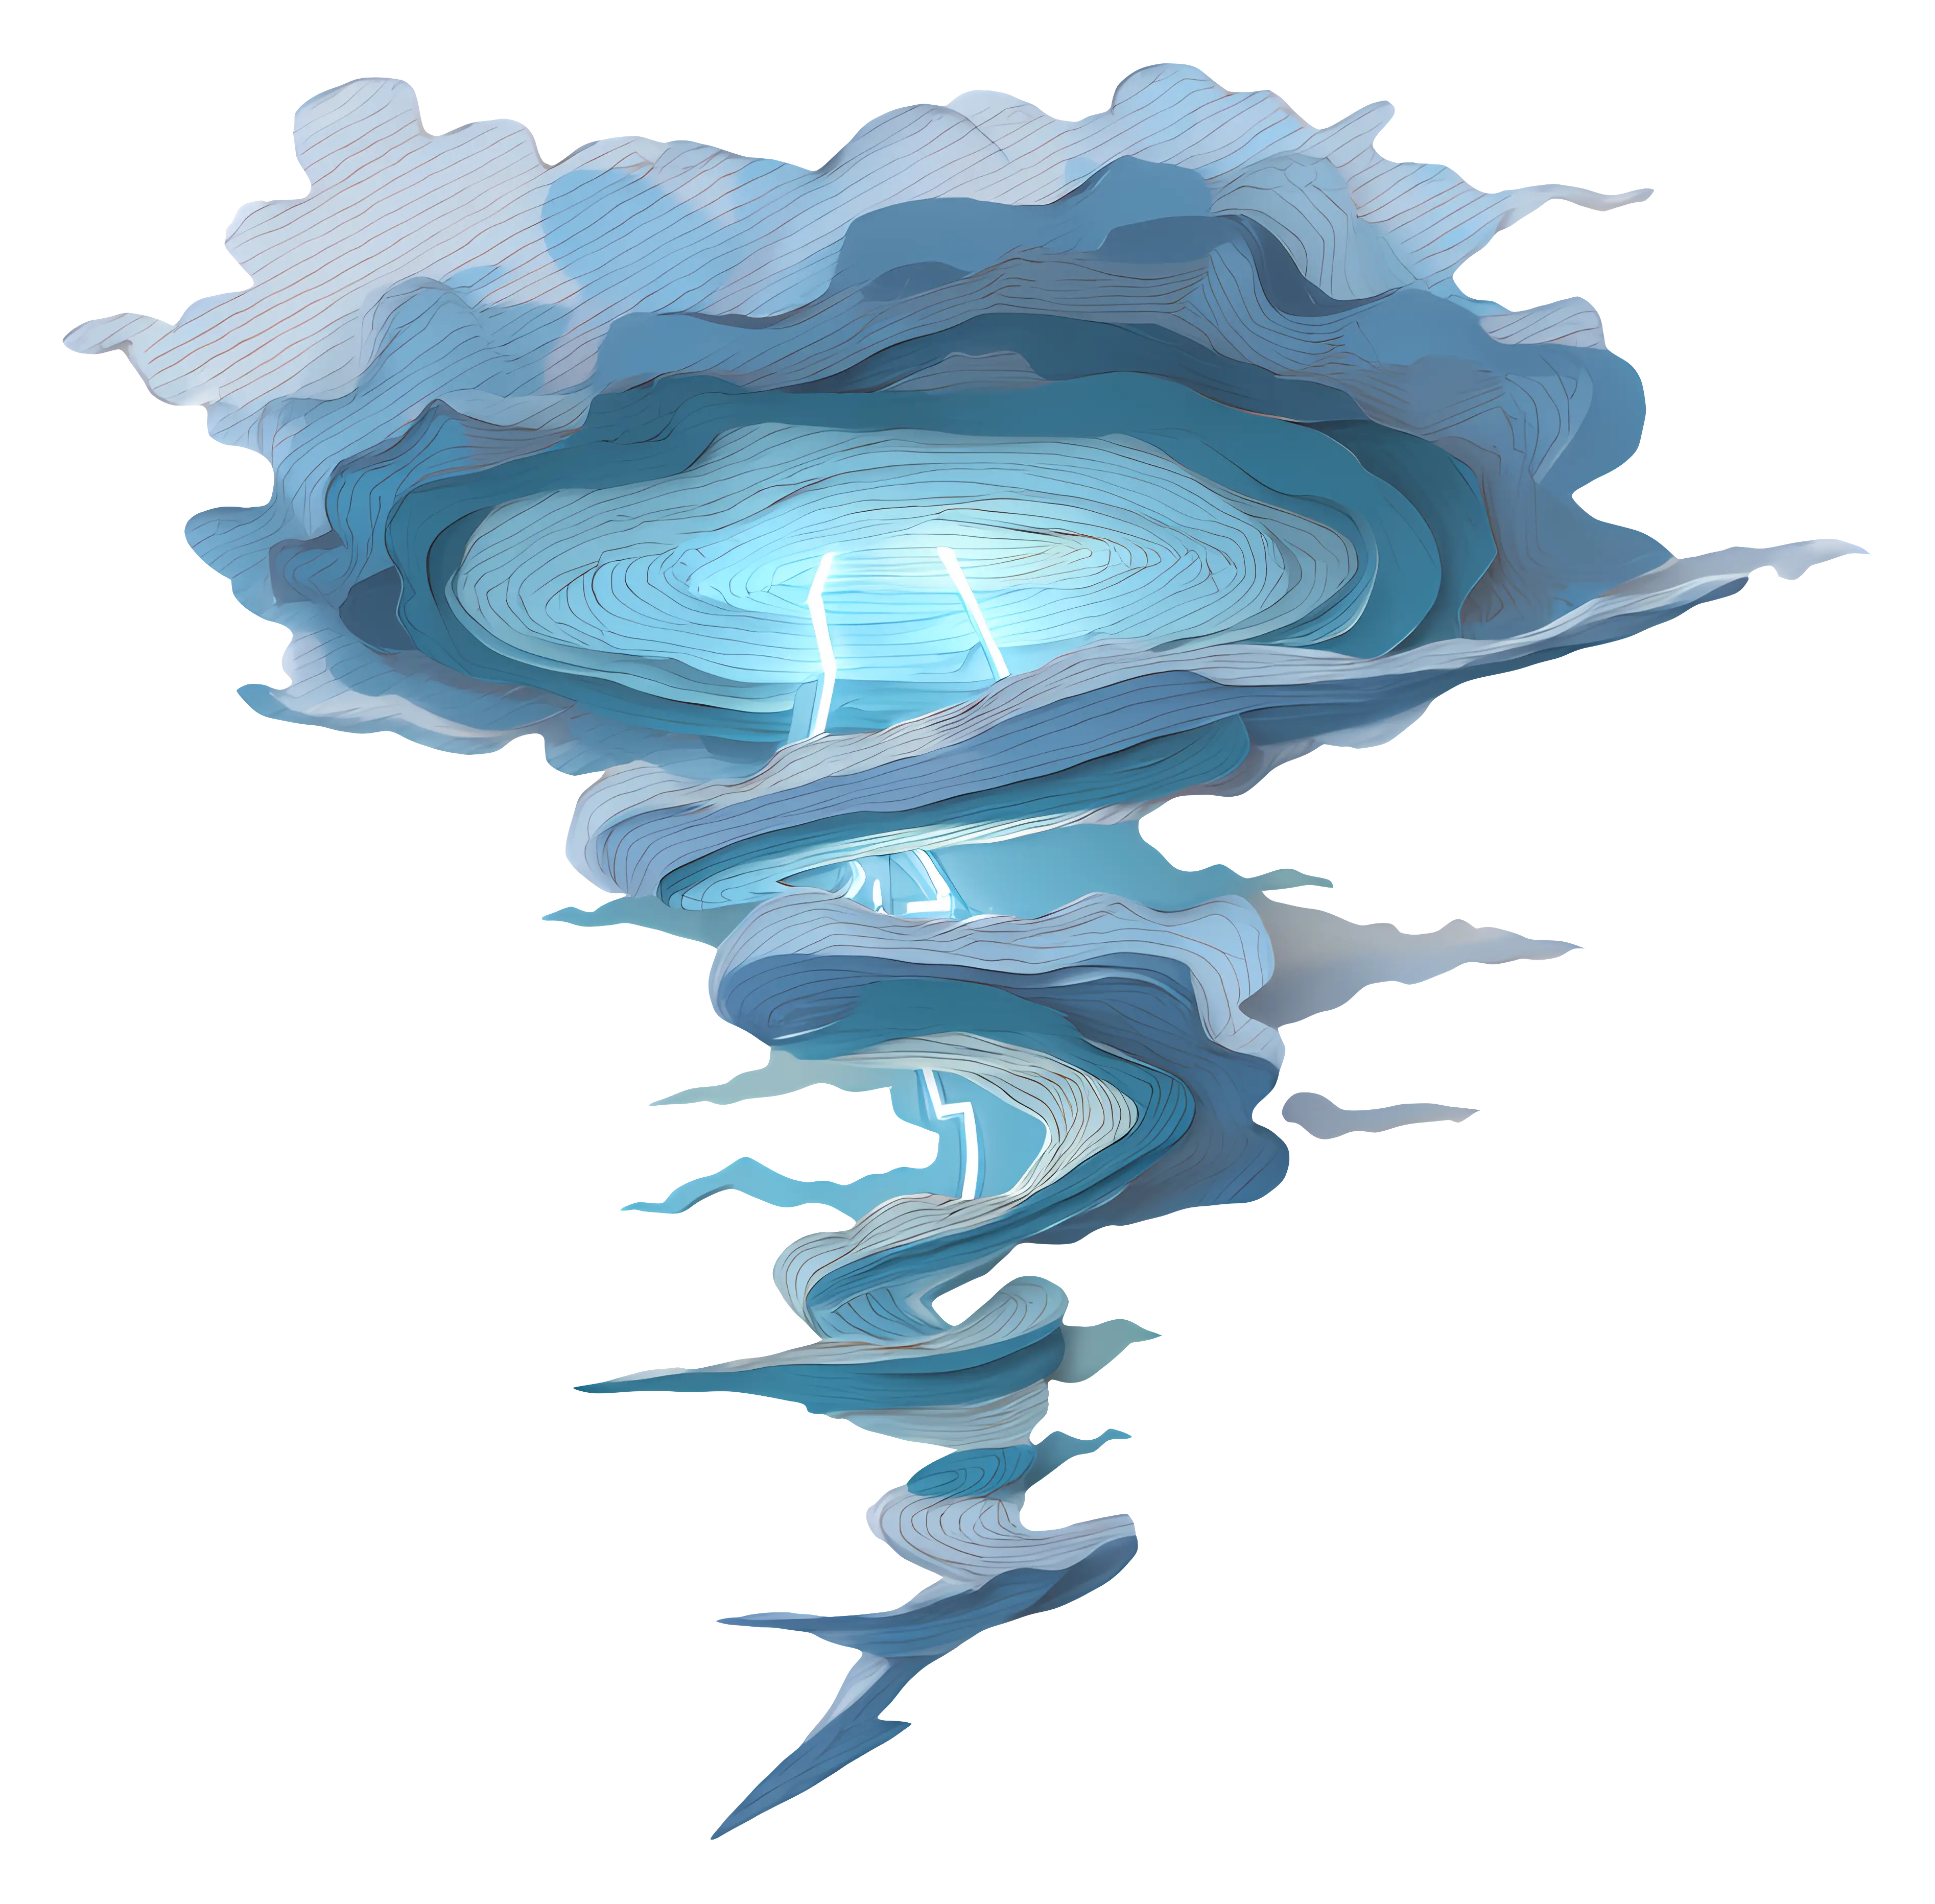
Storm Cloud with Lightning -

Beautiful Red Rose -

Rose Flower Outline Drawing -
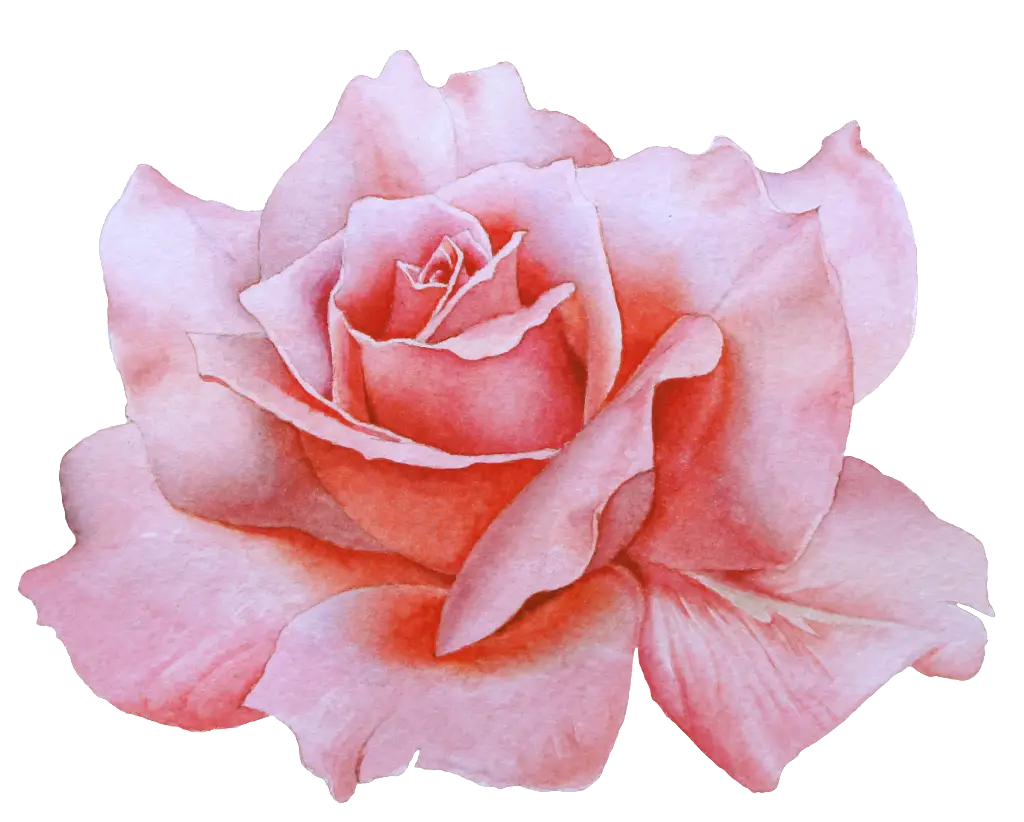
Beautiful Pink Rose Blossom -
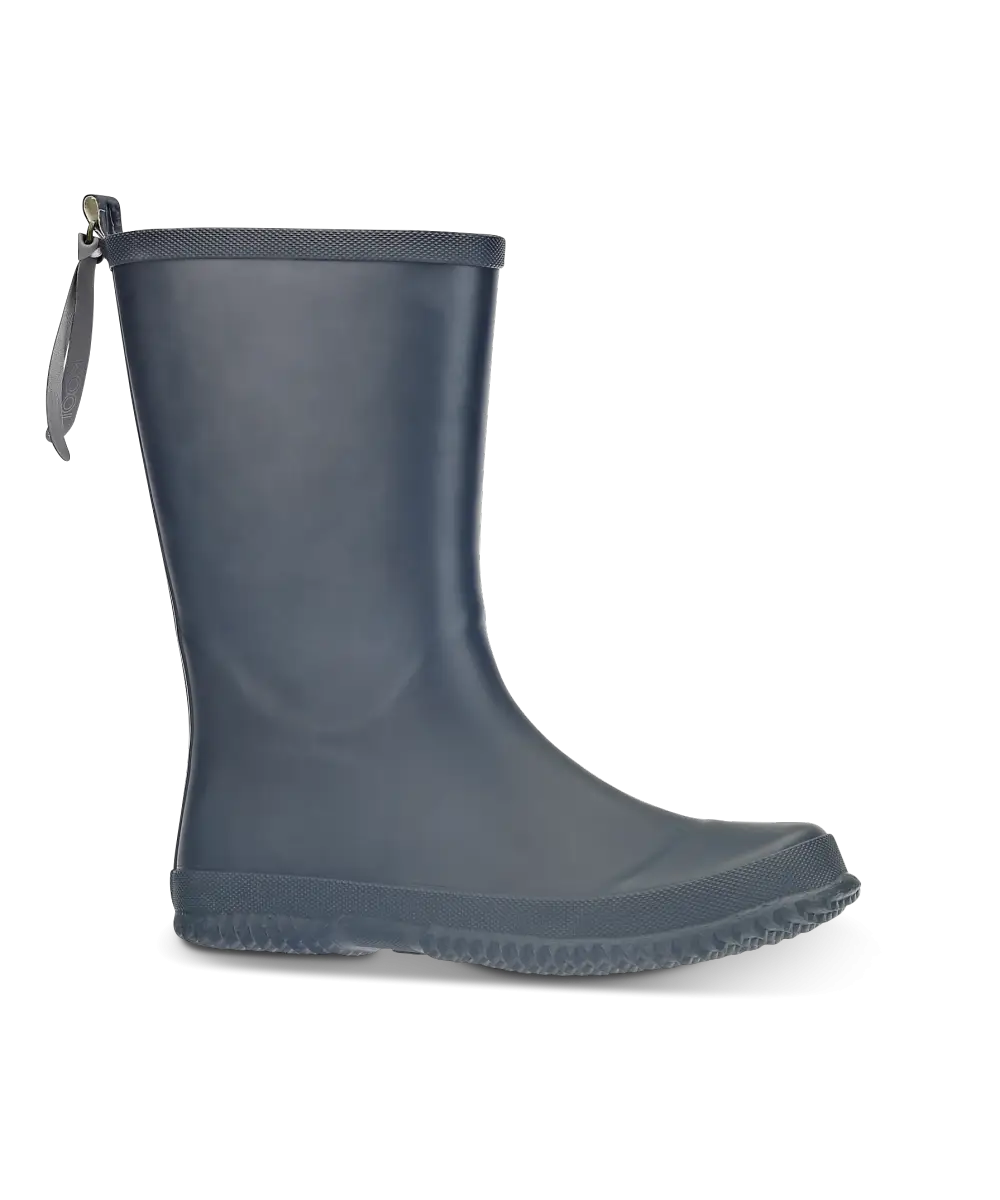
Classic Black Rubber Rain Boot -
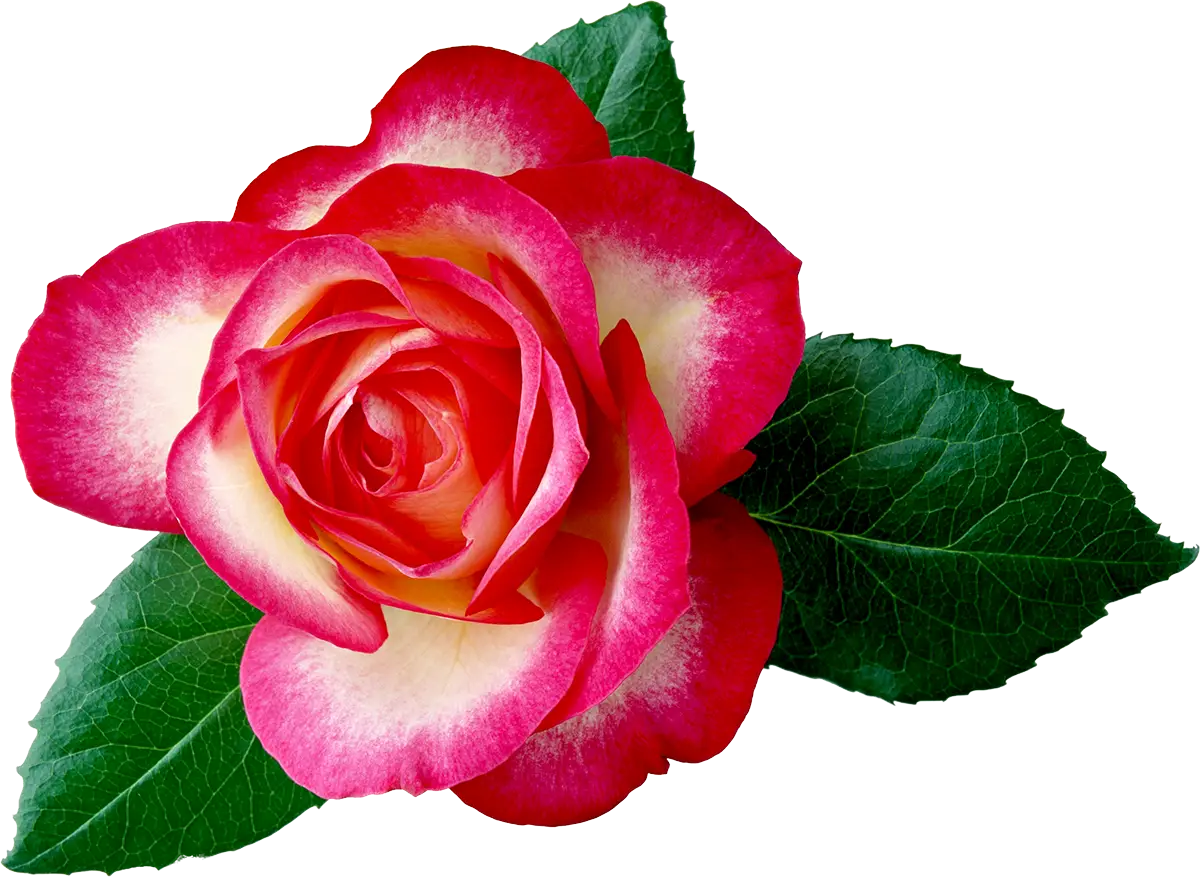
Beautiful Pink Rose with Green Leaves -
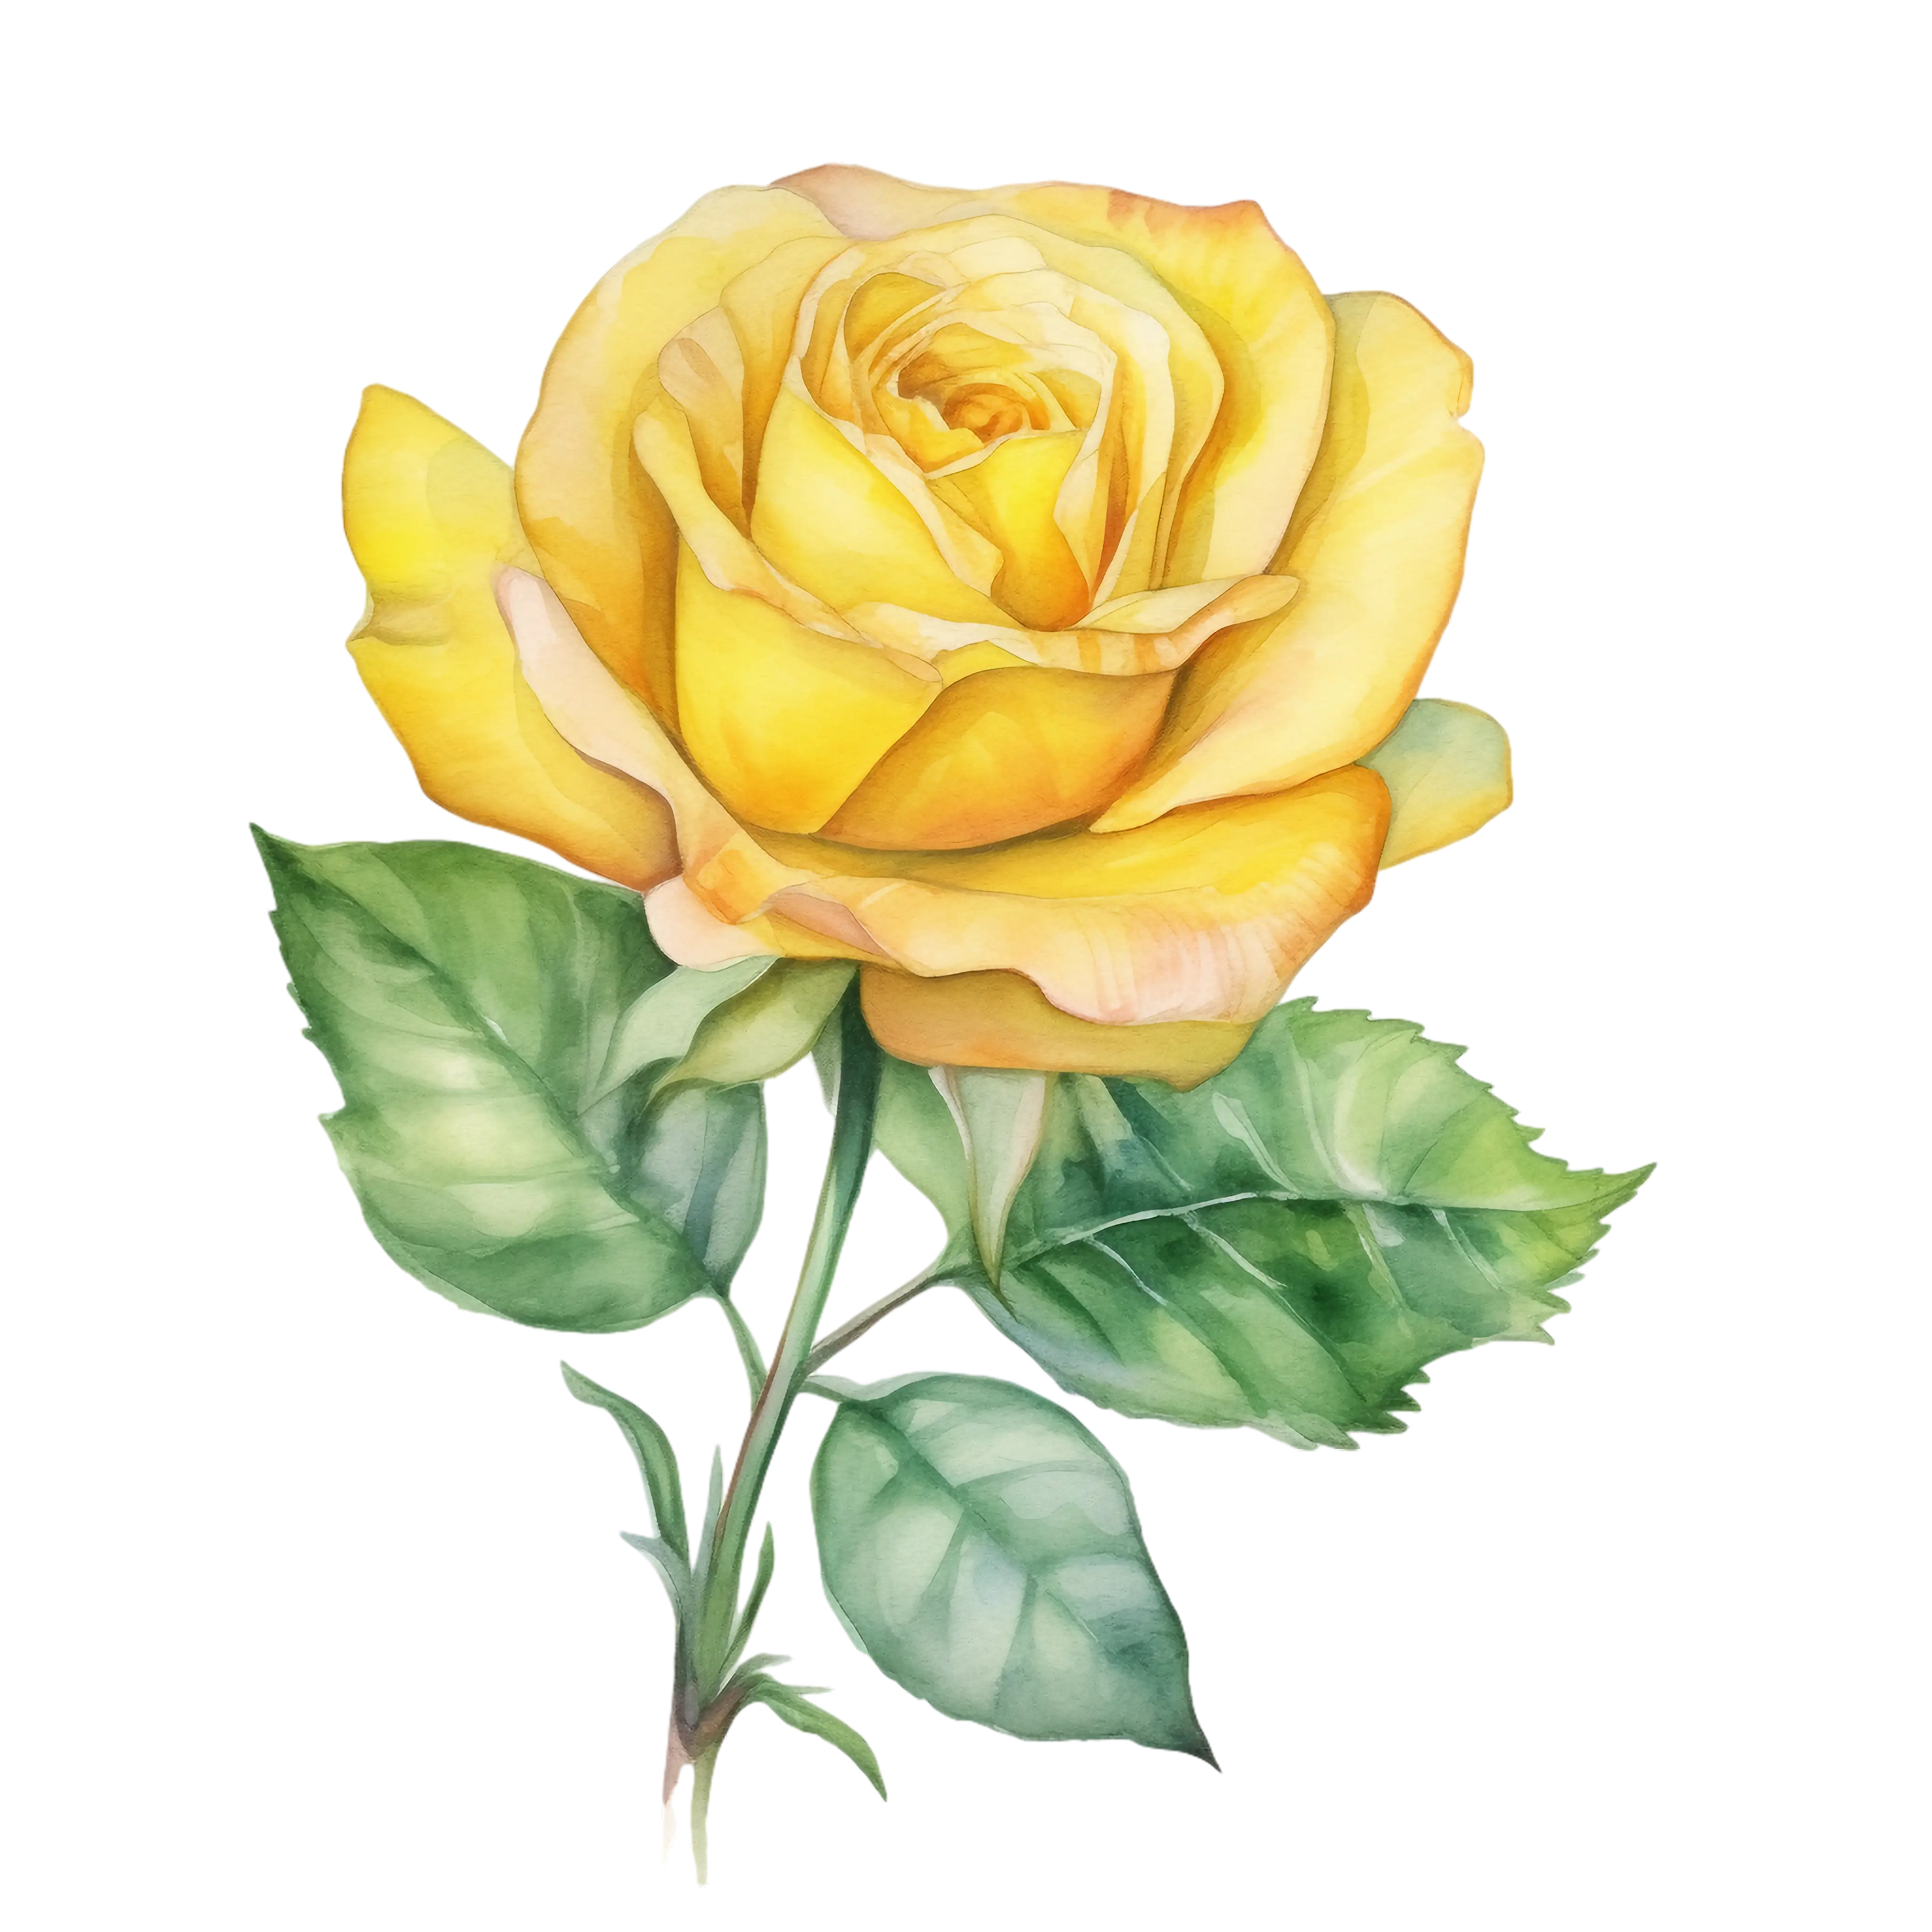
Beautiful Yellow Rose Illustration -
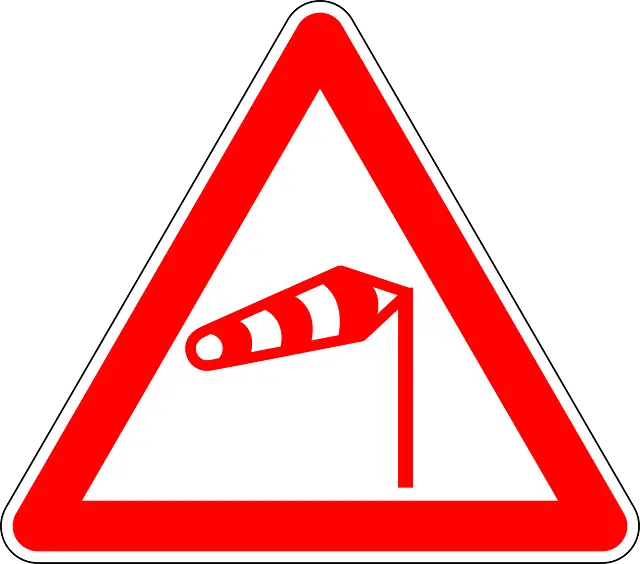
Red Triangle Wind Warning Road Sign -
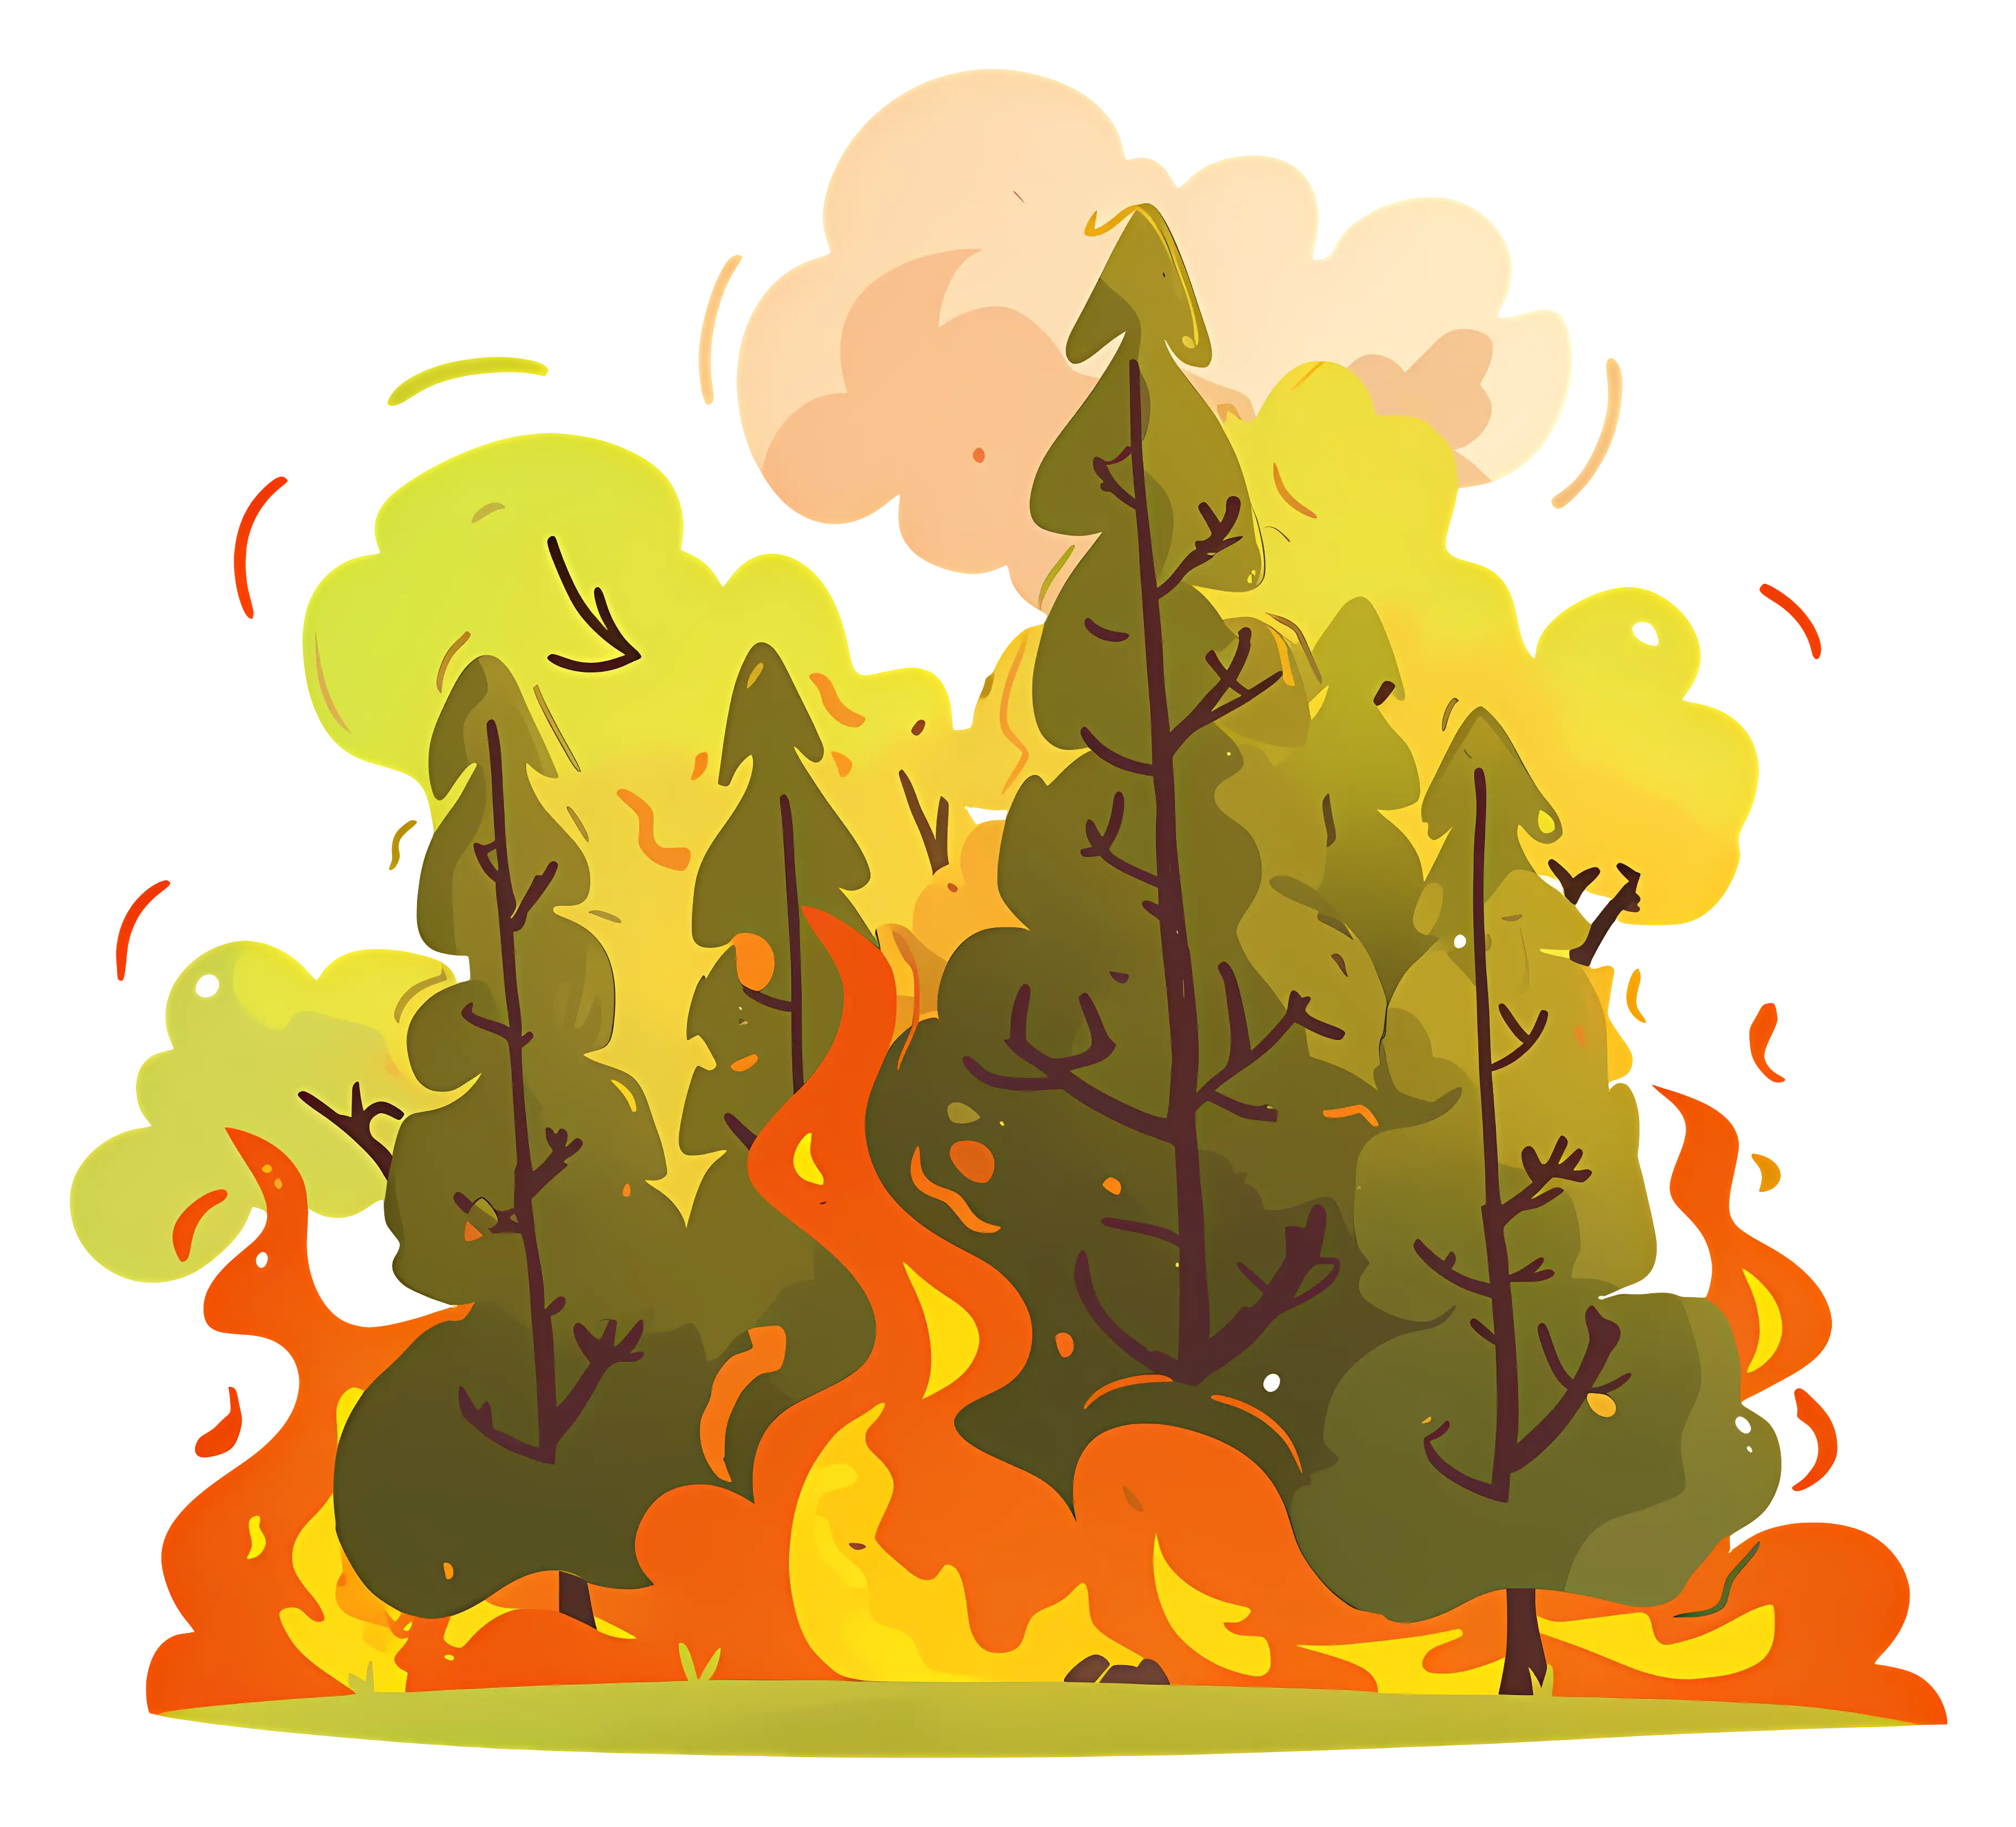
Burning Forest with Flames -

Digestive System Diagram -
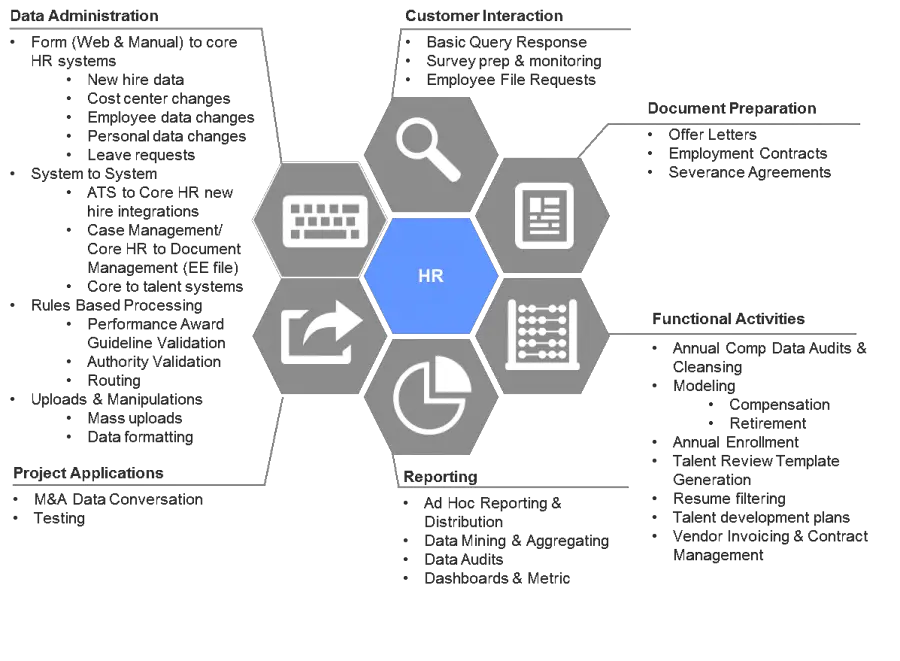
HR Workflow Diagram -

Eco-friendly Green Hourglass -
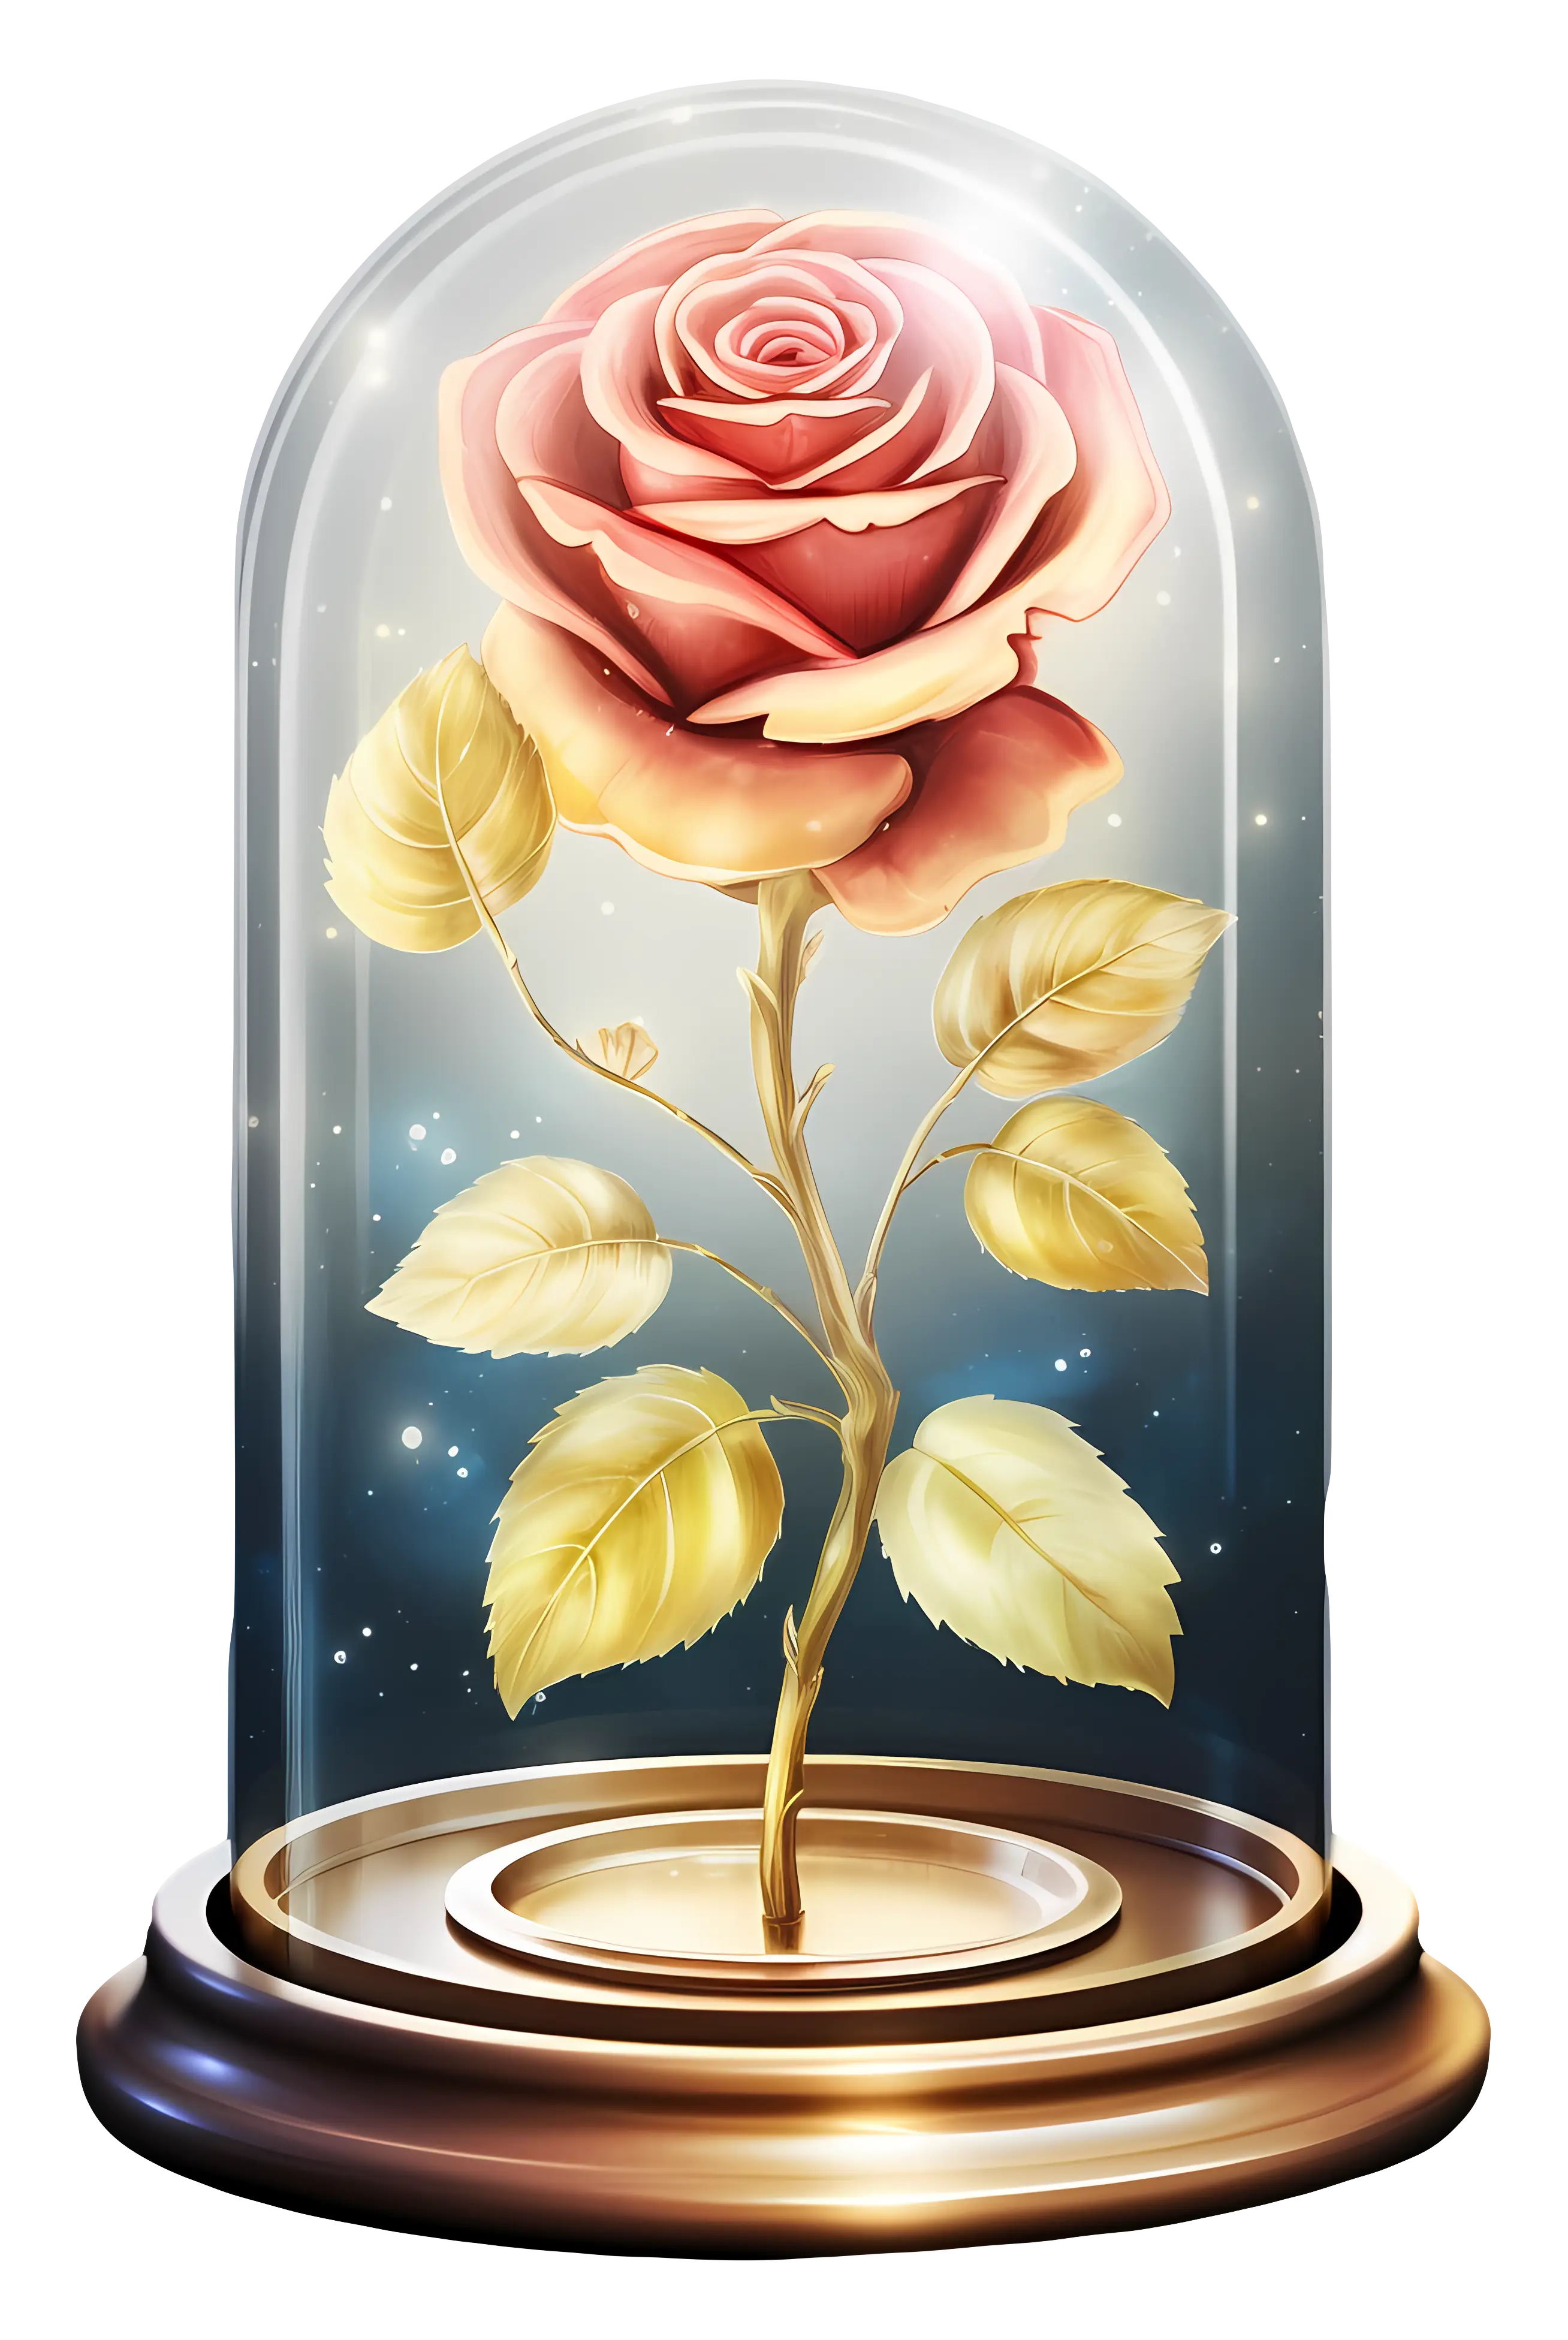
Enchanted Rose in Glass Display Dome -

Umbrella with Falling Raindrops Icon -
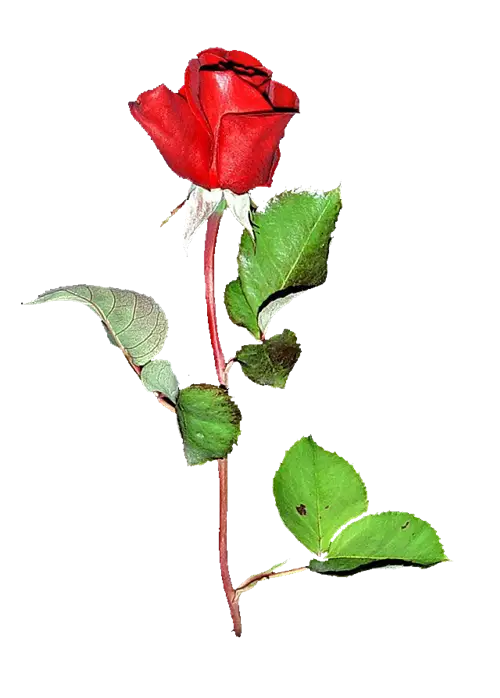
Red Rose Flower with Green Leaves -

Simple Black Wind Symbol -

Elegant Rose Bouquet with Green Leaves