You Might Like
-
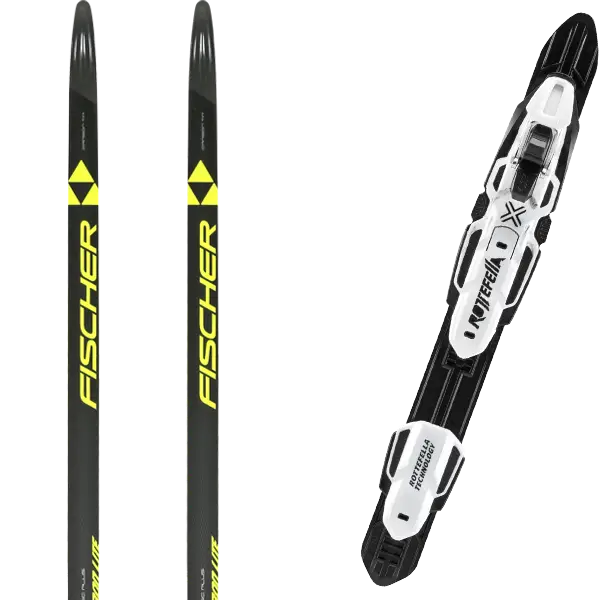
High-Performance Fischer Ski Equipment -

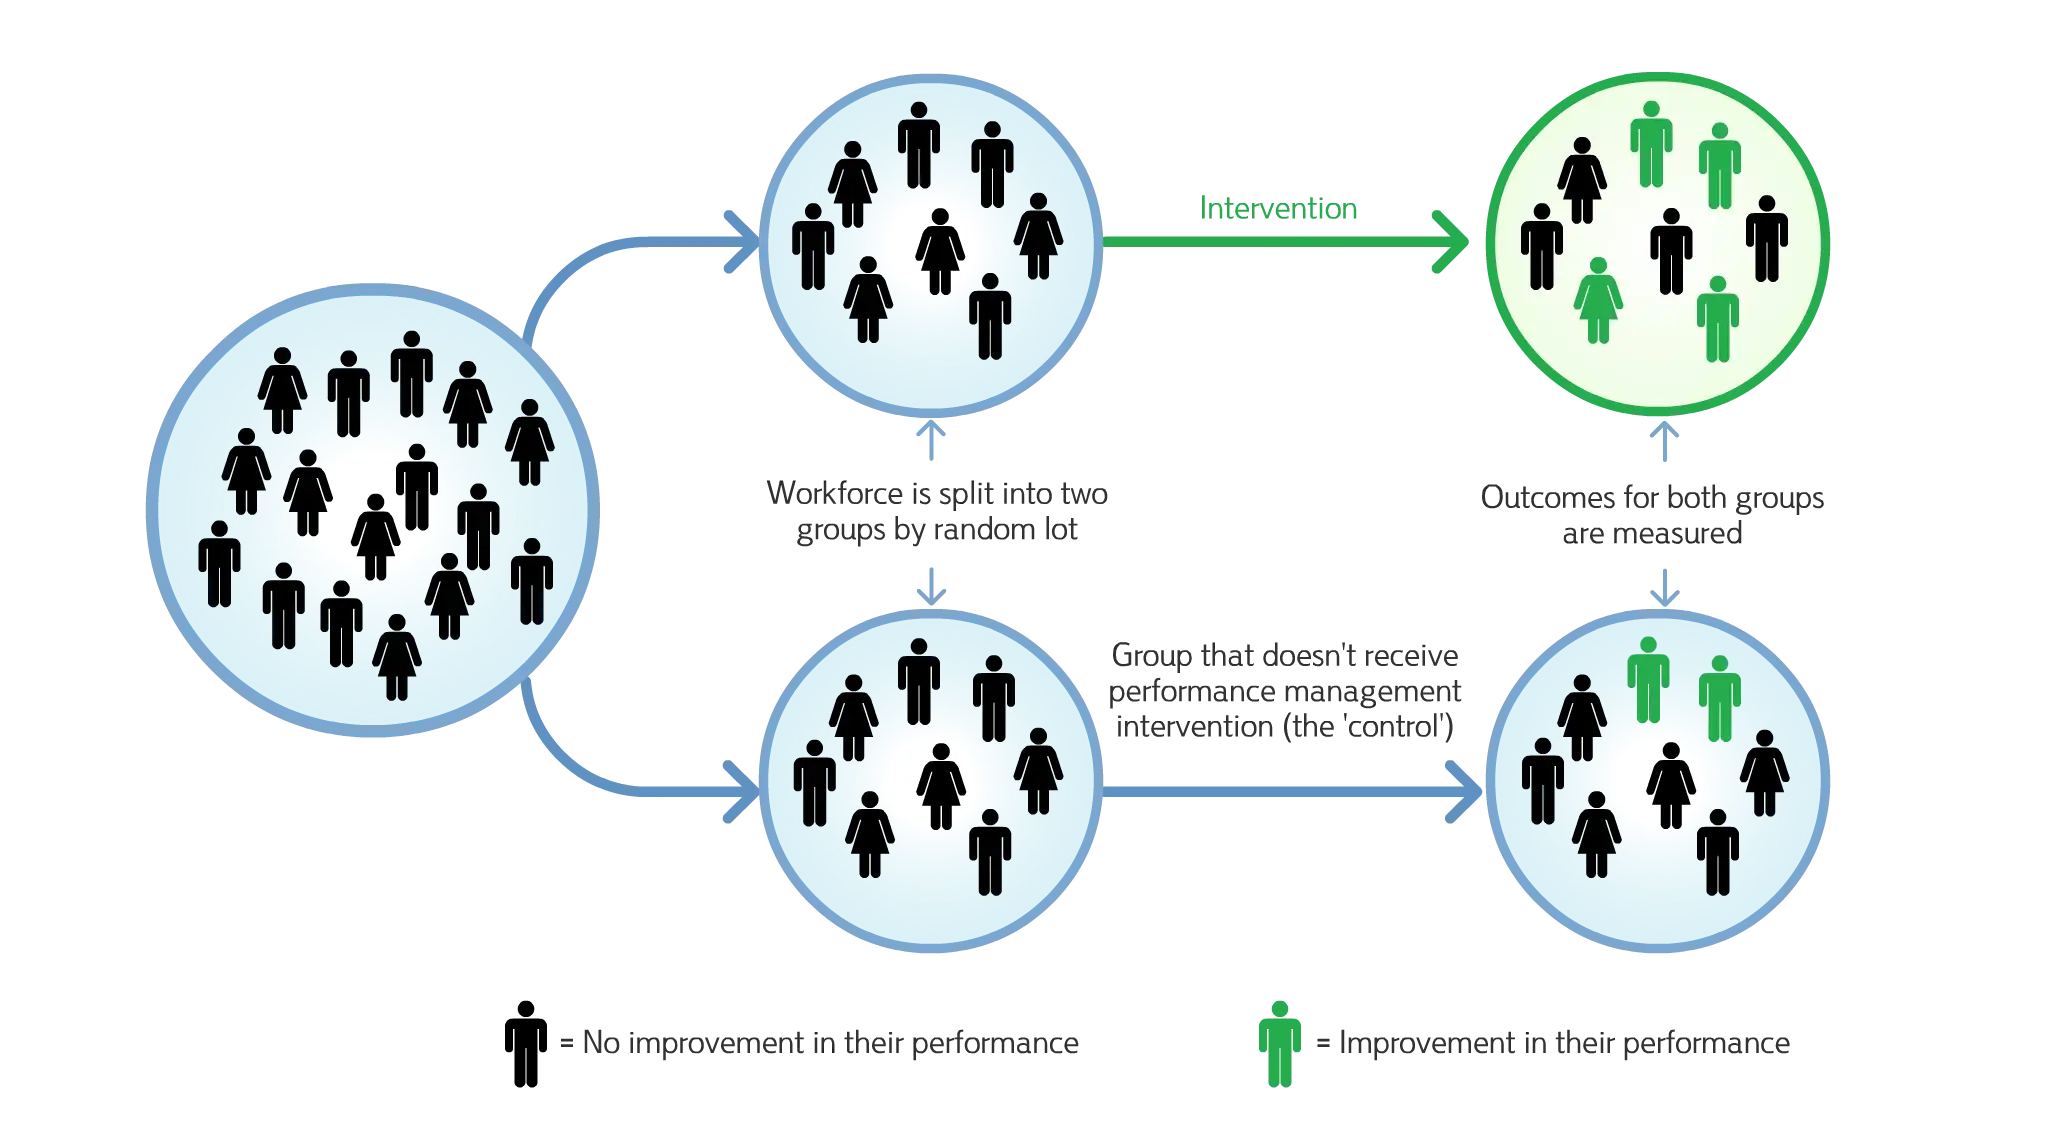
Idea Generation and Teamwork Illustration -

Team with Growth Graph Illustration -
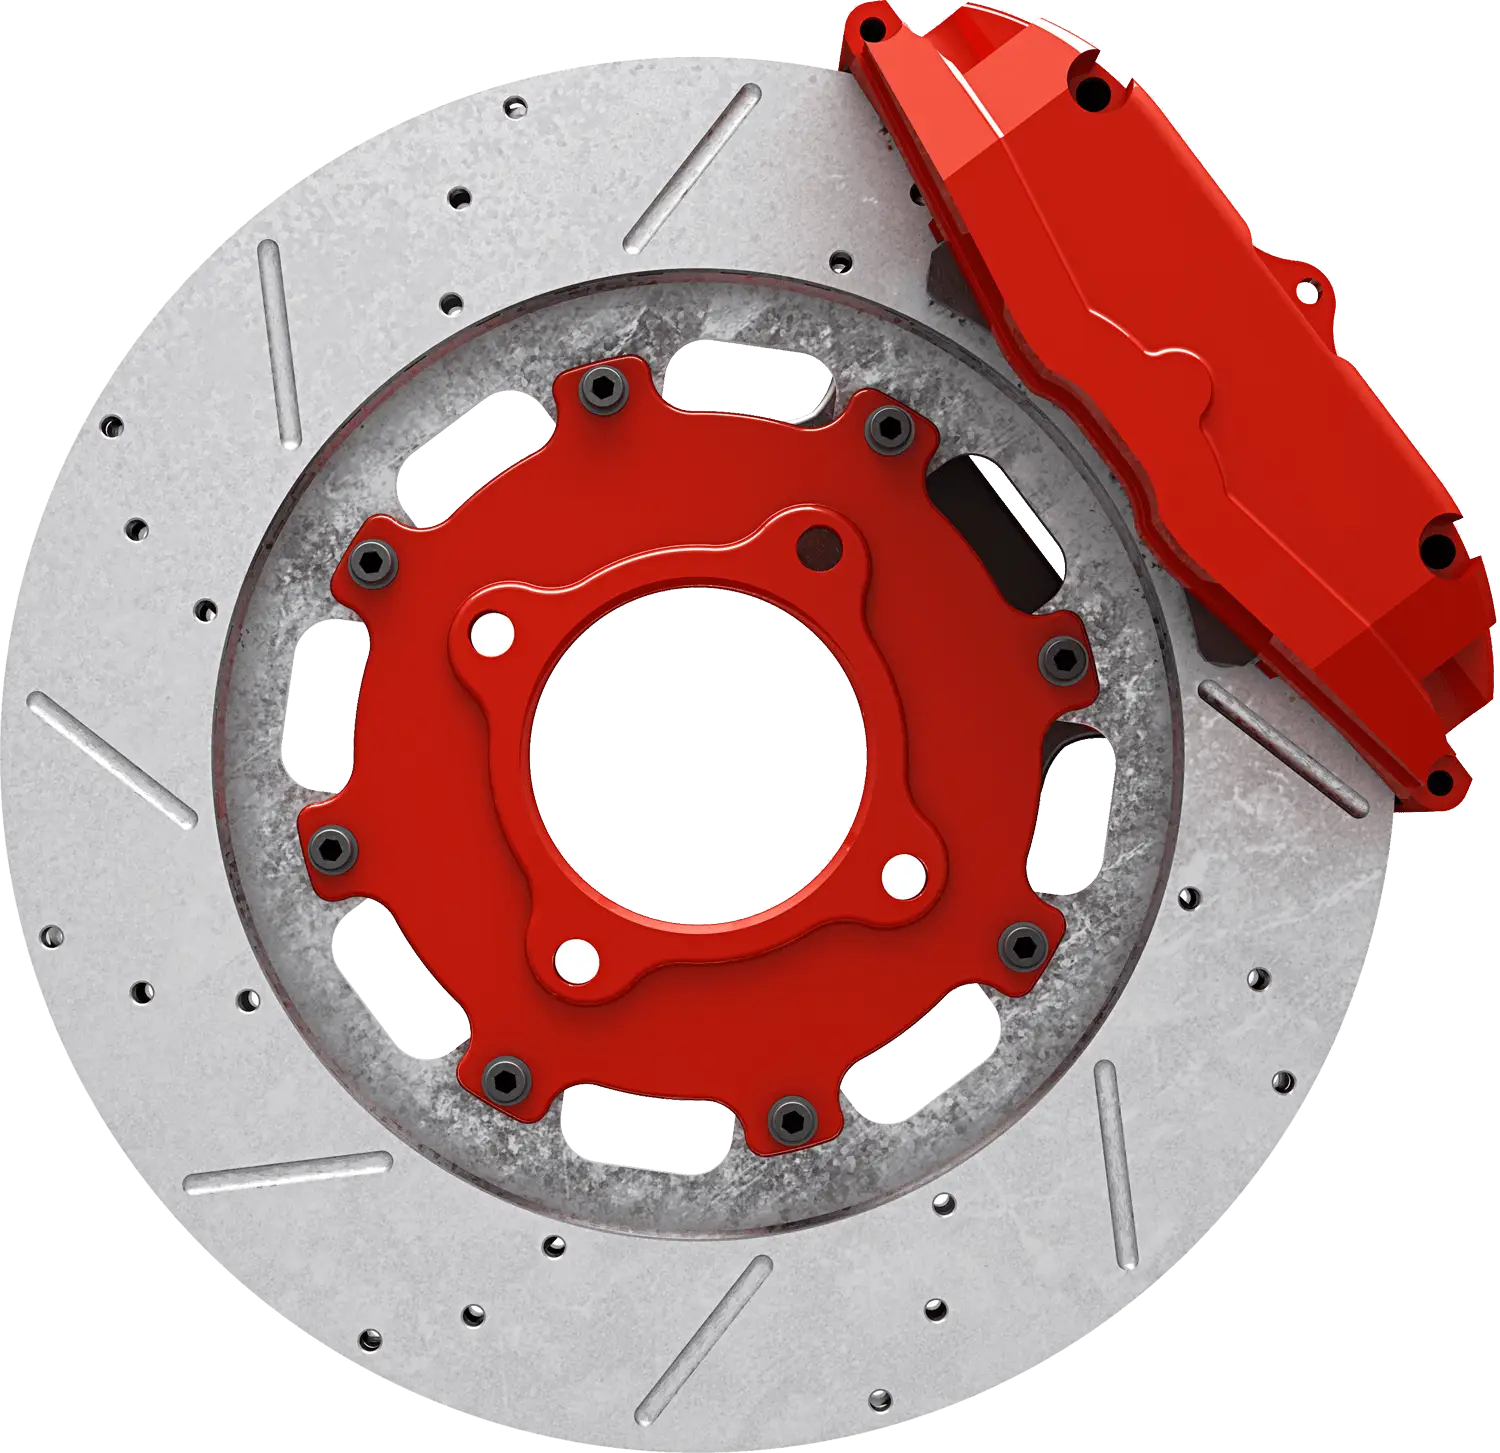
Red Brake Disc Automotive Part -
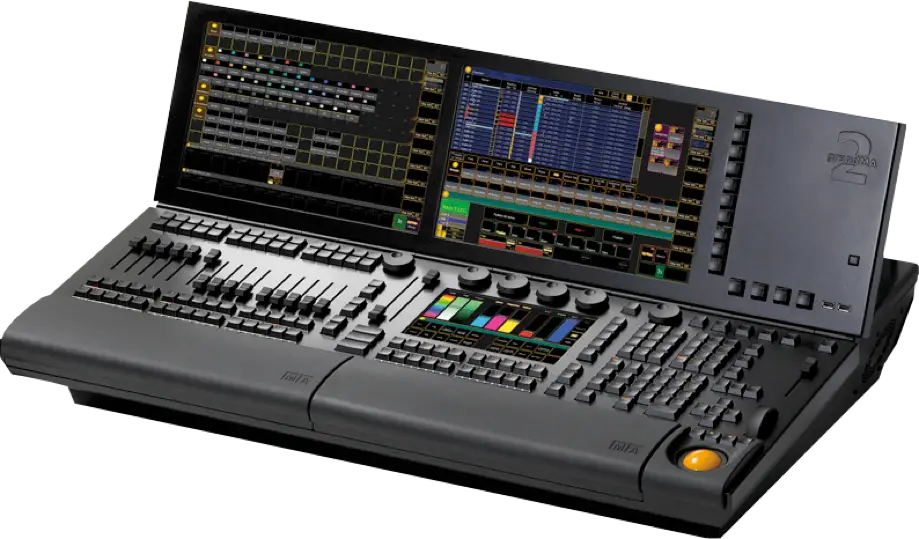
Professional Lighting Console for Stage Performance -

Business Strategy Icons -

Traditional Figure Drawing -
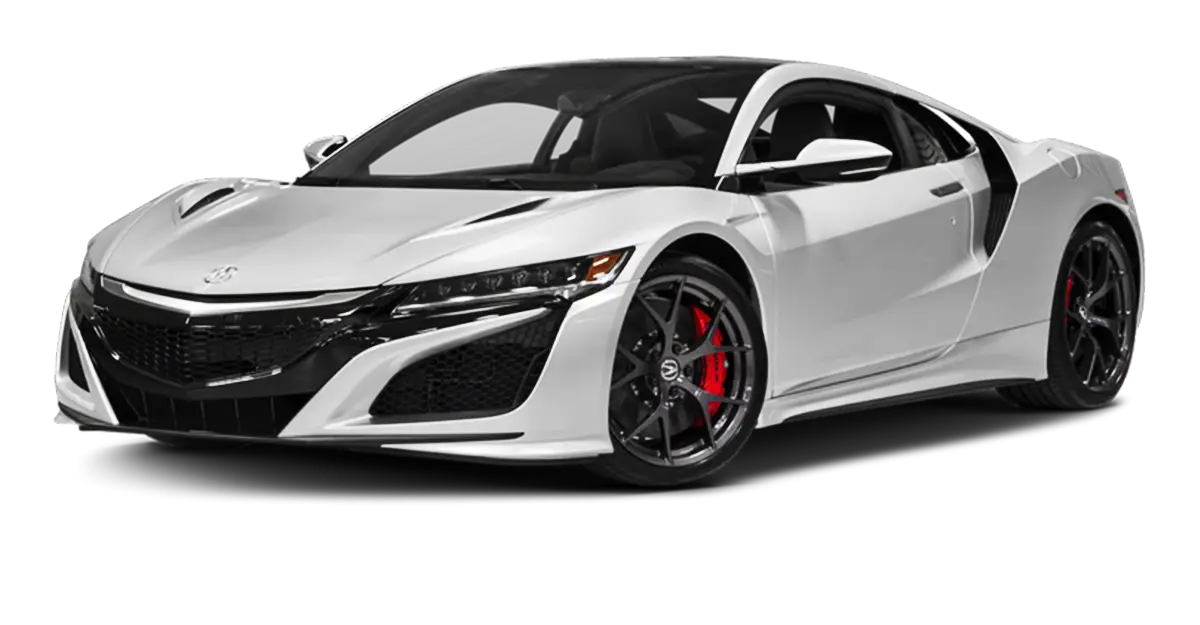
White Sports Luxury Car -
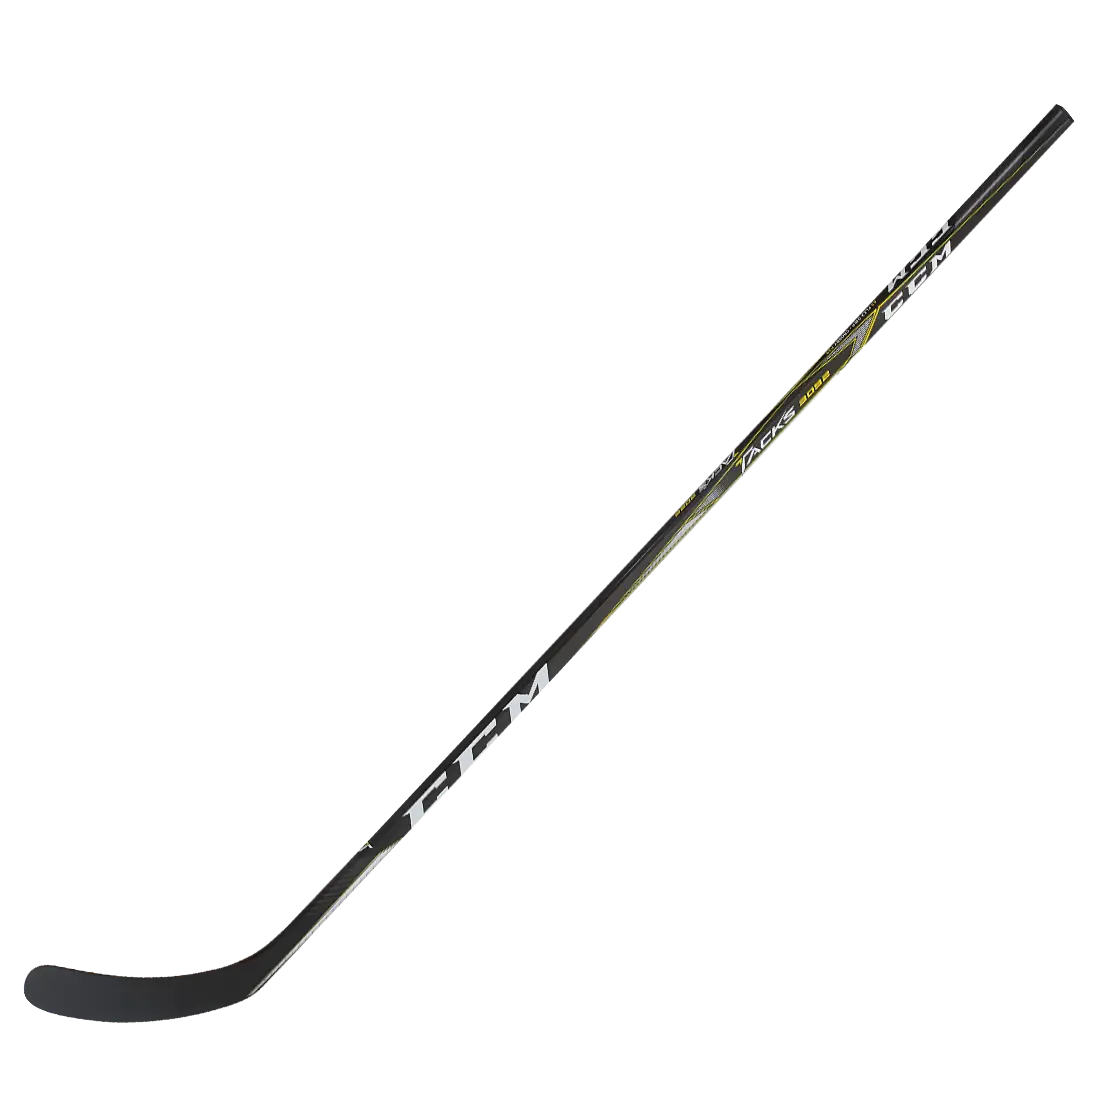
Black Hockey Stick for Sports Use -

Businessmen Climbing Stairs -

Organizational Structure Chart -
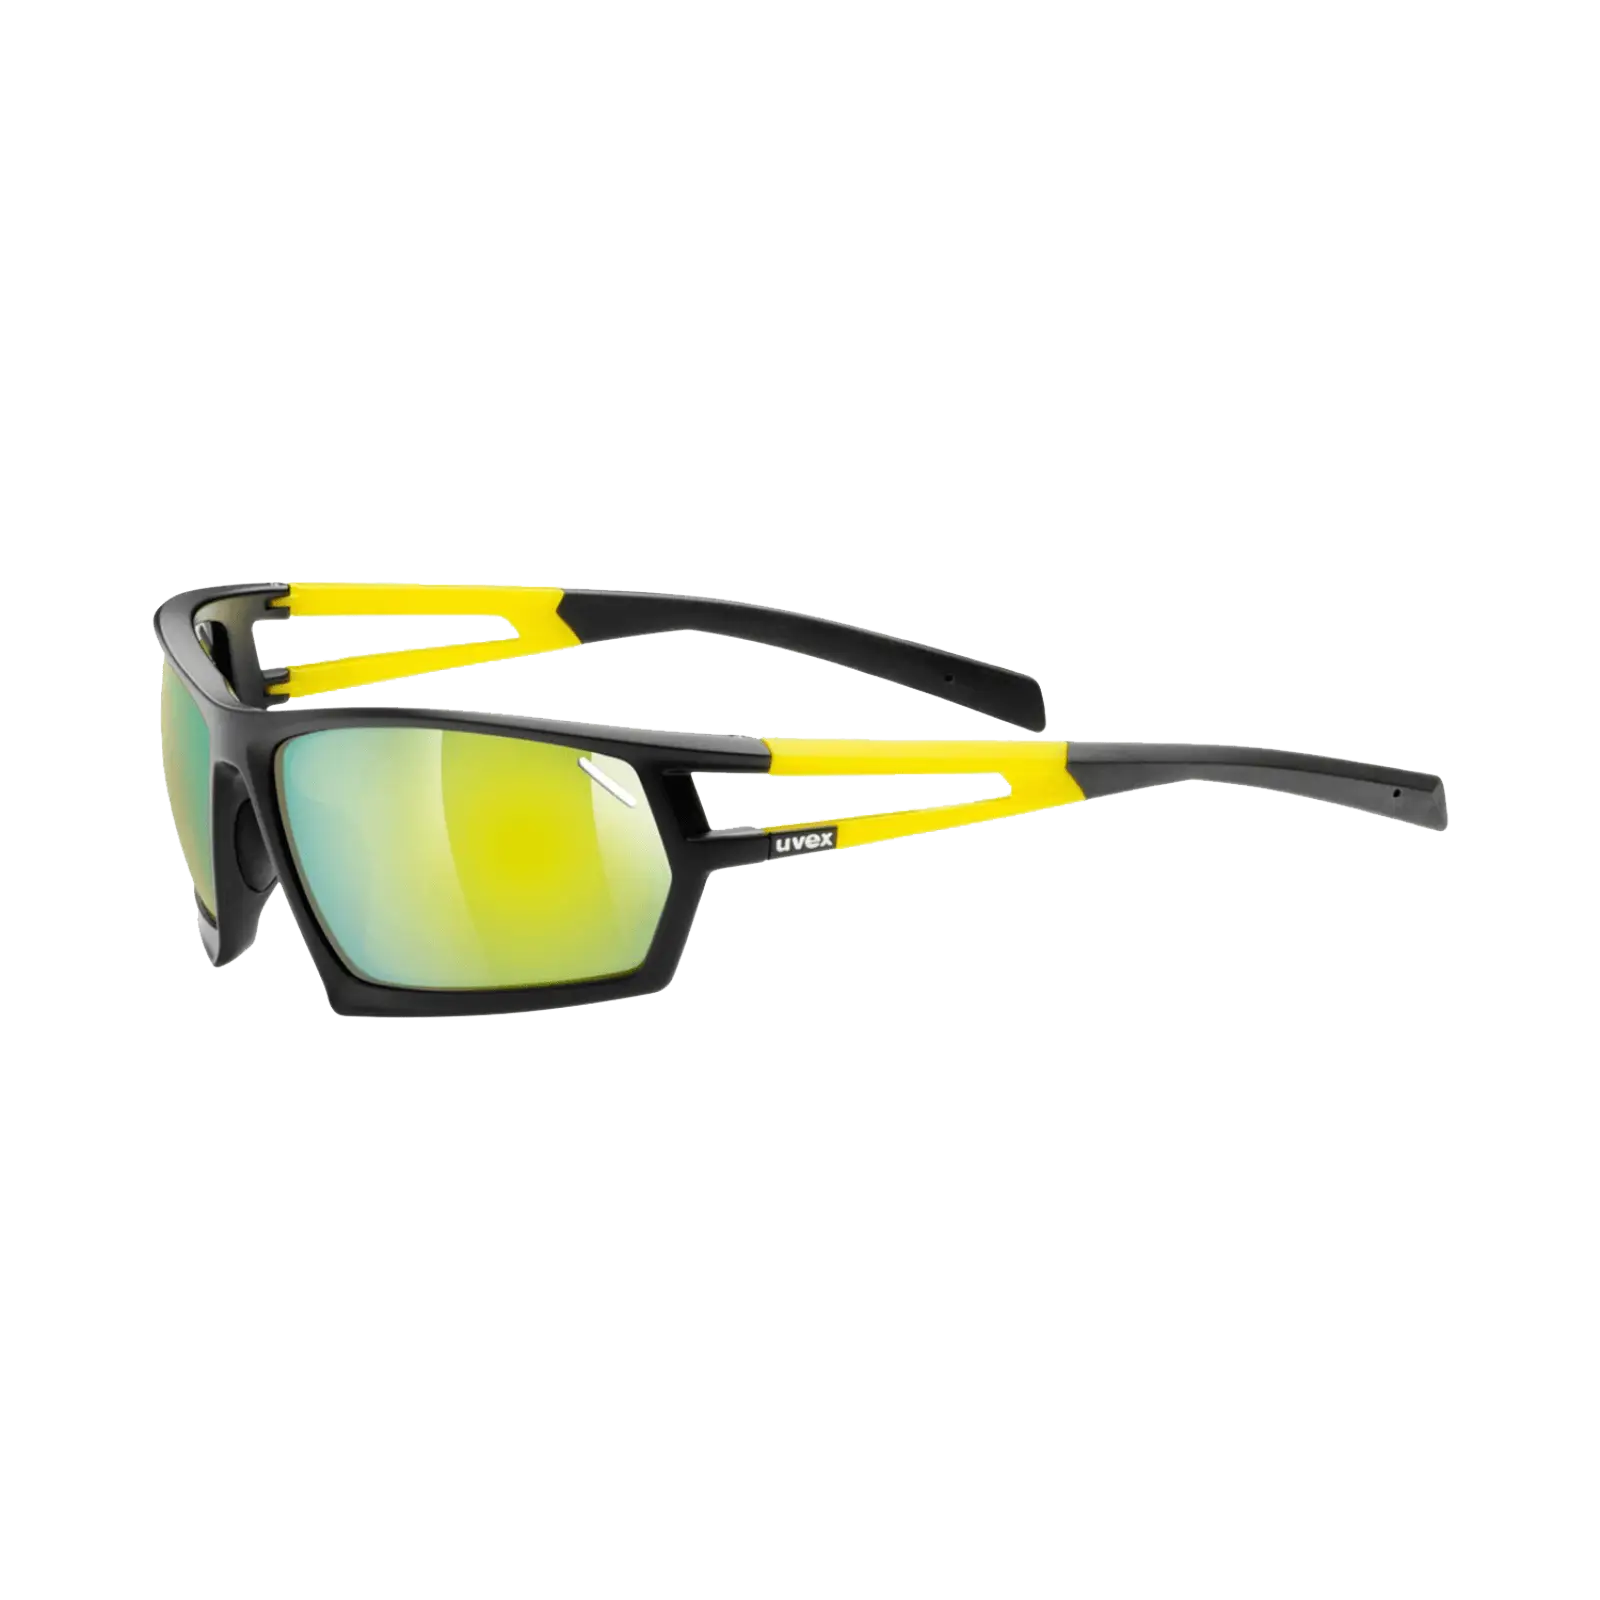
Yellow Reflective Sports Sunglasses -

Cartoon Elephant Balancing on a Ball -
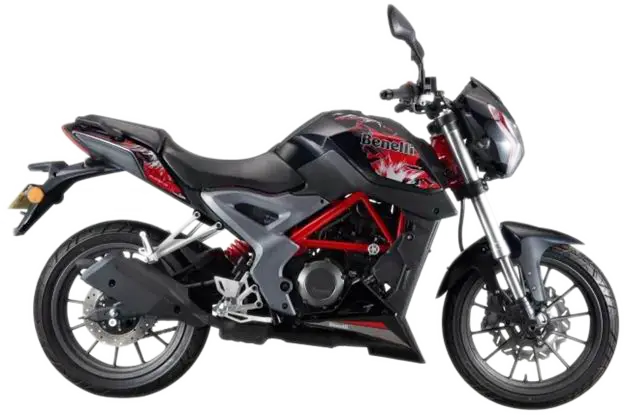
Sleek Sports Motorcycle in Black and Red -

Second Place Silver Medal with Laurel Wreath -

Black Checkmark Confirmation Symbol -

Icon of KPI Dashboard with Graph and Person -
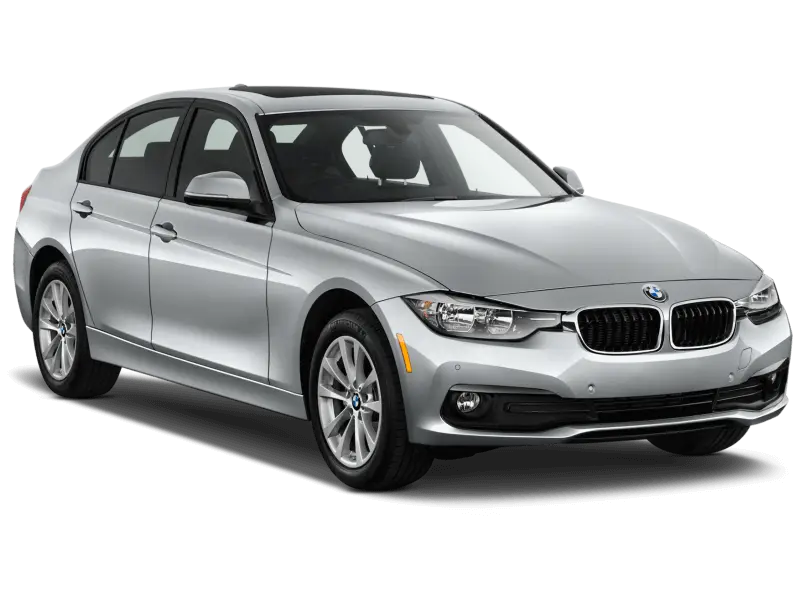
Stylish Silver Sedan Car for Urban and Family Use -

Thumbs Up Gesture -
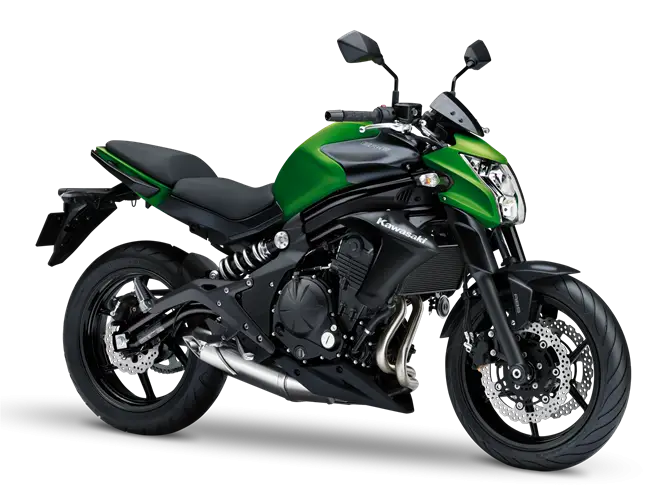
Green and Black Urban Motorcycle for Daily Commutes -
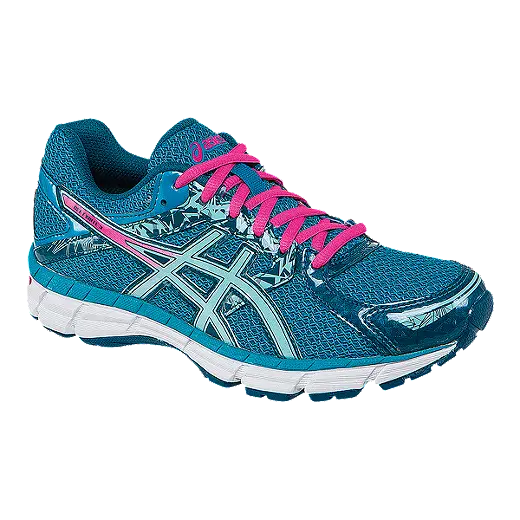
Blue Athletic Running Shoe with Pink Laces -

Presentation Board with Graph for Business Concepts -
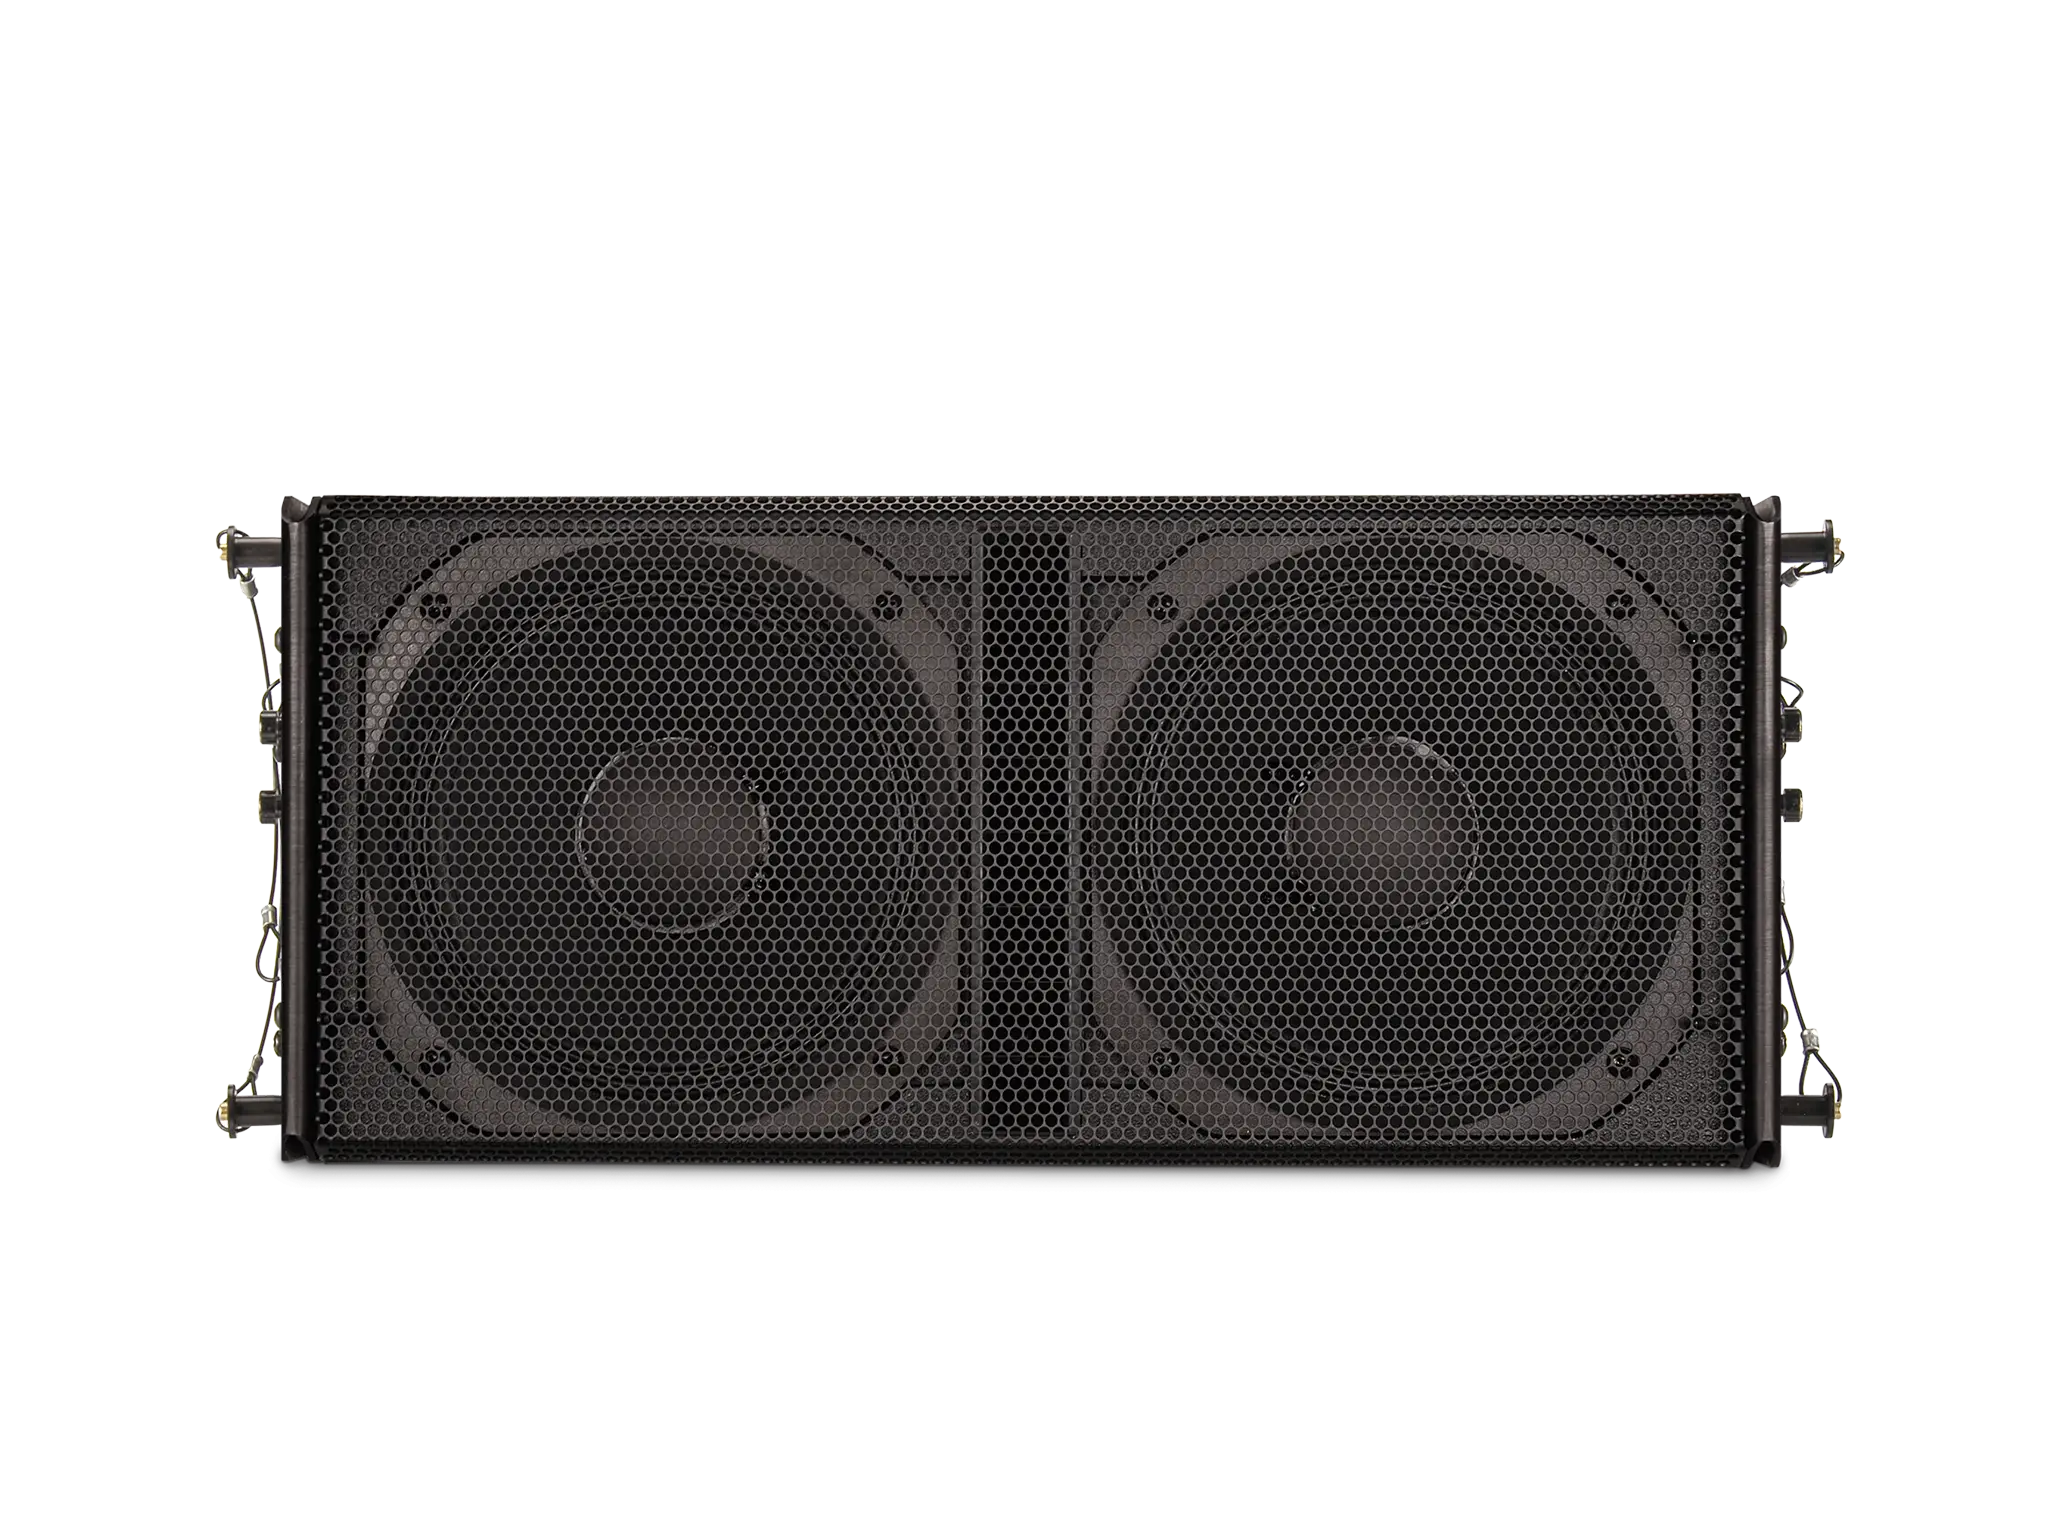
Black Speaker -
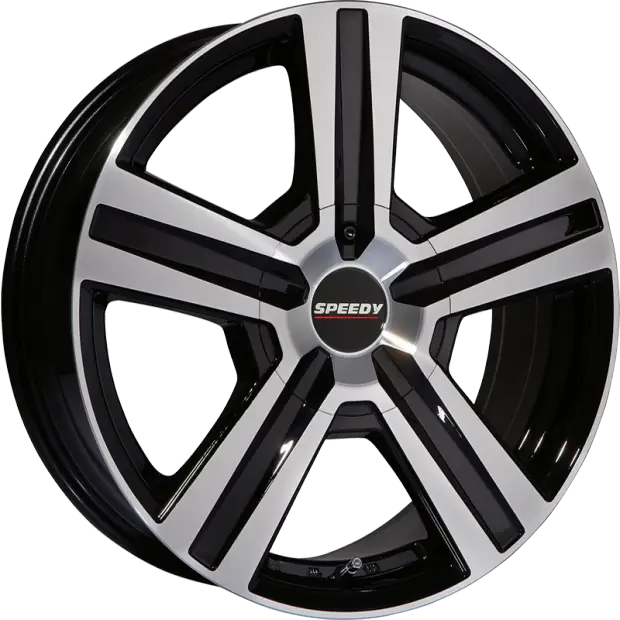
Speedy Black and Silver Car Wheel -

Graduation Cap on Stack of Books -
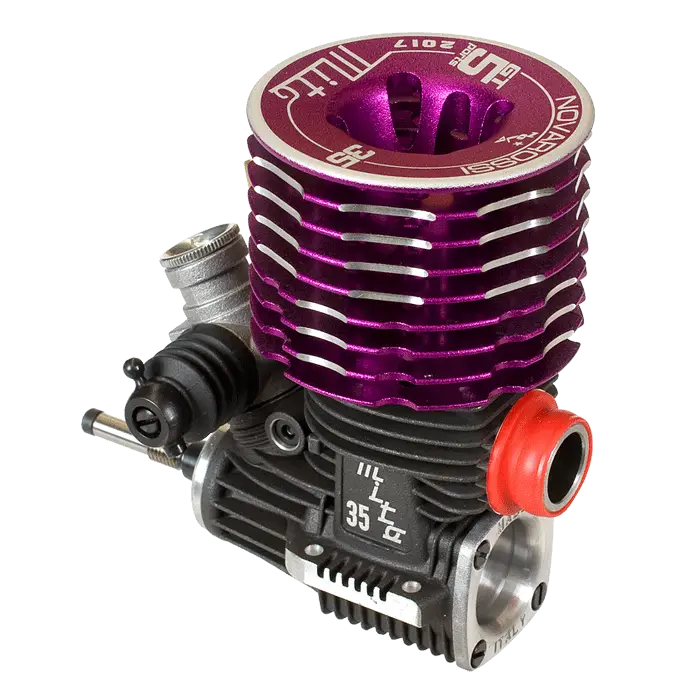
High-Performance Mini Engine Design -

Graduation Cap Symbol for Education -

Group of Professional Businesspeople in Formal Attire -
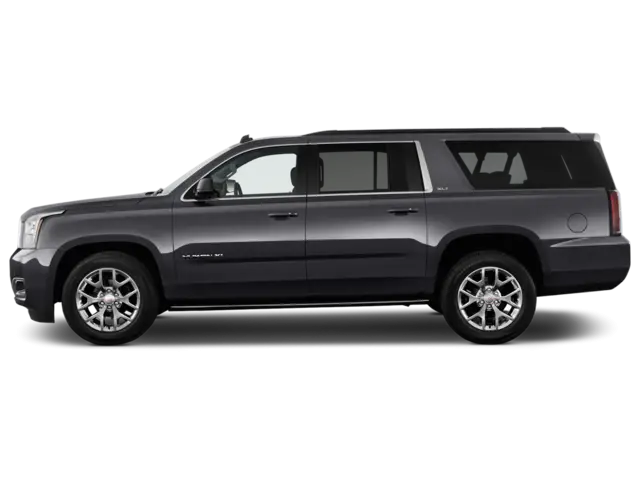
Black SUV Car for Off-Road and Urban Travel -
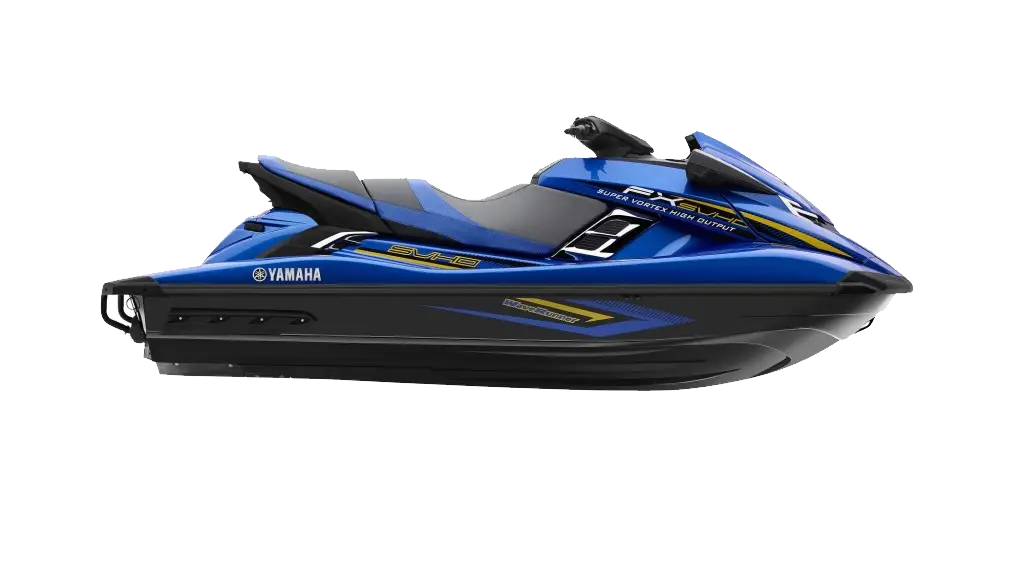
Blue Jet Ski for Water Sports