You Might Like
-

Checkmark Symbol Inside a Circle -

Man Holding Completed Checklist Illustration -

Team with Growth Graph Illustration -

Businessmen Climbing Stairs -
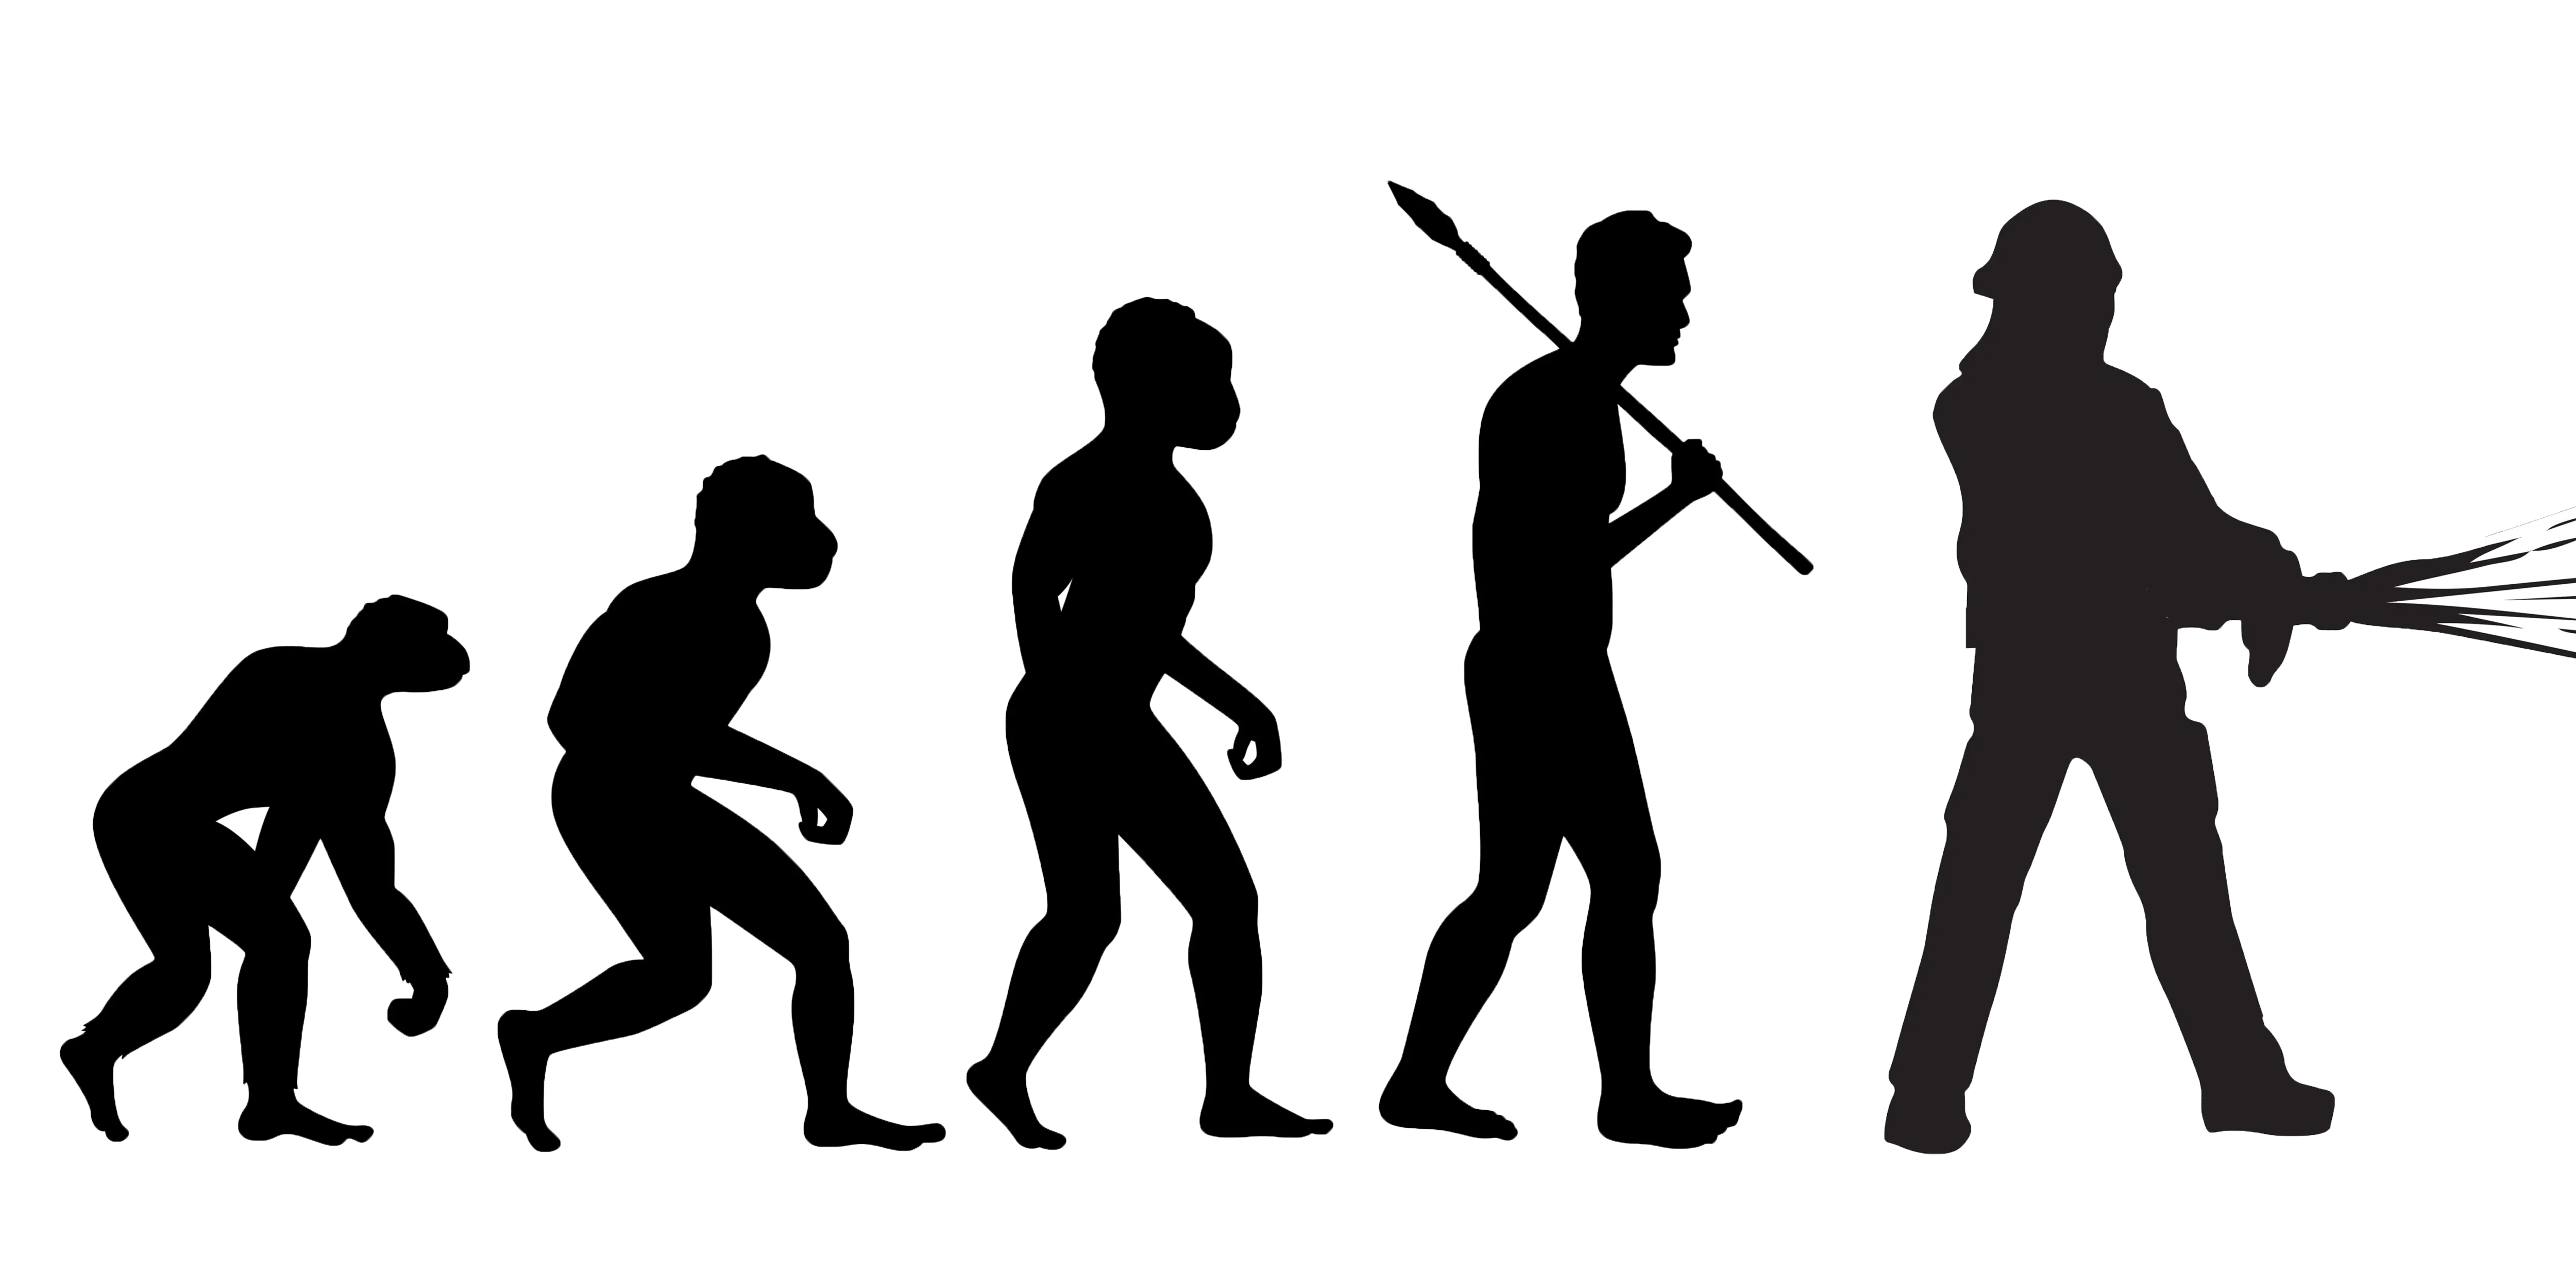
Evolution of Humanity Illustration -

Simple Checklist Icon -

Presentation Board with Graph for Business Concepts -

Bar Chart with Upward Arrow -

Infographic Pencil with Data Elements -

Illustration of Growth Chart with Upward Arrow -

Curved Black Upward Arrow -
Work in Progress Sign -
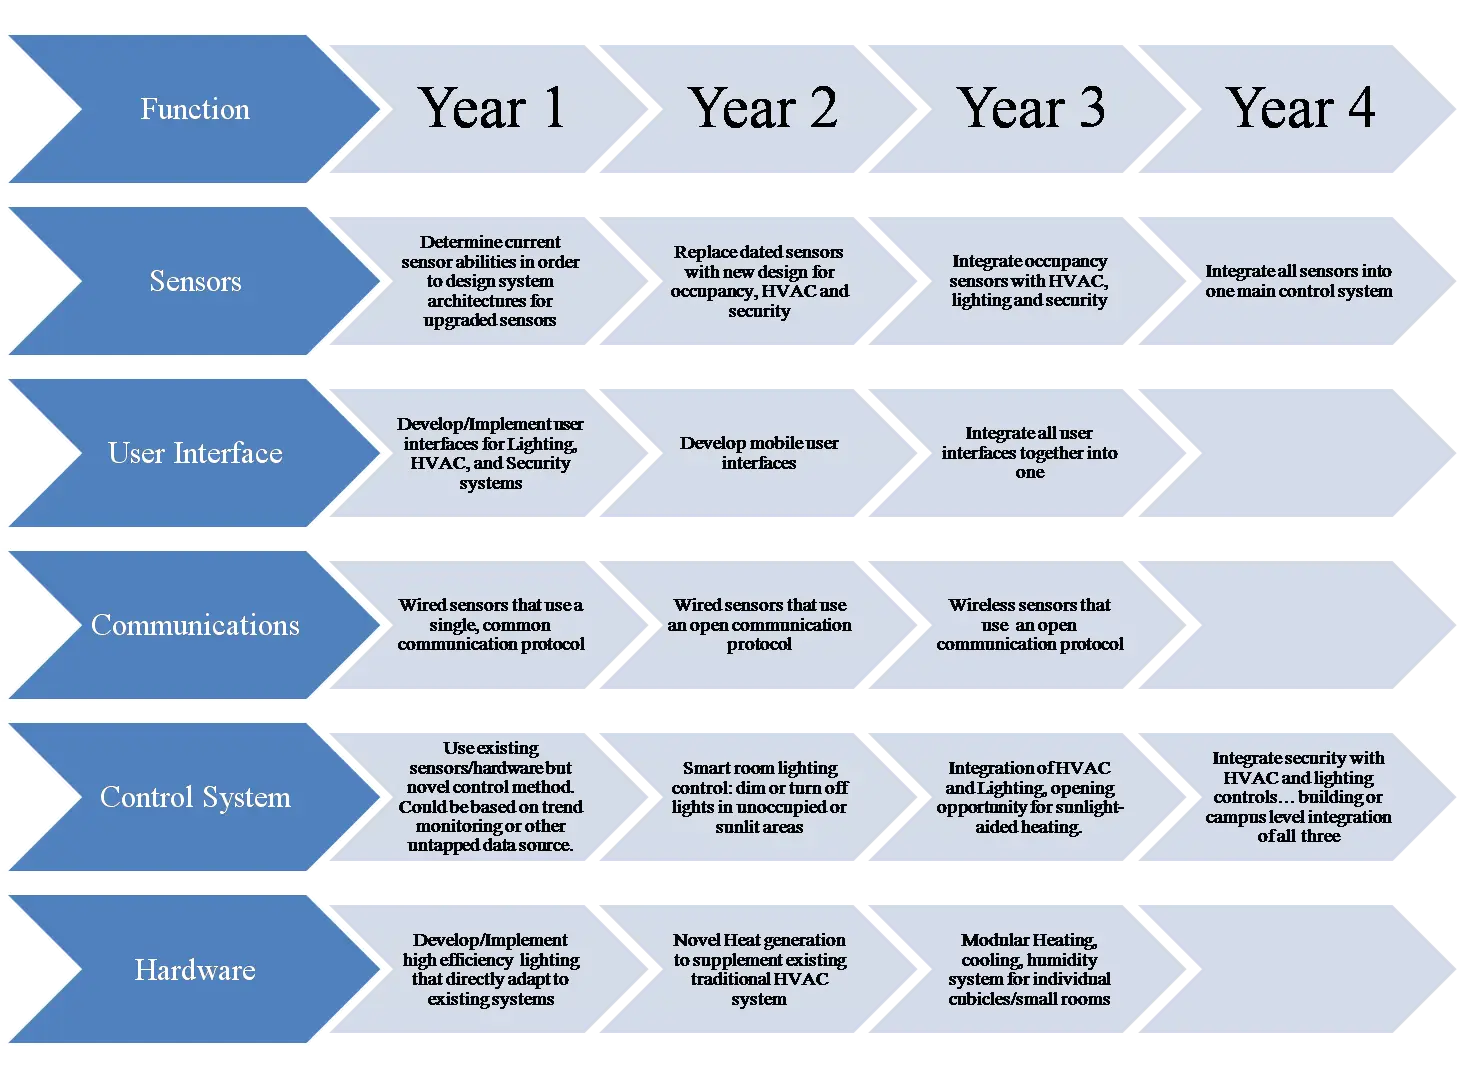
Development Roadmap for Project Planning -

Directional Signboard with Colorful Arrows -

Right Direction Arrow Symbol -

Teamwork with Gears -

Blue Loading Symbol with Circular Dots -

Teamwork and Gear Collaboration Illustration -

Colorful Silhouettes of Runners -

Yellow Clipboard with Checklist Icon -

Running Towards 2025 -

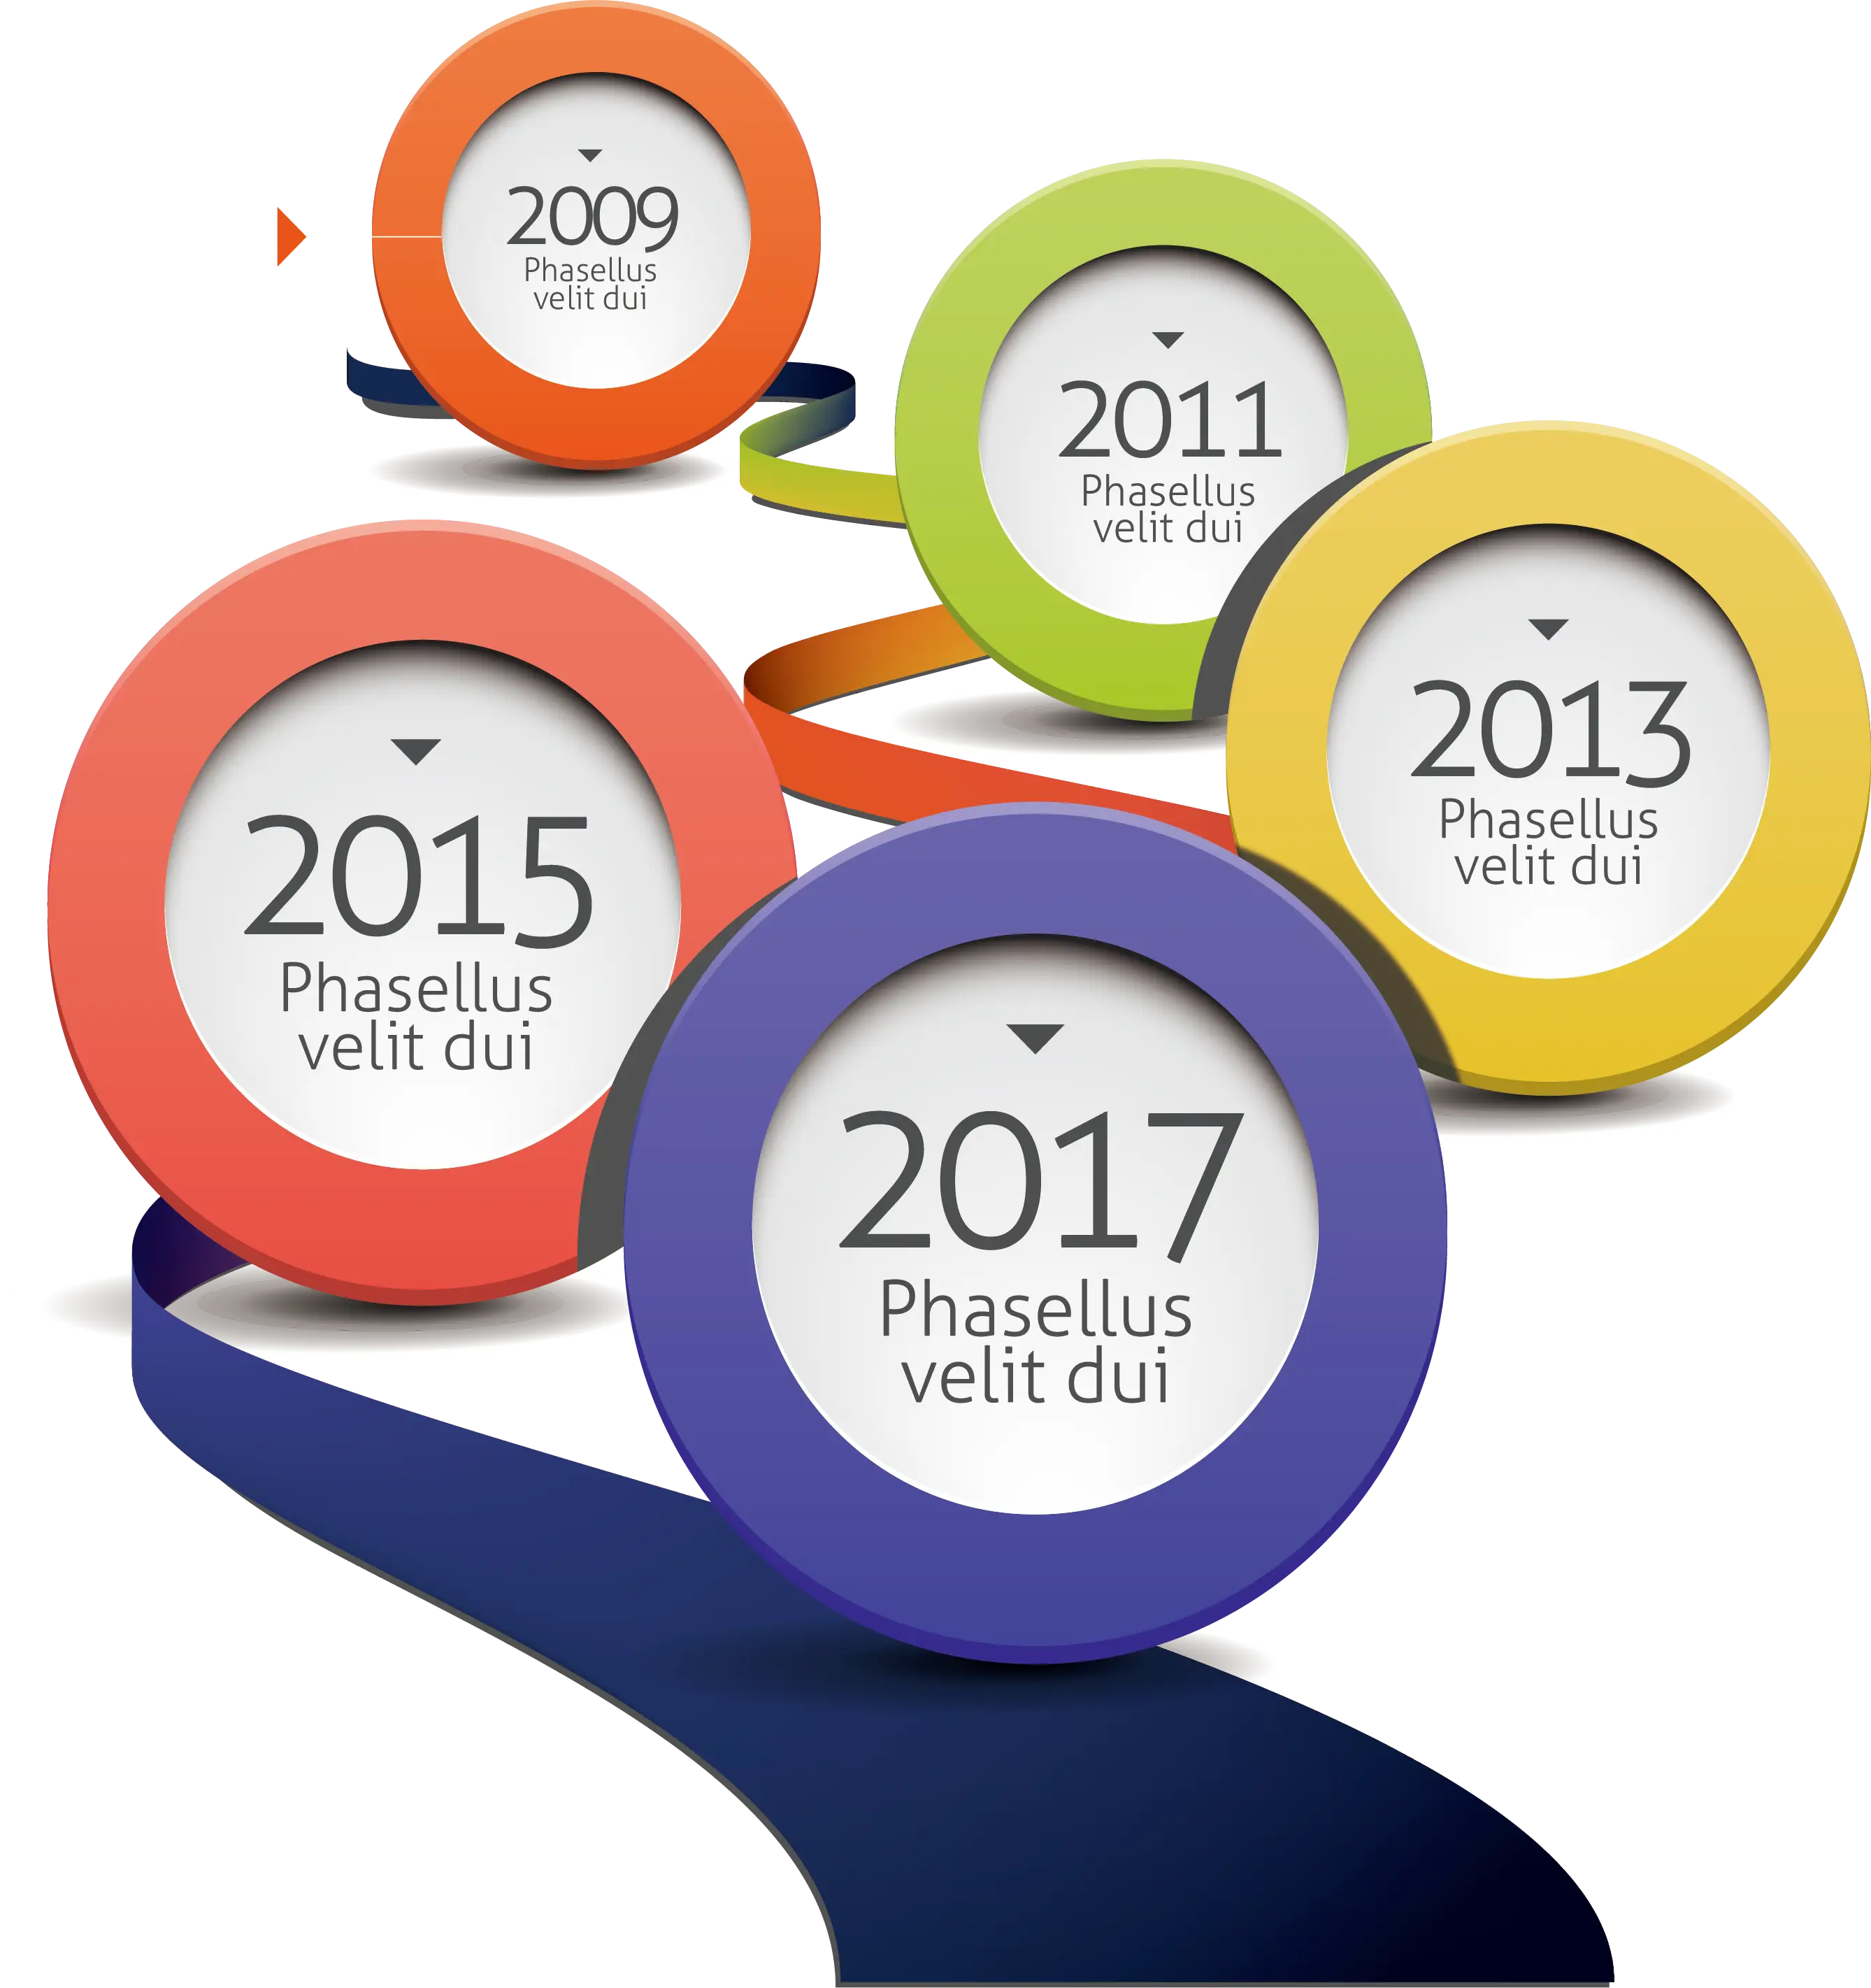
Timeline Infographic Design -

Clipboard with Checklist for Task Organization -

Upward Arrow on Graph -

Blue Checklist Clipboard Icon -

People Icon with Growth Arrow -
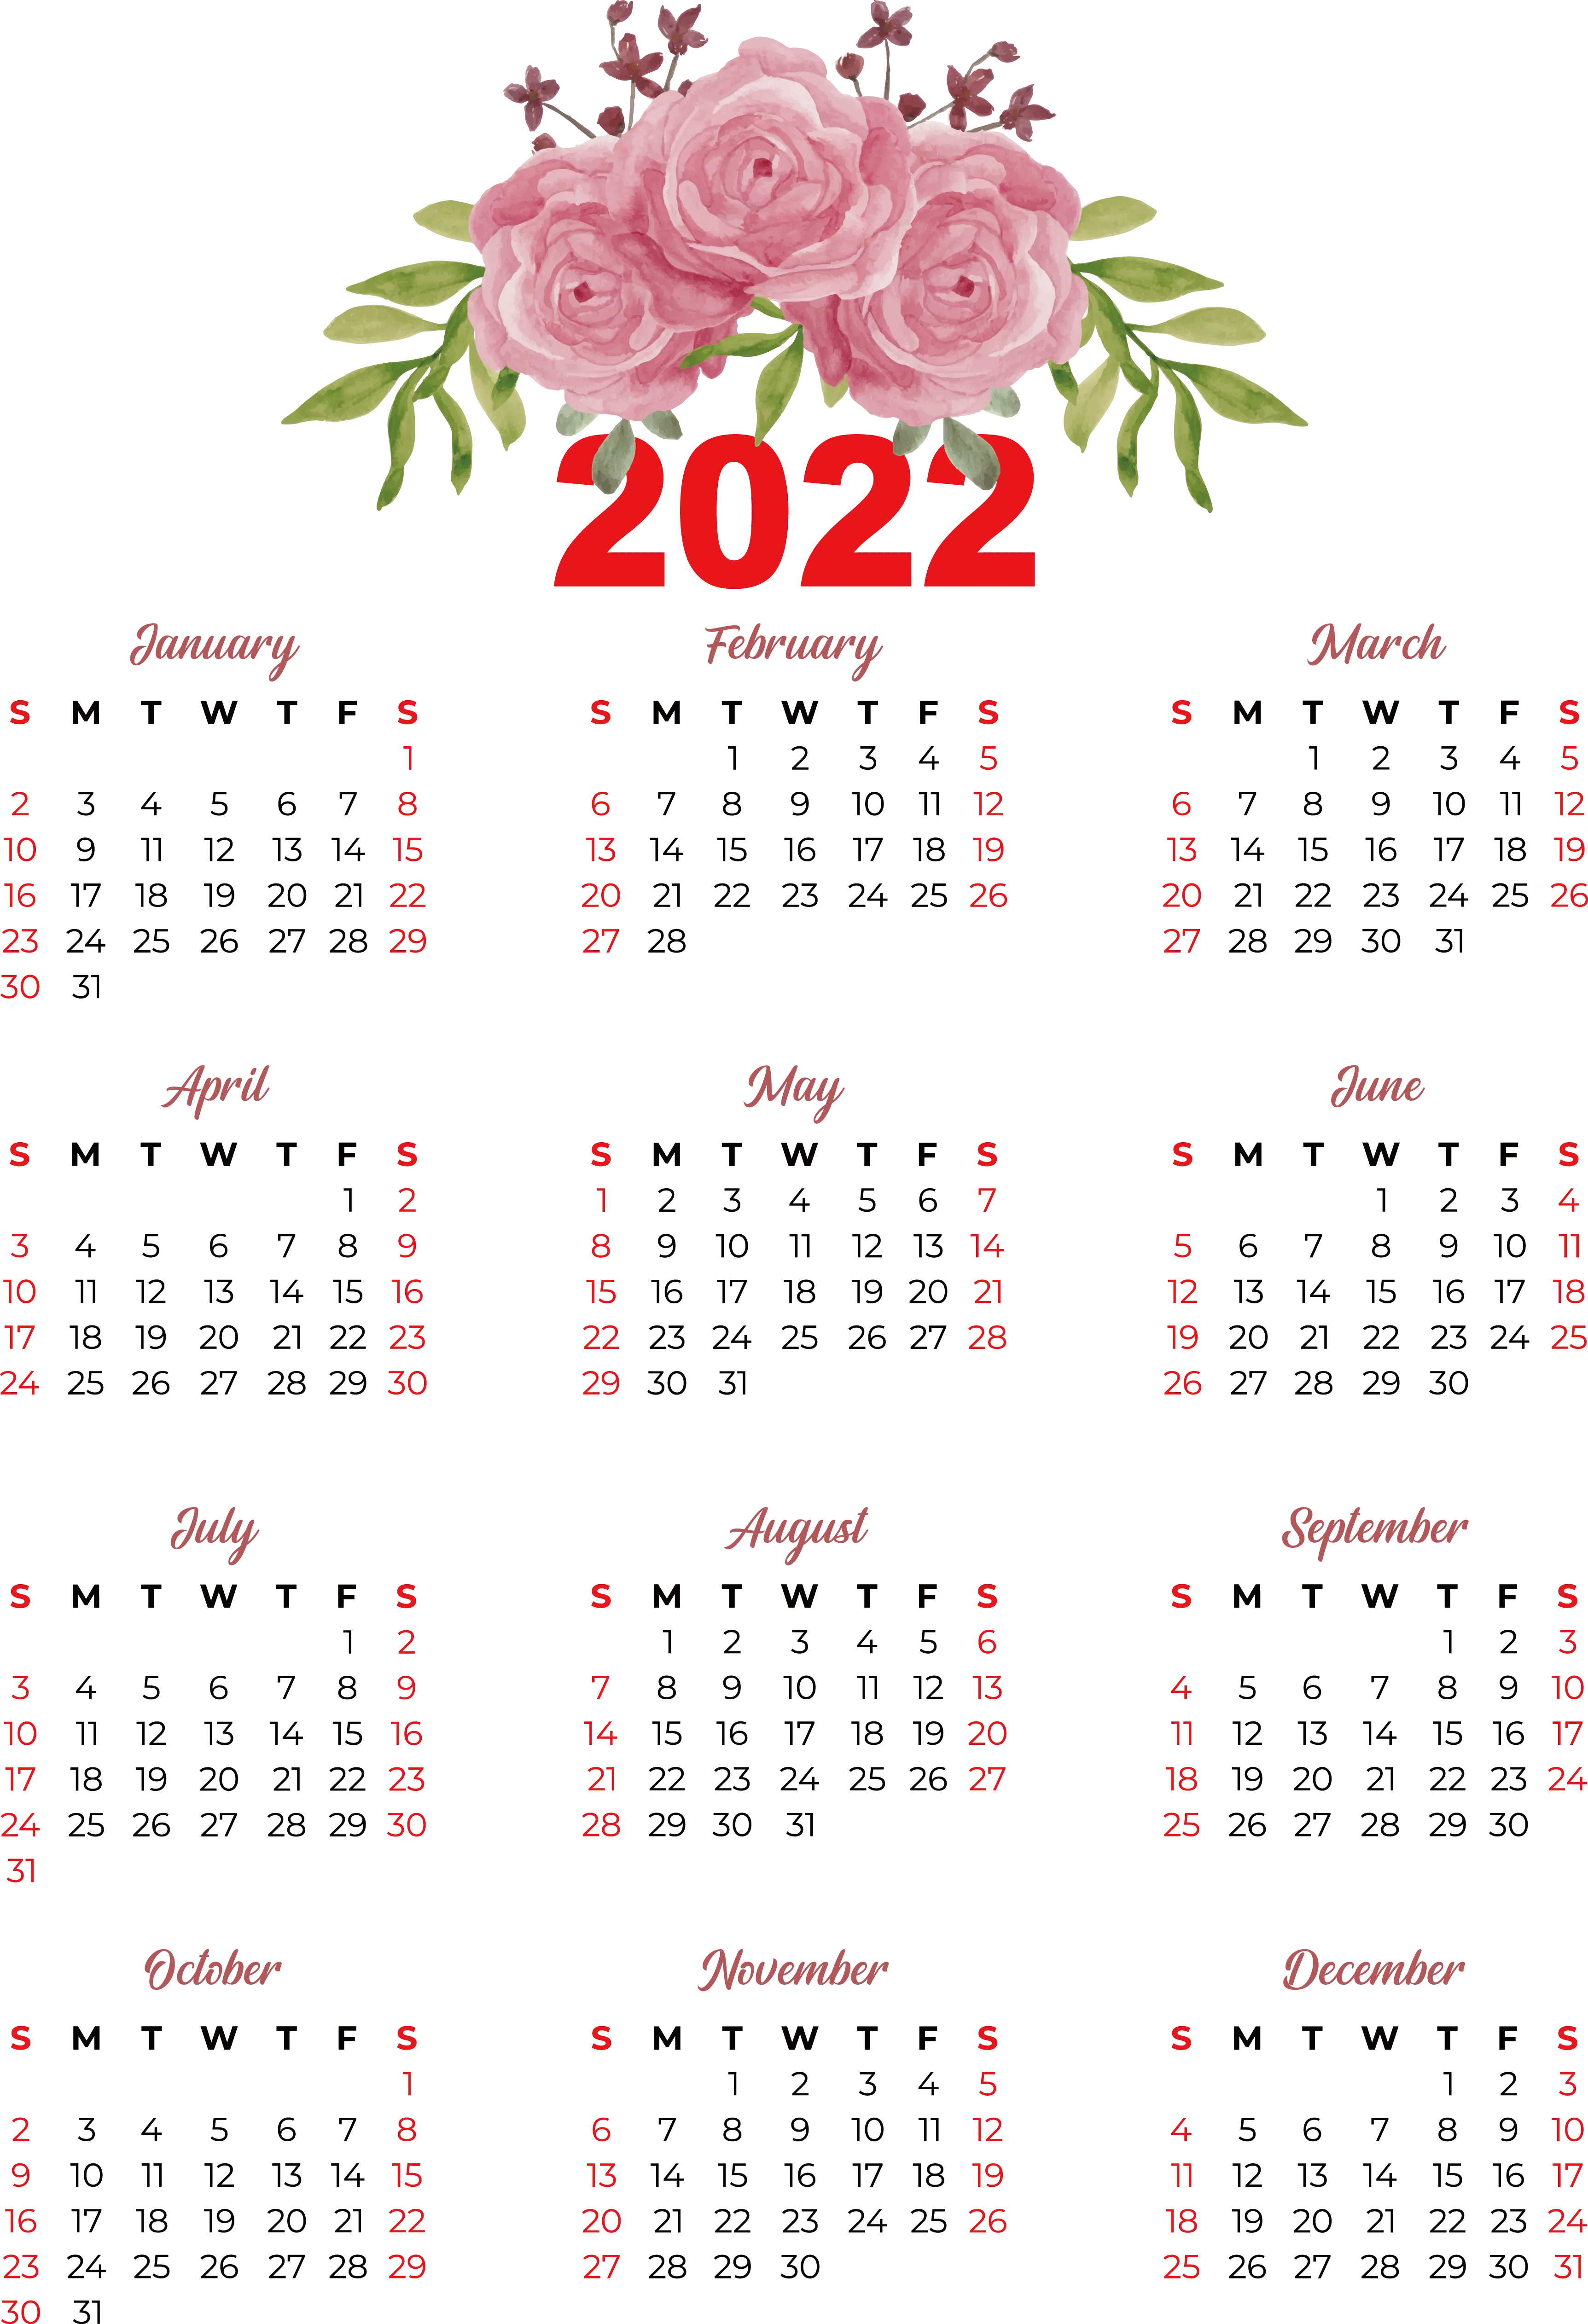
2022 Pink Rose Yearly Calendar Design -

Blue, Green, and Red Right Arrows -

Rocket-Shaped Light Bulb for Innovation -

Target Symbol with Arrow