
You Might Like
-

Colored Regional Map of Africa -

LinkedIn Professional Networking Platform Logo -

Hand Holding Plant with Energy Symbol -

Colorful Stack of Books with Decorative Leaves -

Modern Office Conference Phone System -

Team with Growth Graph Illustration -

Business Strategy Icons -

Organizational Structure Chart -

Various Devices Displaying Software -

Open Signboard Icon for Business Representation -

Complete Blue World Map -
Professional Tan Leather Briefcase -

Sun and Hands Symbol -

Icon of KPI Dashboard with Graph and Person -

Thumbs Up Gesture -

Zigzag Down Arrow Icon for Decline Representation -

Presentation Board with Graph for Business Concepts -

Businesswoman in Professional Suit -
Group of People with Upward Arrows -

Yellow Ethernet Cable for Network Connections -

Bar Chart with Upward Arrow -

Infographic Pencil with Data Elements -

Man in Black Suit -

Group of Professional Businesspeople in Formal Attire -
Colorful Bookshelf -
Color Wheel for Artistic Inspiration -

Customer Service Representative Wearing Headset -

Search Growth Icon -

Illustration of Growth Chart with Upward Arrow -
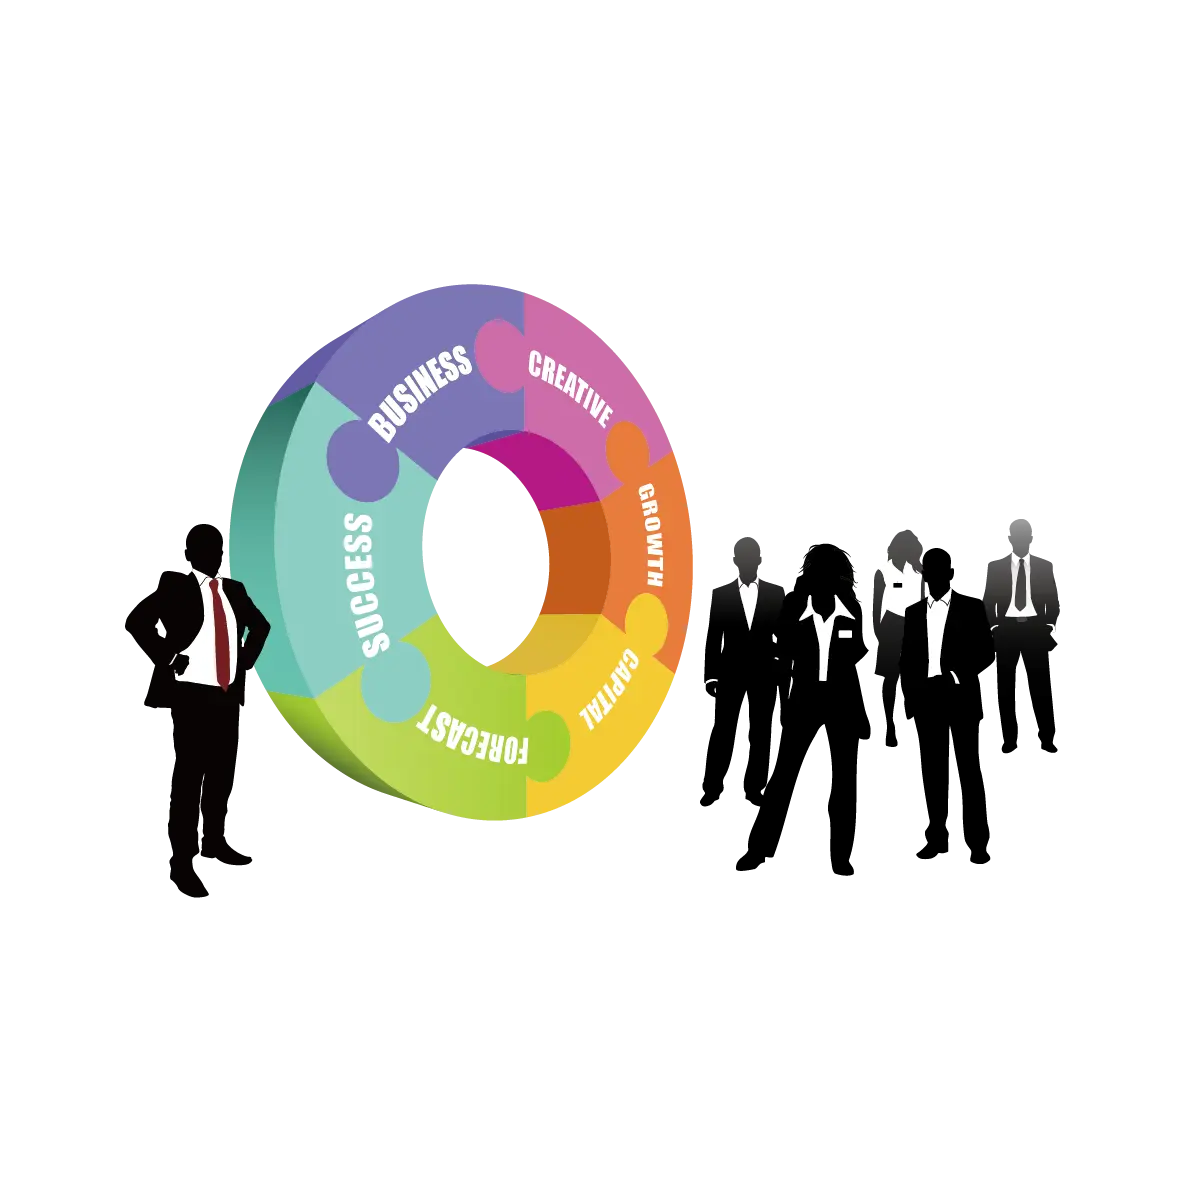
Business People with Circular Chart