Free Statistics Cliparts and Illustrations
Free 117 statistics cliparts & illustrations for your personalized works, such as colorful pie chart for data visualization, population and average annual growth rate chart, grey pie chart icon representing data, infographic pencil with data elements and many more.
-

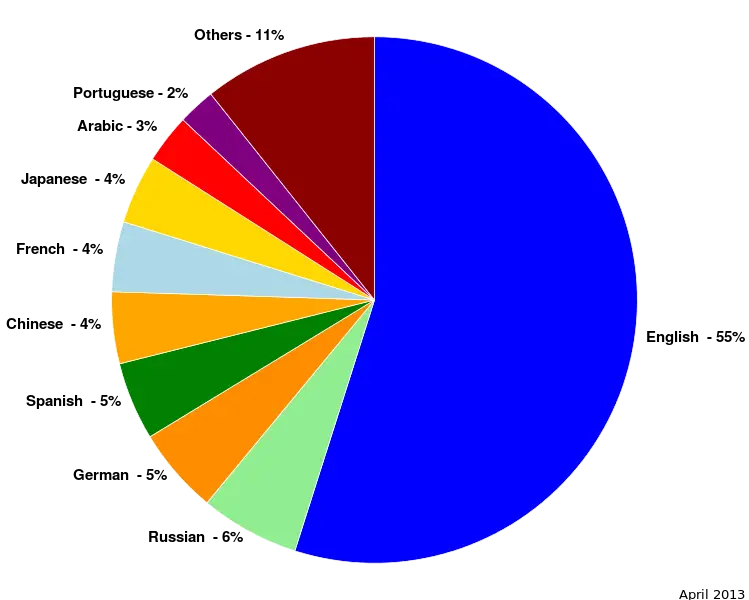
Colorful Pie Chart for Data Visualization -
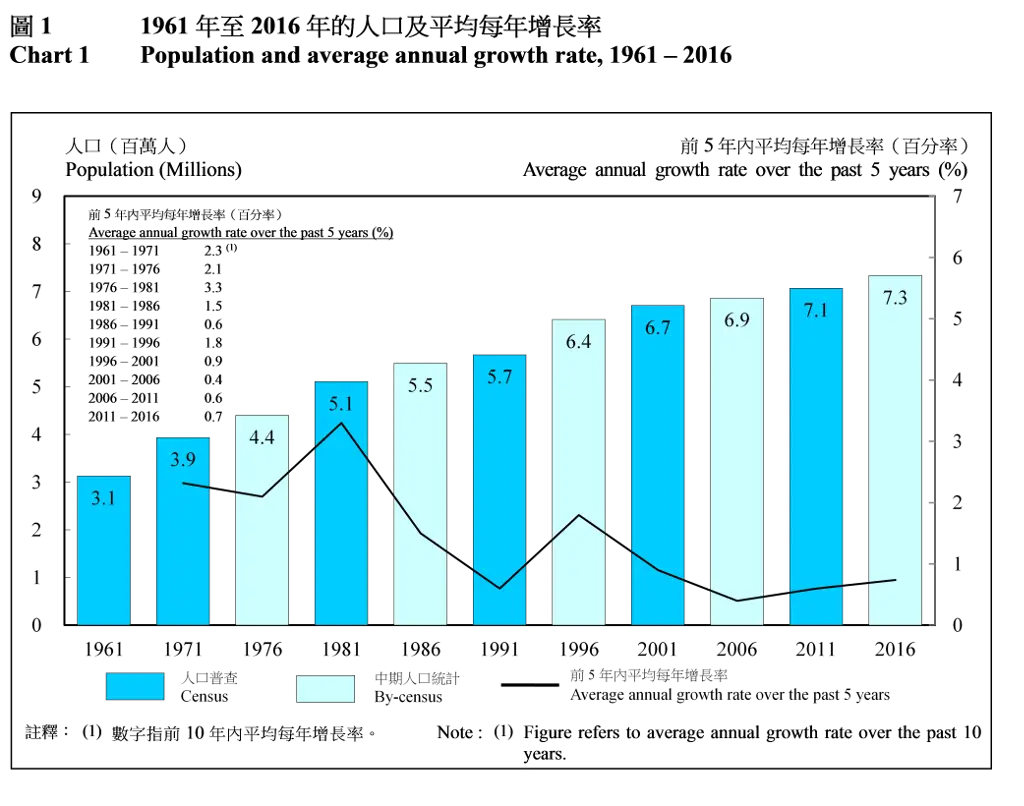
Population and Average Annual Growth Rate Chart -

Grey Pie Chart Icon Representing Data -

Infographic Pencil with Data Elements -
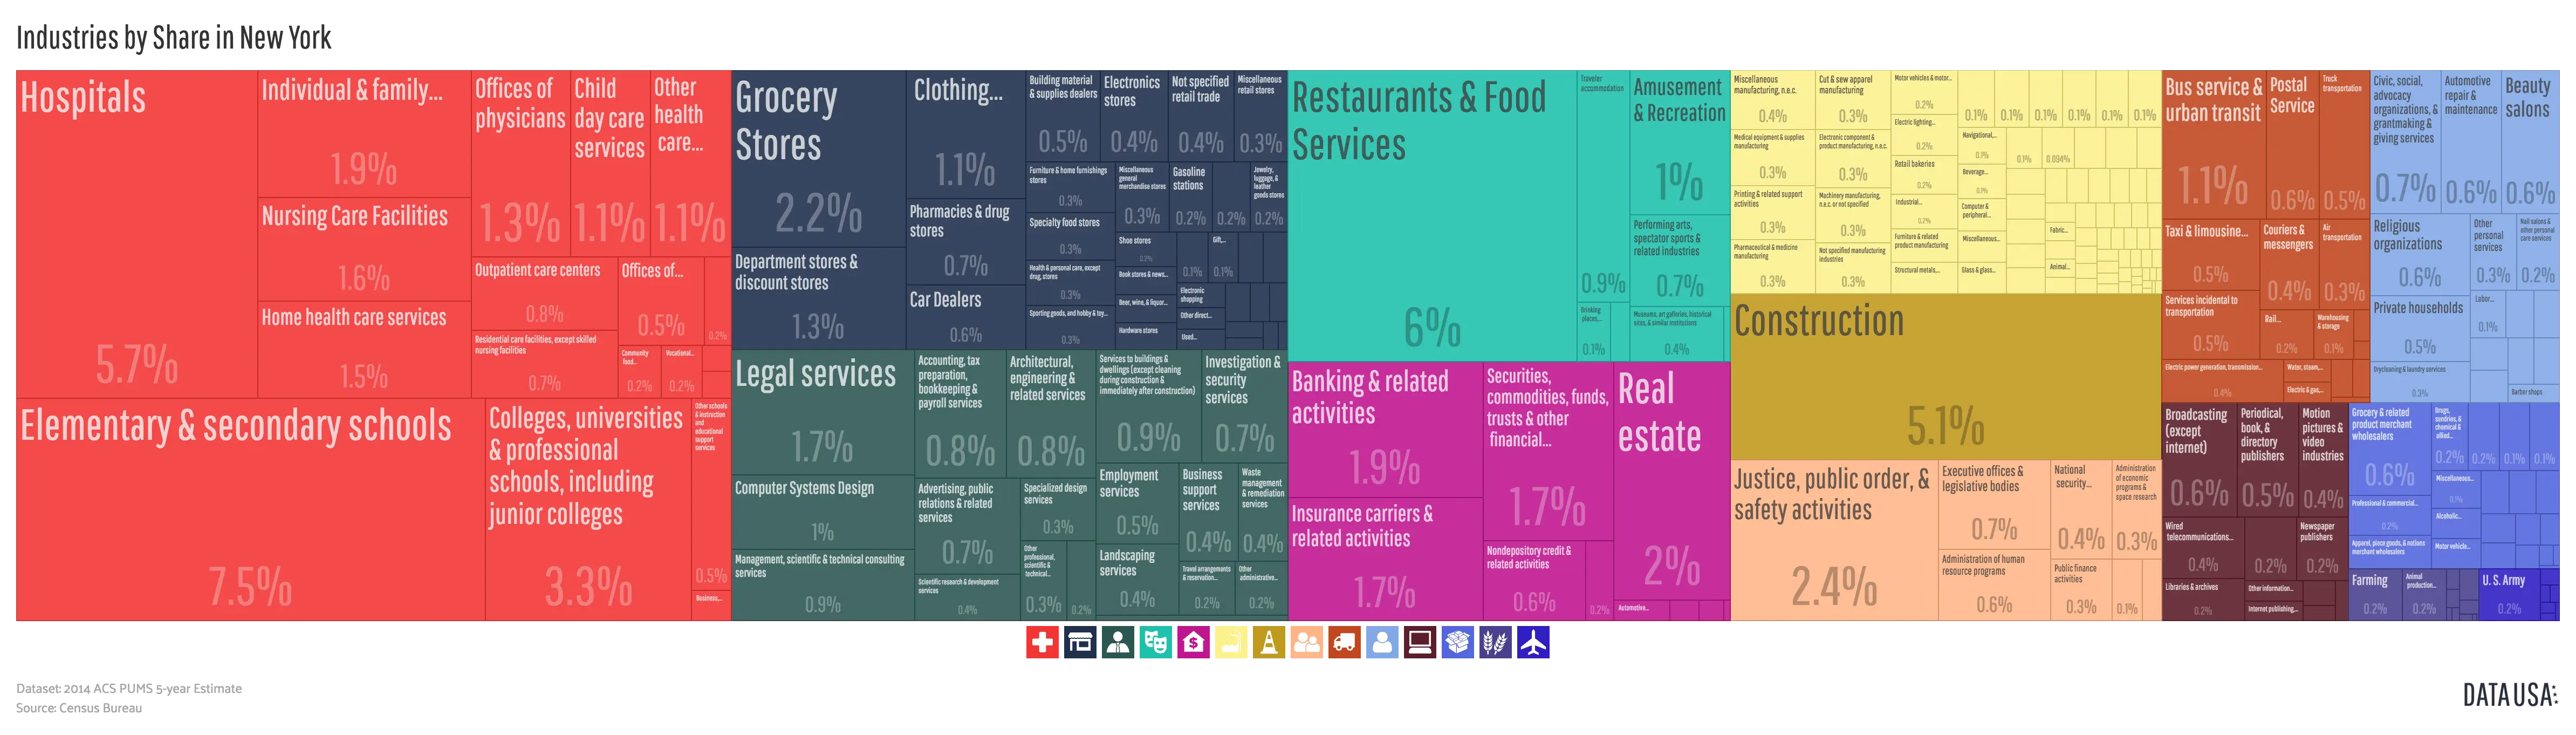
Colorful Infographic Data Visualization -

Data Analysis Infographic Design -

Tablet with Graphs and Data Analysis -
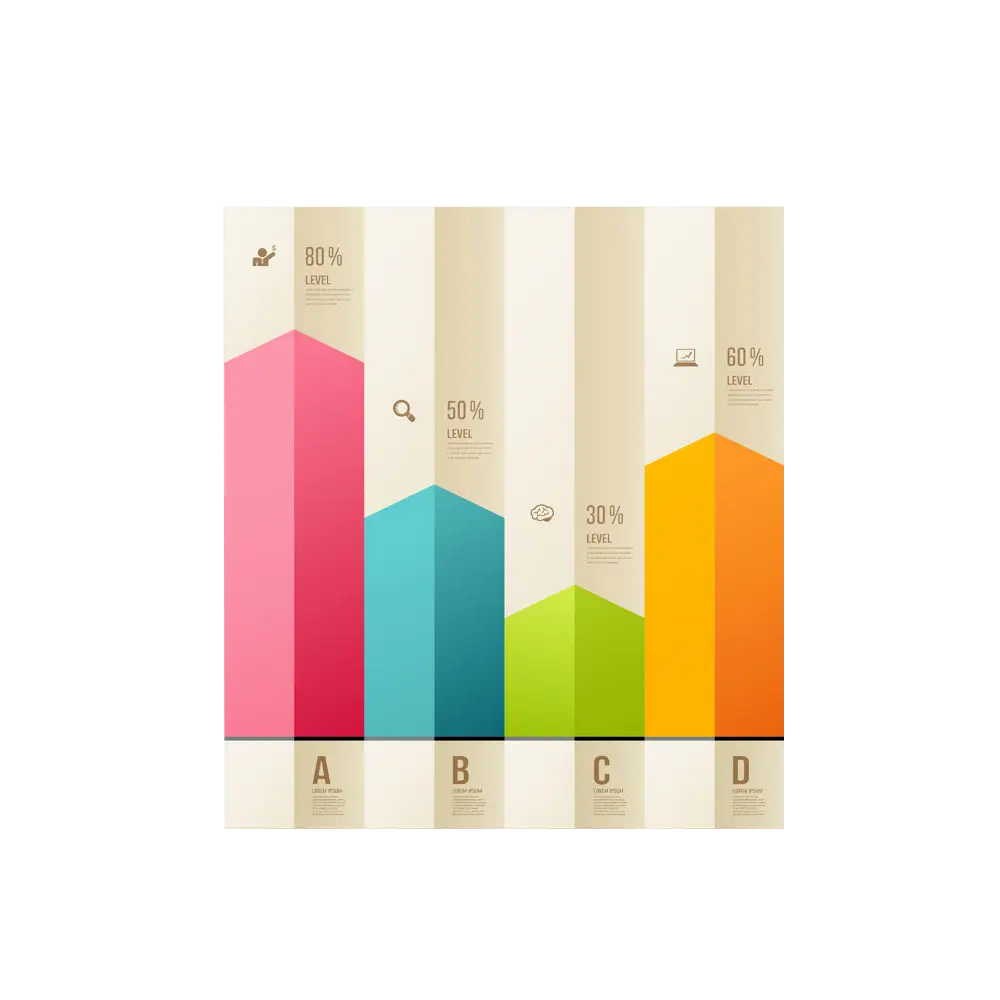
Colorful Bar Chart Infographic -

Colorful Infographic Chart -
Blue Pie Chart for Data Visualization -

Blue Declining Bar Graph with Arrow -

Circle Pie Chart Icon -

34,046 CPS Appointments Text -

Pie Chart Representation -
Colorful Statistical Pie Chart -

Calculator and Chart Icon for Data Analysis -

Line Graph for Data Visualization -
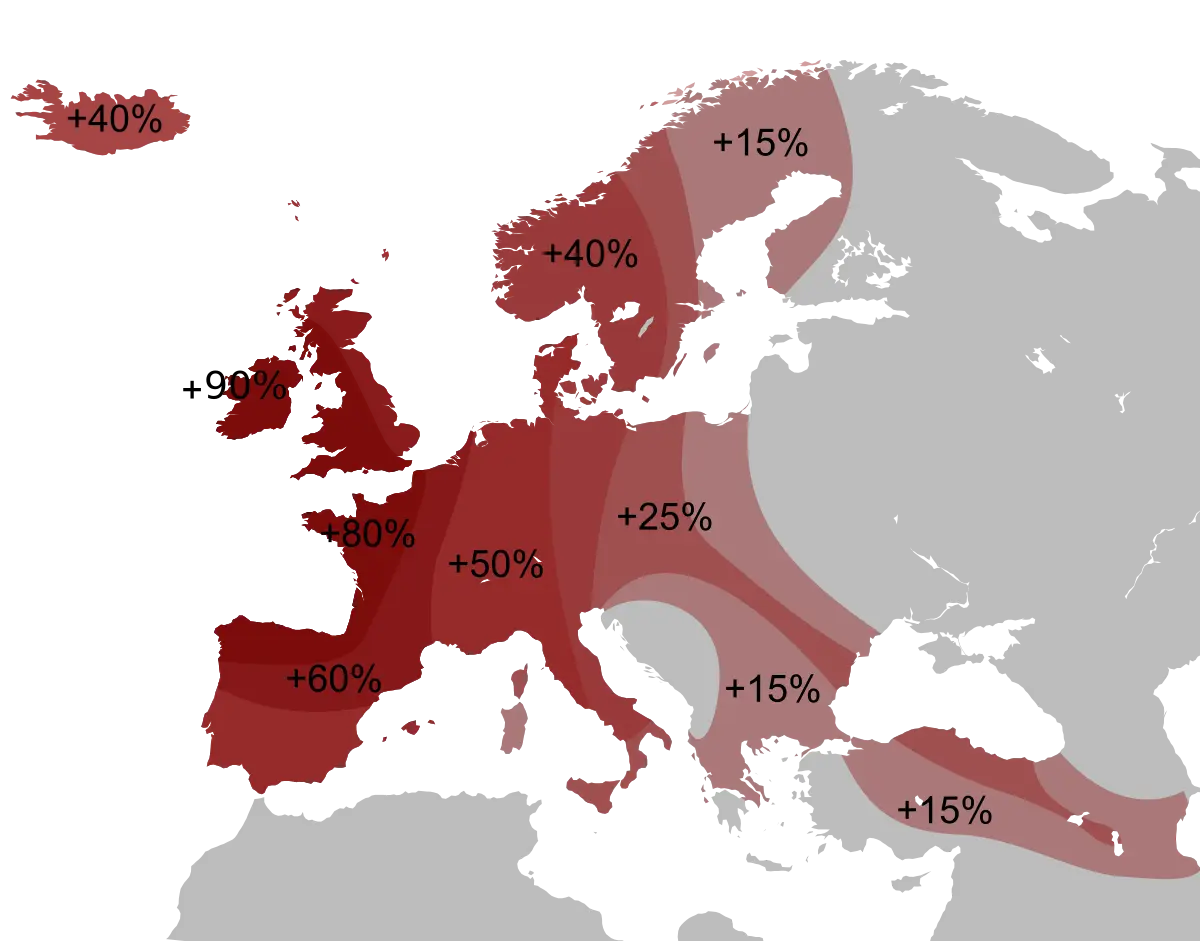
Percentage Map of Europe -

House Statistics Icon for Real Estate Analytics -

Blue Upward Arrow with Bar Chart Icon -

Data Analysis Document with Magnifying Glass -
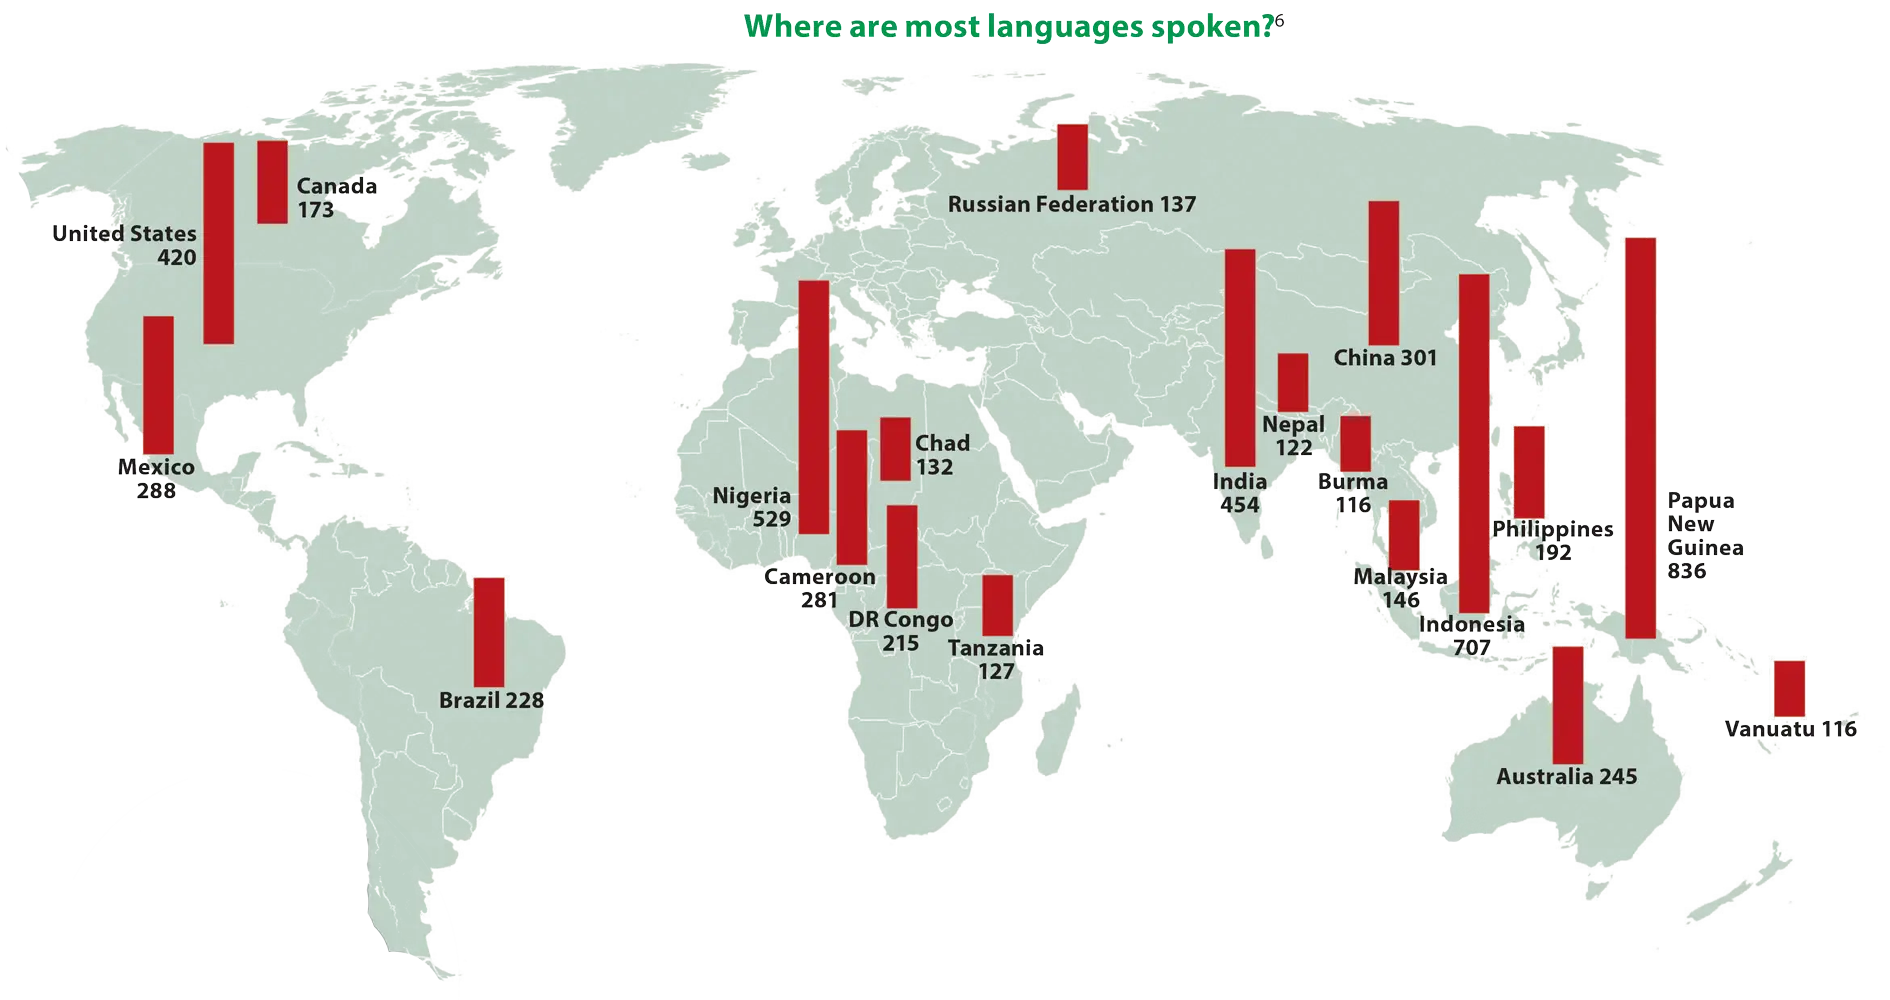
World Map Showing Language Distribution -

Data Analysis Bar Chart on Monitor -

Simple Blue Bar Graph Chart Illustration -
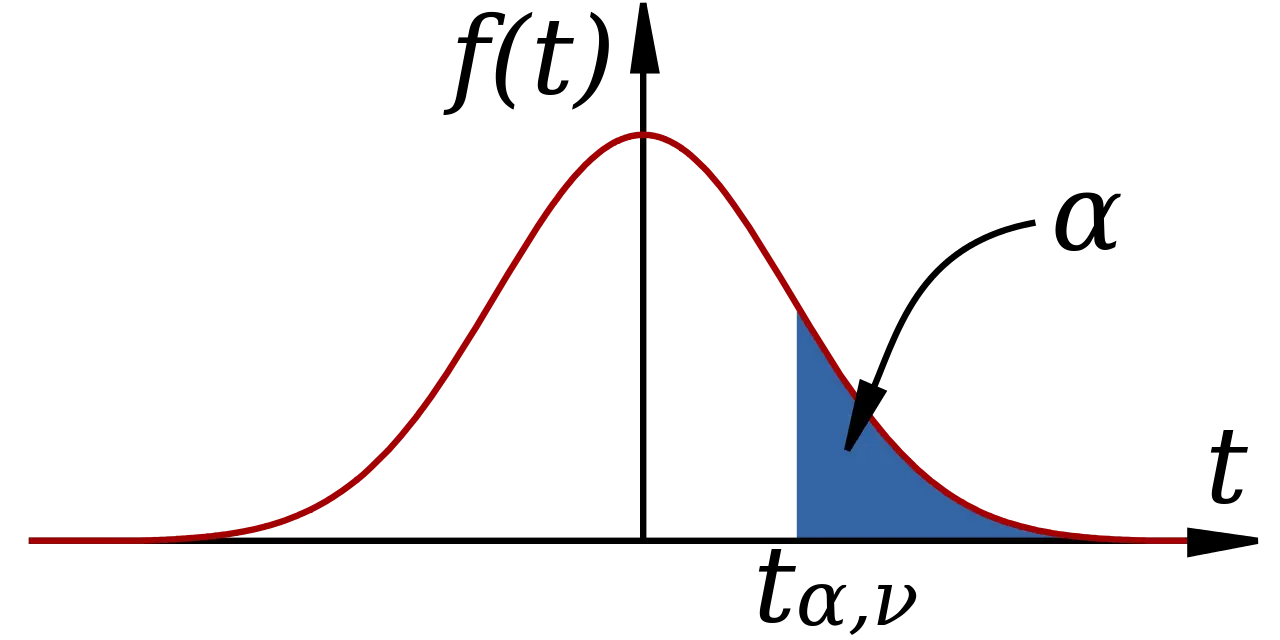
Mathematical Function Graph with Highlighted Area -

Simple Pie Chart -
Colorful Bar Graph for Data Analysis -
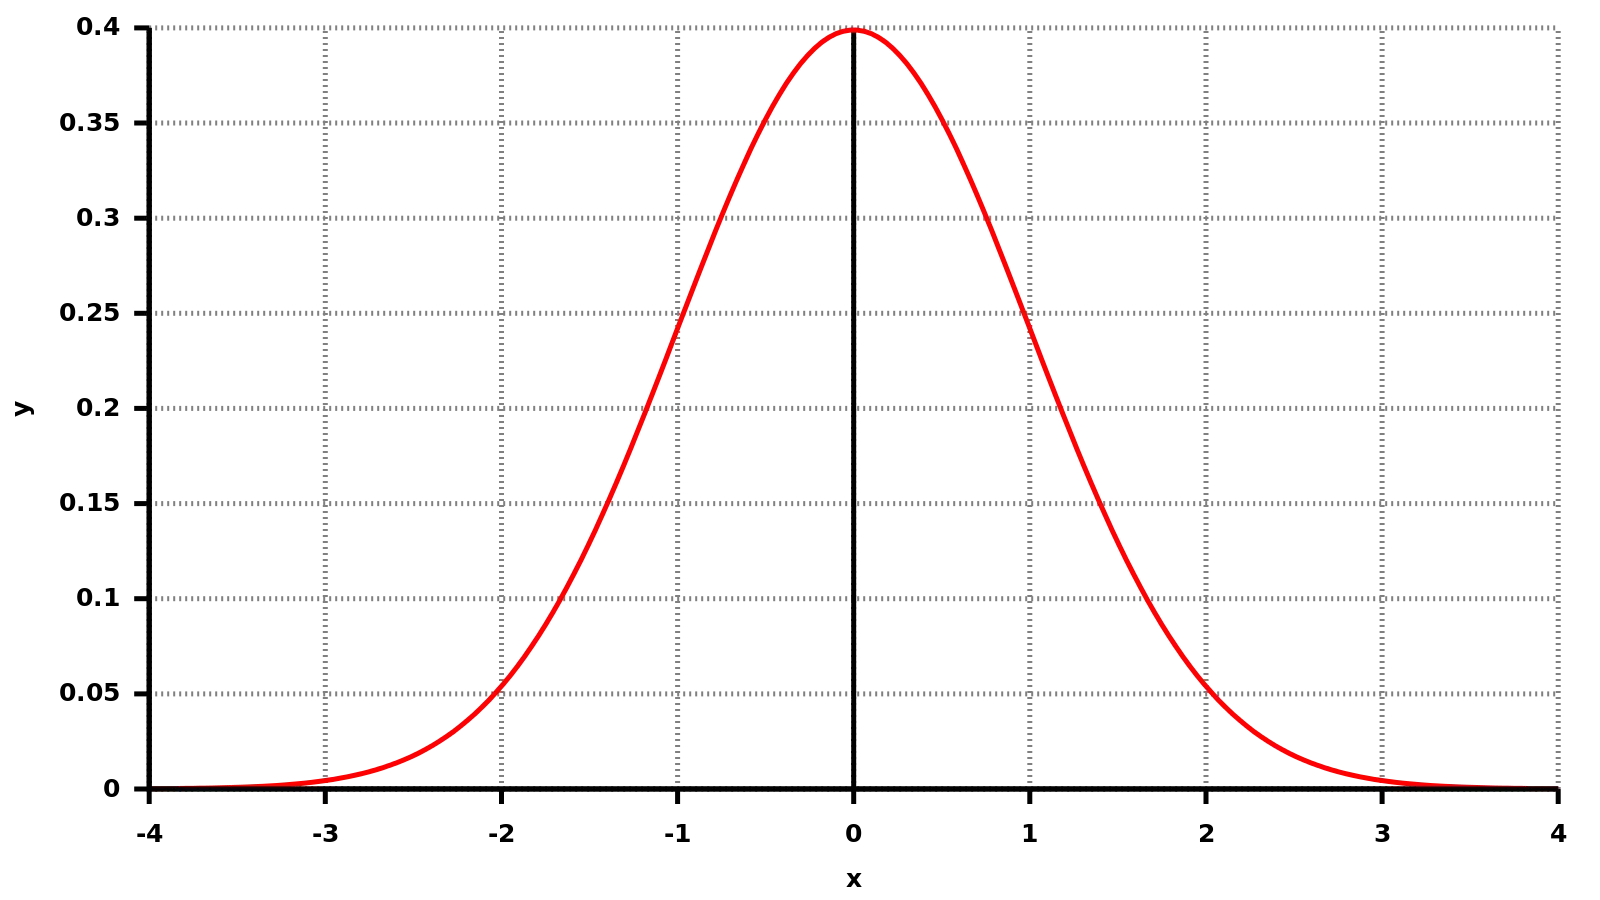
Bell Curve Graph for Statistics -
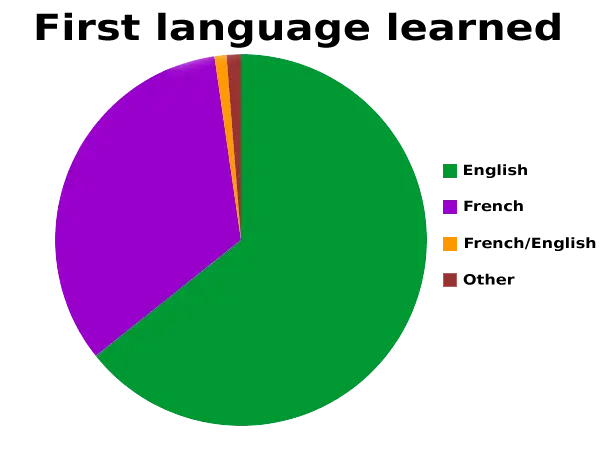
First Language Learned Pie Chart -

Green Downward Trend Graph Icon -

Data Analysis Icon with Magnifying Glass and Bar Graph -

Declining Bar Graph Icon -

Growth Chart Showing Increase in Statistics -

Data Graph Icon -

Line Graph with Data Points and Trends -

Bell Curve Graph for Probability Distribution -

Pink Bar Chart Icon for Data Analysis -

Paper Reports with Graphs and Charts -

3D Pie Chart with Bar Graph for Data Visualization -

Data Analysis Tools Illustration -

Population Pyramid Chart -

Digital Infographic -

Black Pie Chart Icon Illustration -

Venn Diagram of Data Science -

Combination Formula Equation -

Grey and Blue Pie Chart Illustration -

3D Bar Graph with Upward Arrow Indicating Growth -

Purple Bar Chart -

Document with Analytics Chart Icon -

Data Search Icon with Magnifying Glass