You Might Like
-

Hand Holding Plant with Energy Symbol -

Colorful Stack of Books with Decorative Leaves -

Team with Growth Graph Illustration -

Organizational Structure Chart -

Sun and Hands Symbol -

Icon of KPI Dashboard with Graph and Person -

Presentation Board with Graph for Business Concepts -
Group of People with Upward Arrows -

Yellow Ethernet Cable for Network Connections -

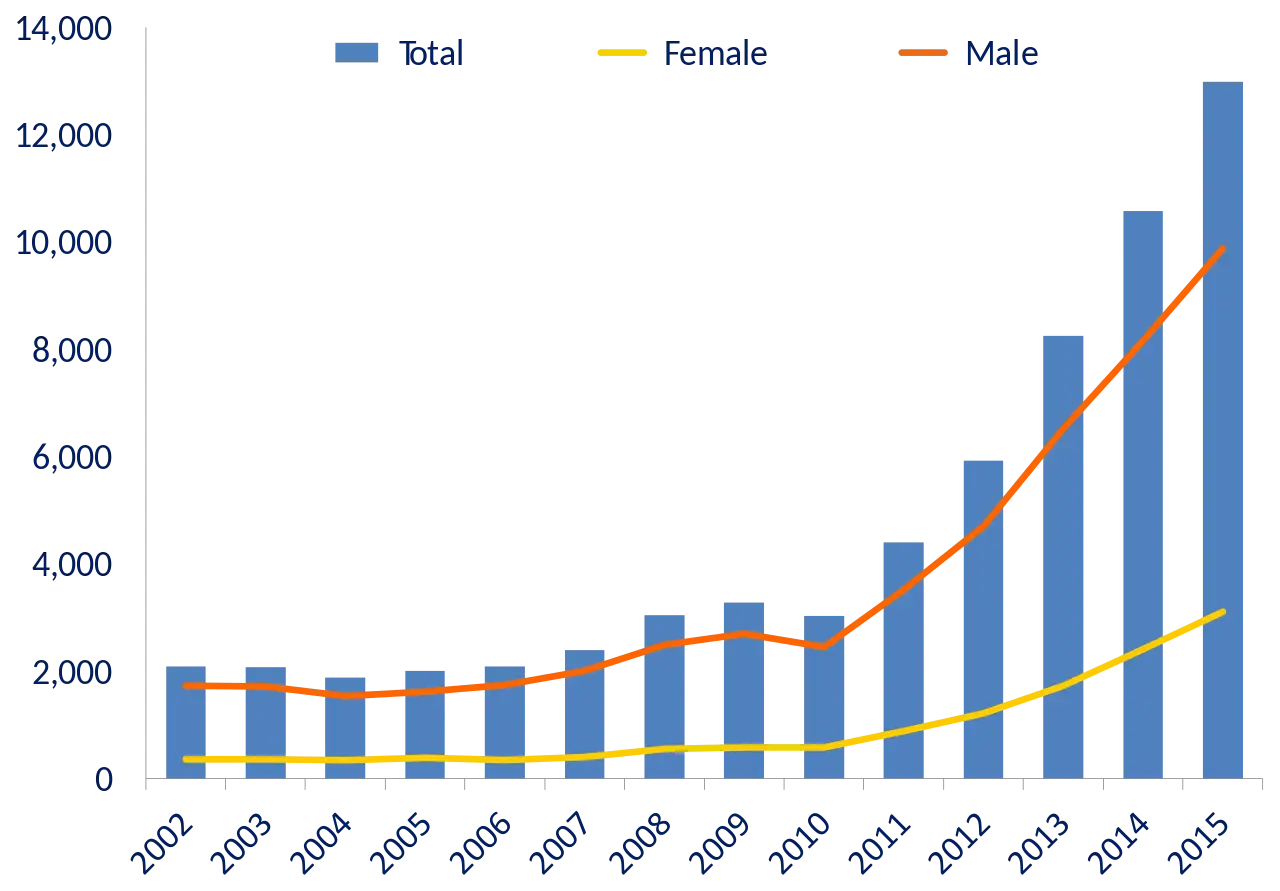
Bar Chart with Upward Arrow -

Infographic Pencil with Data Elements -

Search Growth Icon -

Illustration of Growth Chart with Upward Arrow -

Business People with Circular Chart -

Old Tree with Branches and Leaves -

Curved Black Upward Arrow -

Green Tree with Red Fruits and Grass -

Circular Arrows Representing Cycle or Loop -

Pink Lotus Bud Flower -

Green Vine Leaves -

Blue Declining Bar Graph with Arrow -

Business Icons Set for Digital Workflows -
Tree with Handprints for Team Collaboration -

Circle Pie Chart Icon -

Bull Market Symbol -

Document Processing Cycle -

Medical Cloud Symbol -

Young Seedlings in Soil -

Artificial Intelligence Laptop Interface Illustration -

Internal Hard Disk for Computer Storage