You Might Like
-
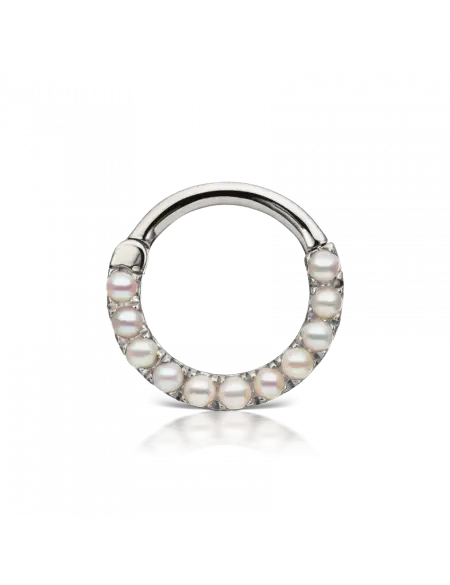
Pearl Ring Jewelry -

Blue Cartoon Character with Attitude -

Colored Regional Map of Africa -

Blue Play Button Icon -

Comfortable Pillows for a Good Sleep -

Blue Down Left Arrow Traffic Sign -

Blue Microsoft Edge Logo -
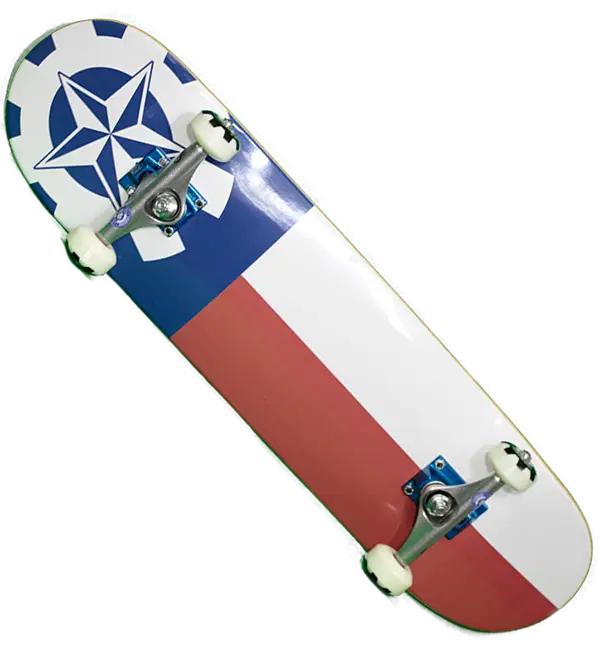
Cool Skateboard Deck -

Team with Growth Graph Illustration -

Blue Game Controller Icon -
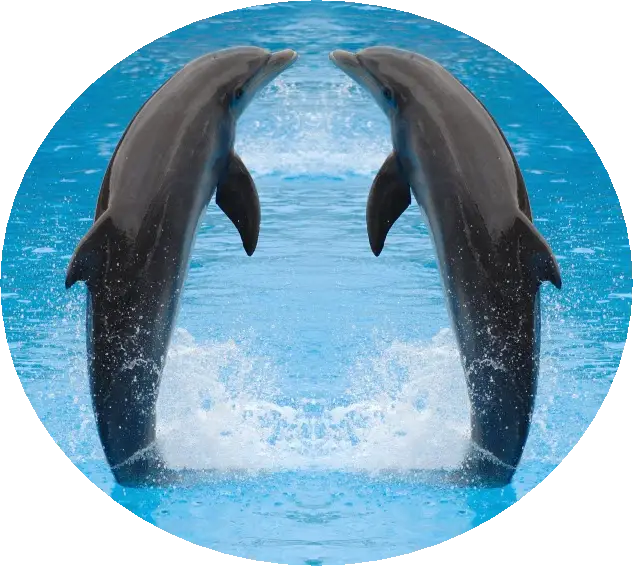
Playful Dolphins Jumping in Water -

Organizational Structure Chart -

Cute Blue Bunny Toy -
Splashing Water Circle Illustration -

Abstract Blue Flame Icon Design -

Blue Iris Flower Botanical Illustration -
Blue Walkie-Talkie Communication Device -

Various Devices Displaying Software -
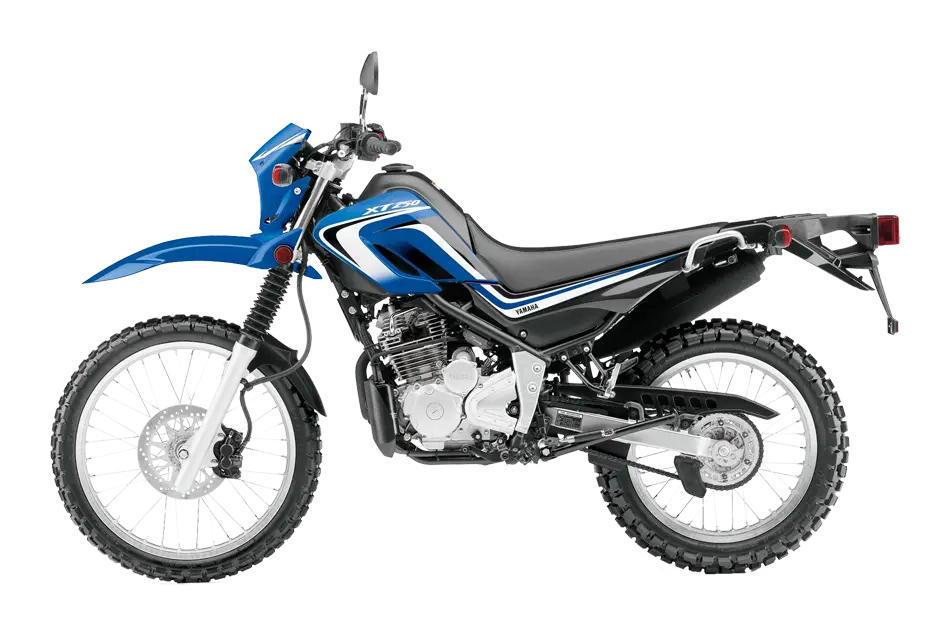
Blue Motorbike Illustration -

Shopping Cart with Items -

Sad Girl with Clouds and Rain -

Complete Blue World Map -
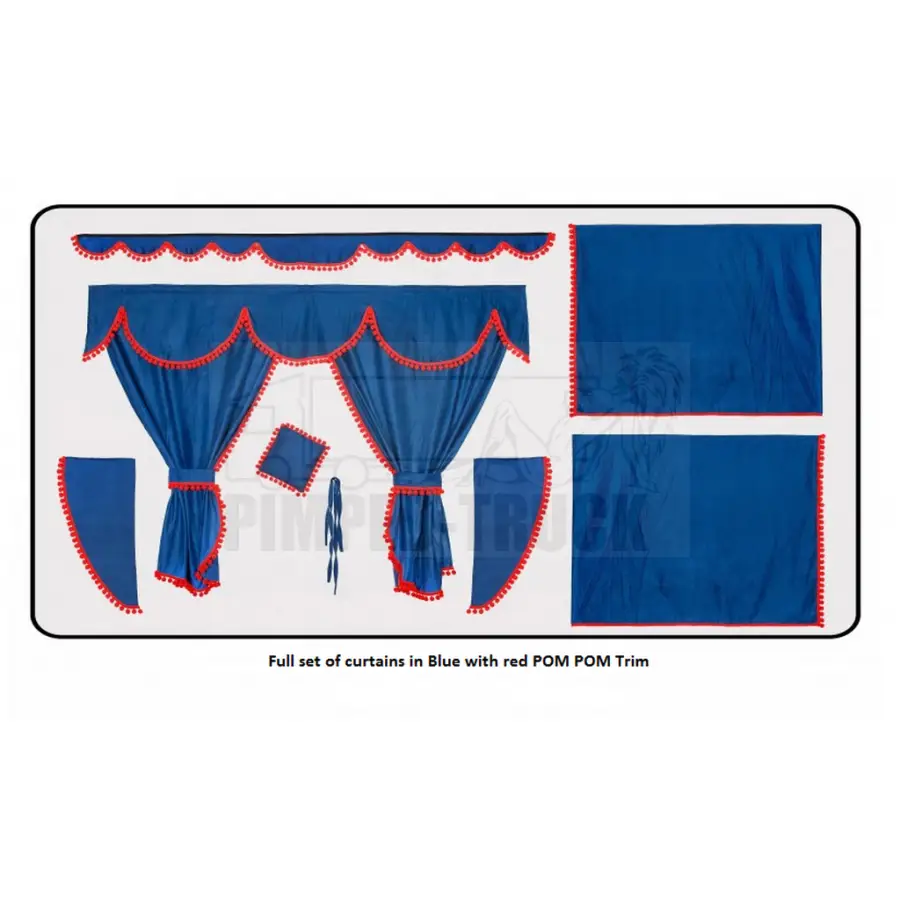
Blue Curtains Set with Red Trim -

Icon of KPI Dashboard with Graph and Person -
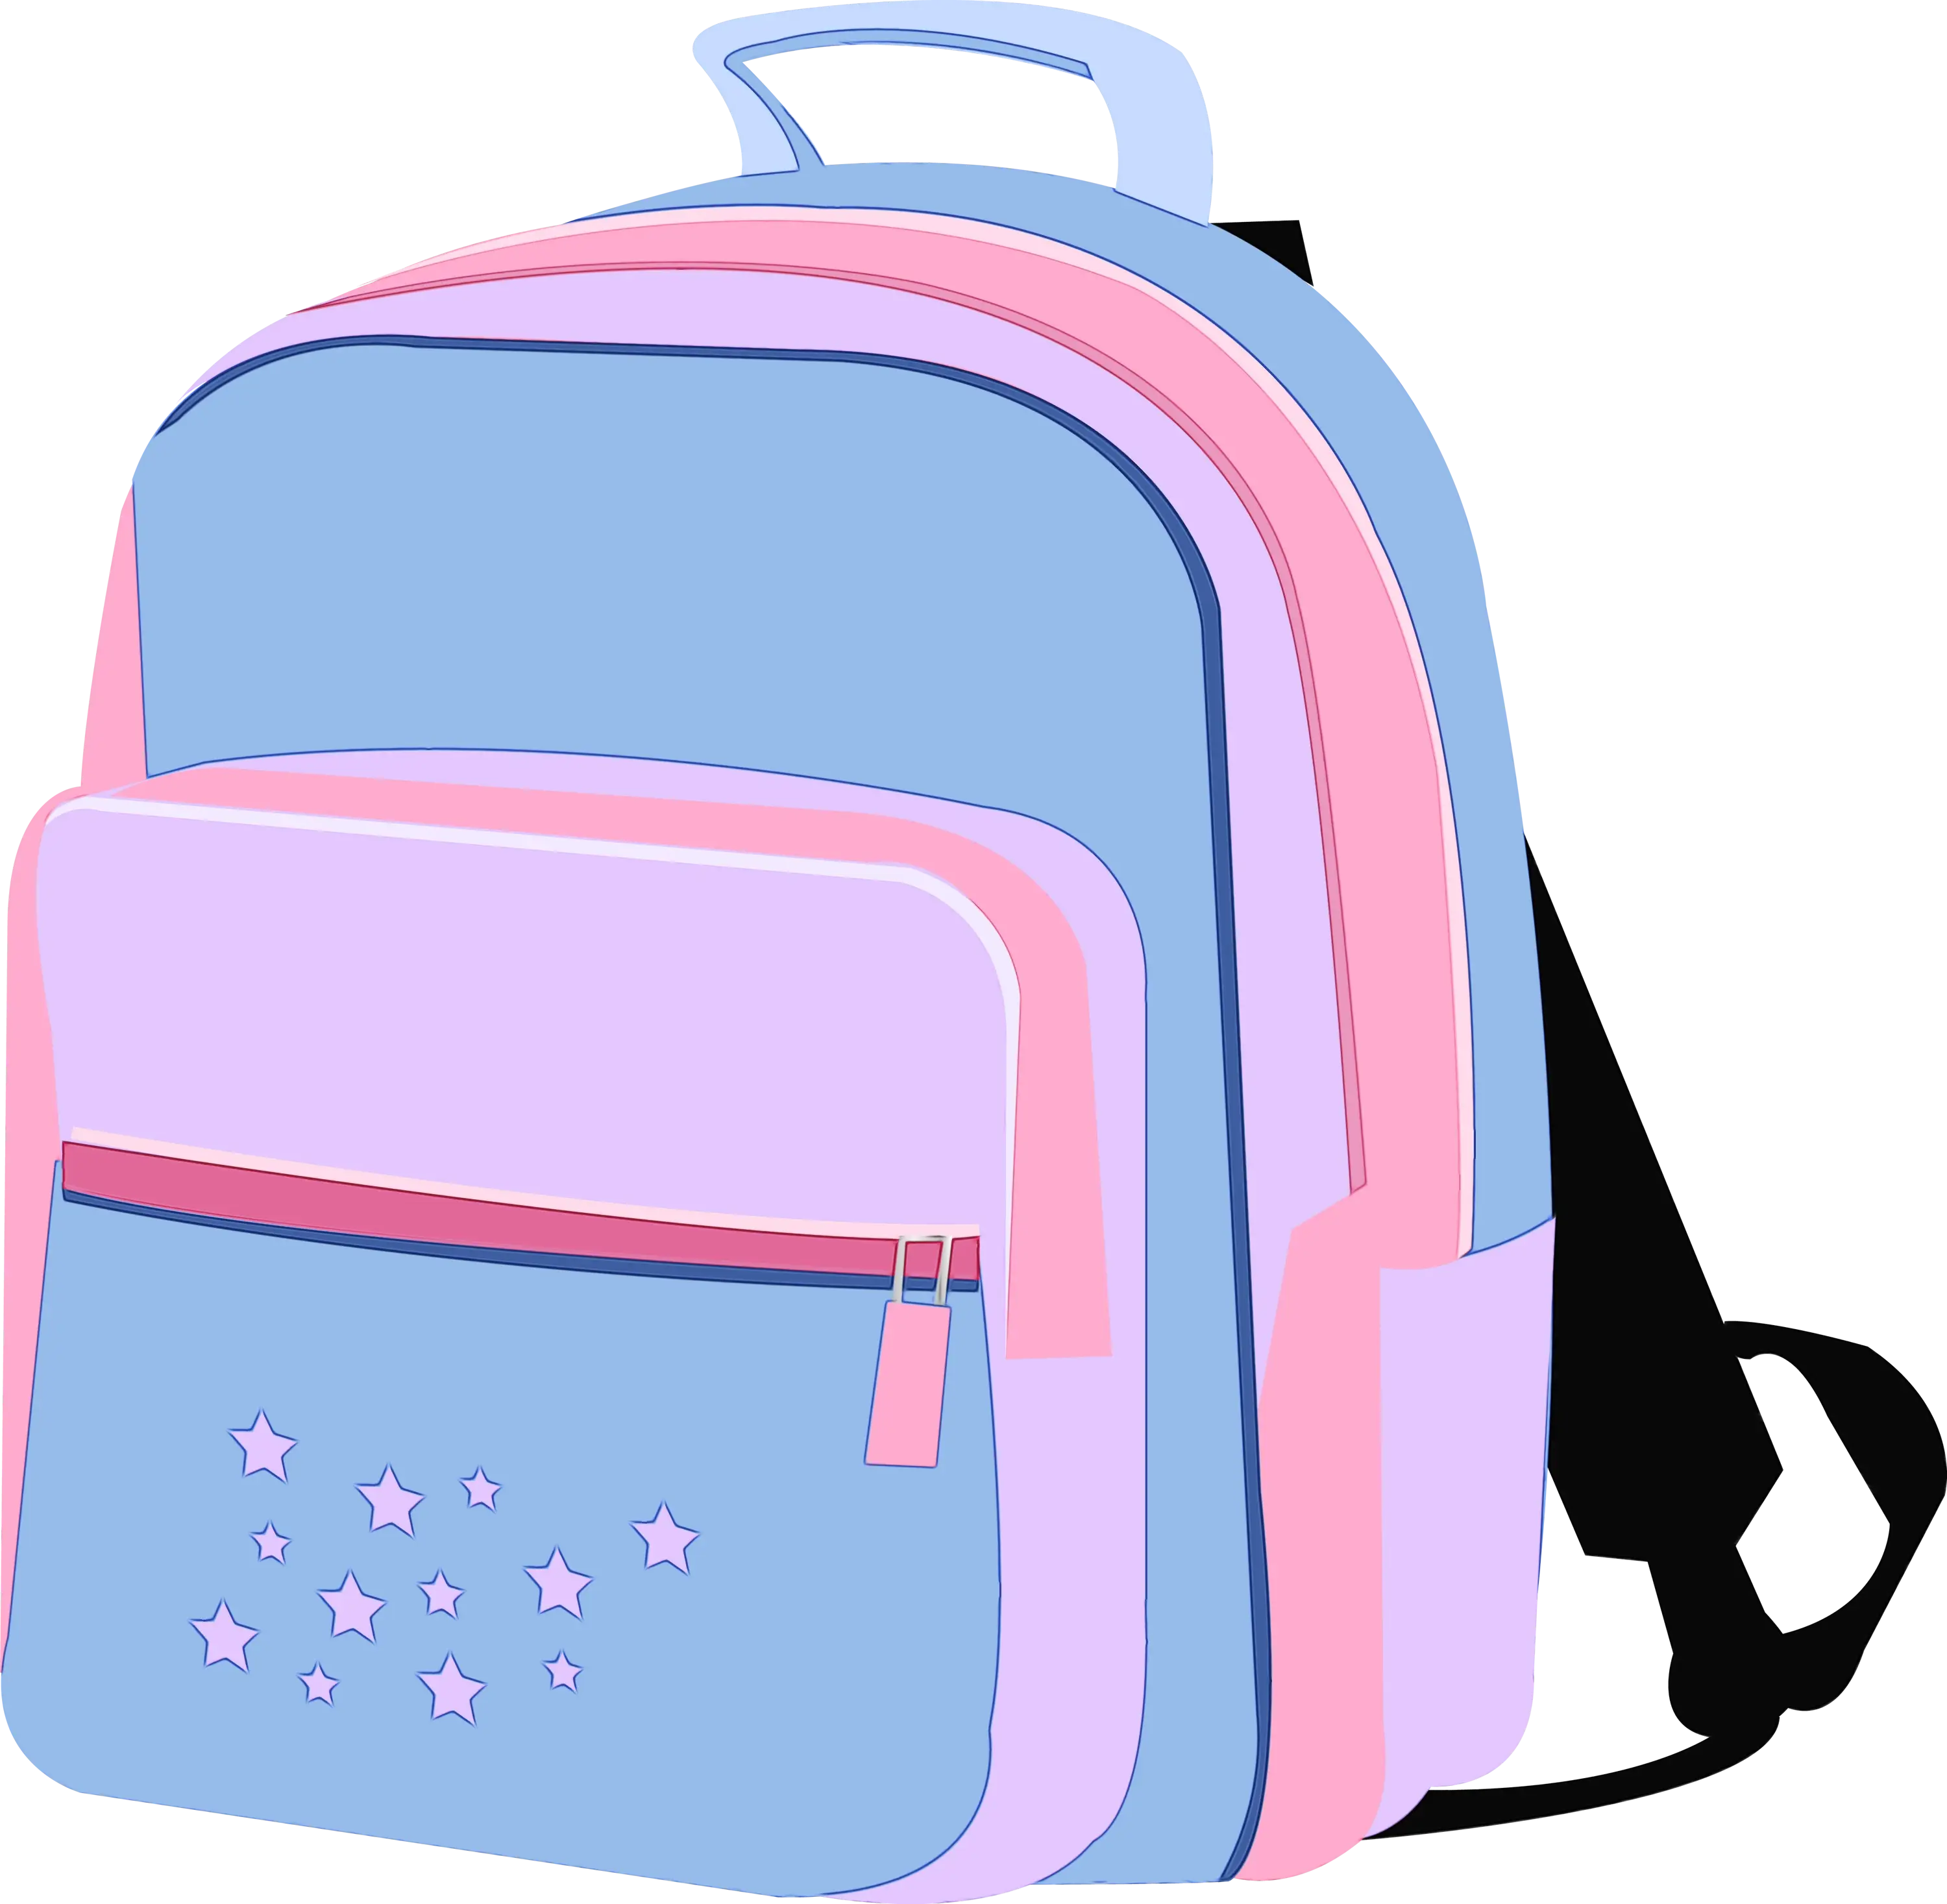
Blue and Pink Backpack with Star Details -
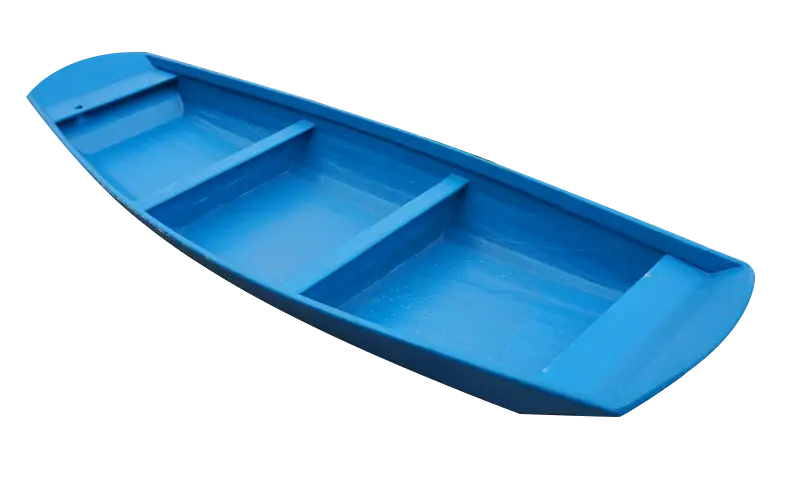
Blue Boat Illustration -
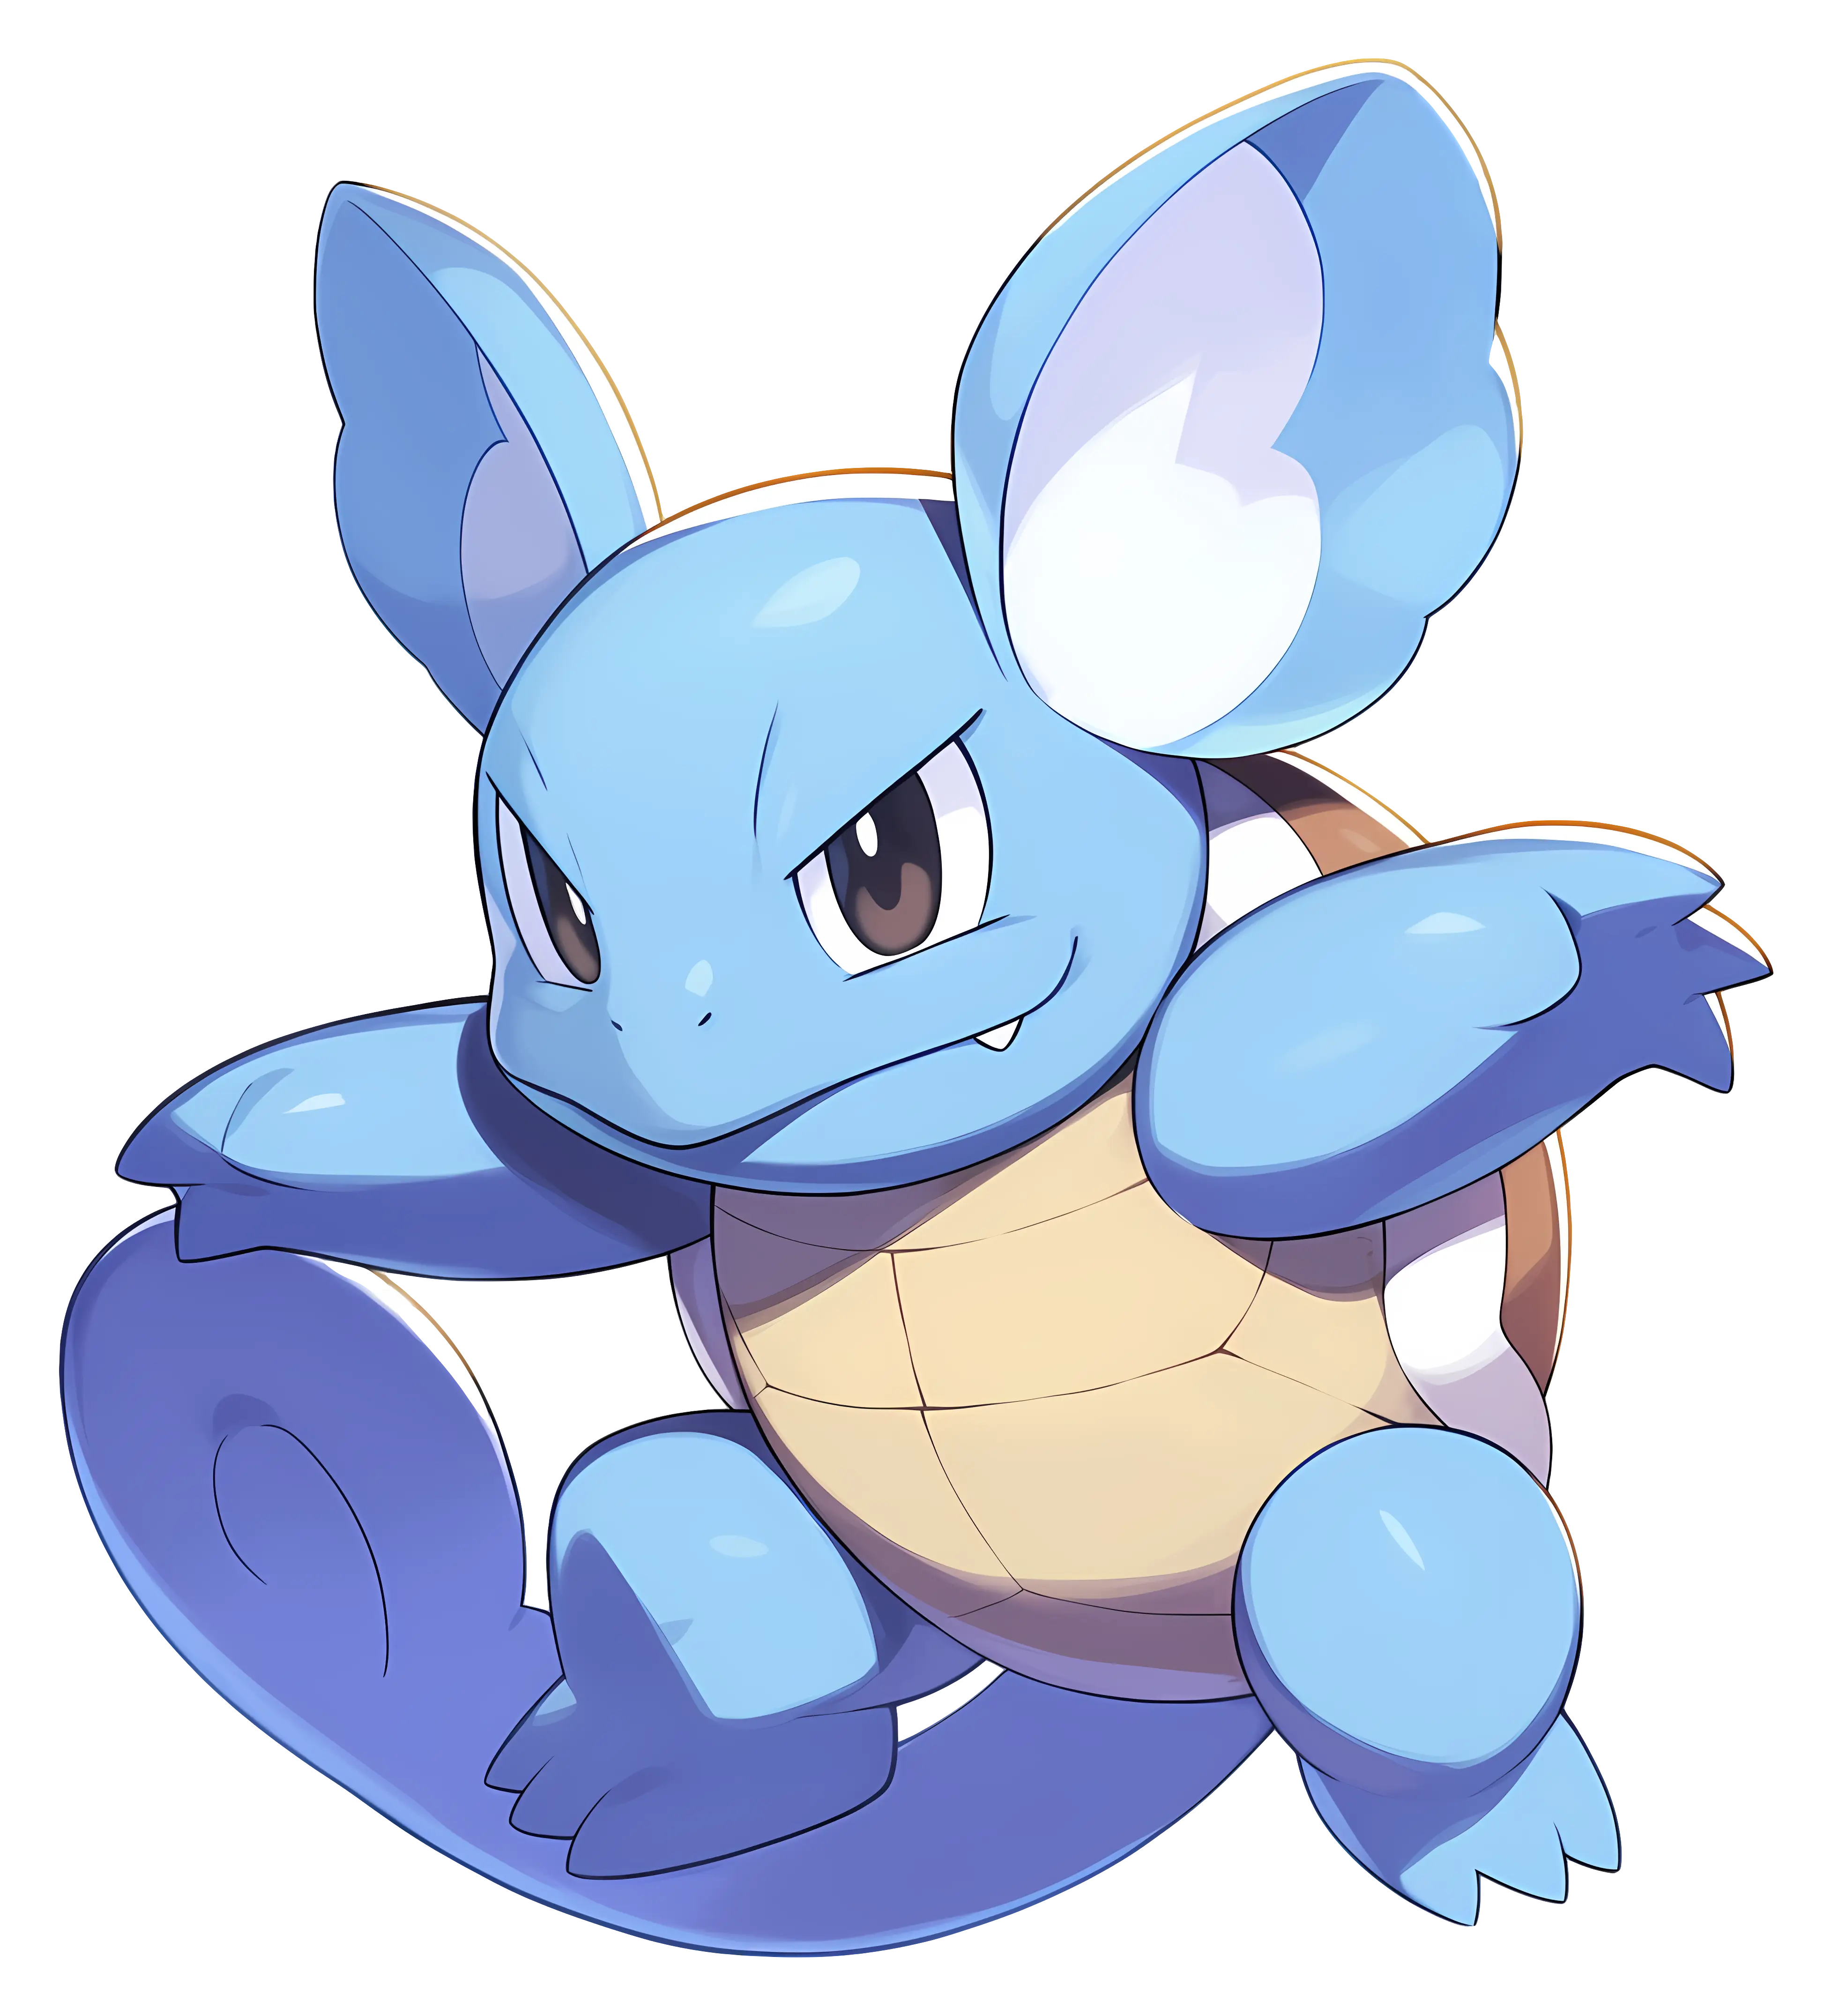
Blue Cartoon Turtle -

Blue App Store Logo Illustration -
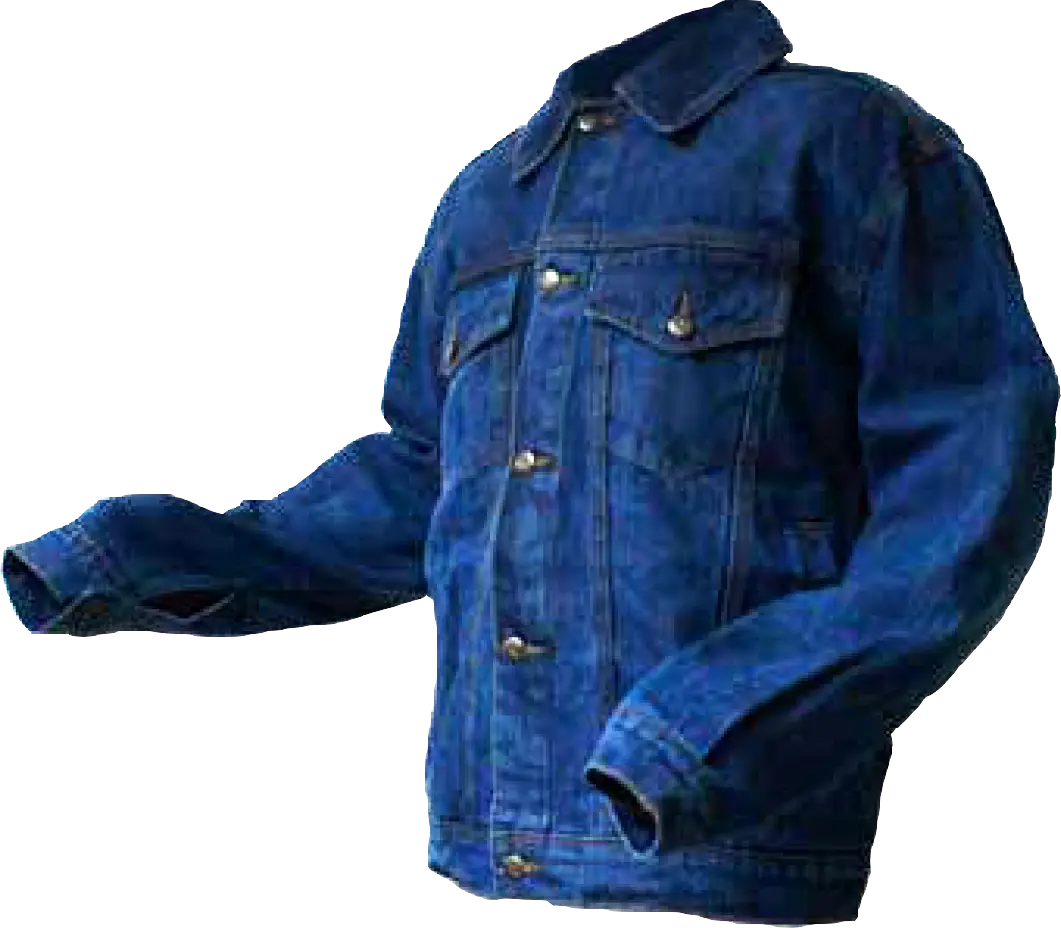
Classic Blue Denim Jacket -
Blue Sports Beanie for Cold Weather