
Business Process Flowchart
This diagram illustrates a strategic business model, outlining how different organizational goals, outcomes, and capabilities are interconnected to achieve a primary objective: increasing profit. It maps out dependencies, showing how strategies like "Operational Excellence," "Centralize IT Systems," and "Standardize Products" contribute to desired outcomes such as "Decreased Costs" and "Increased Revenue." The model also highlights the business functions and resources, like "IT Management & Operations," "Product Management," "Human Resources," and "IT Resources," that support these initiatives, and identifies potential negative impacts such as "Loss of Customers." It's a clear representation of strategic alignment within an organization.
business strategy - goal alignment - process model - enterprise architecture - profit optimization - operational excellence - business management
You Might Like
-
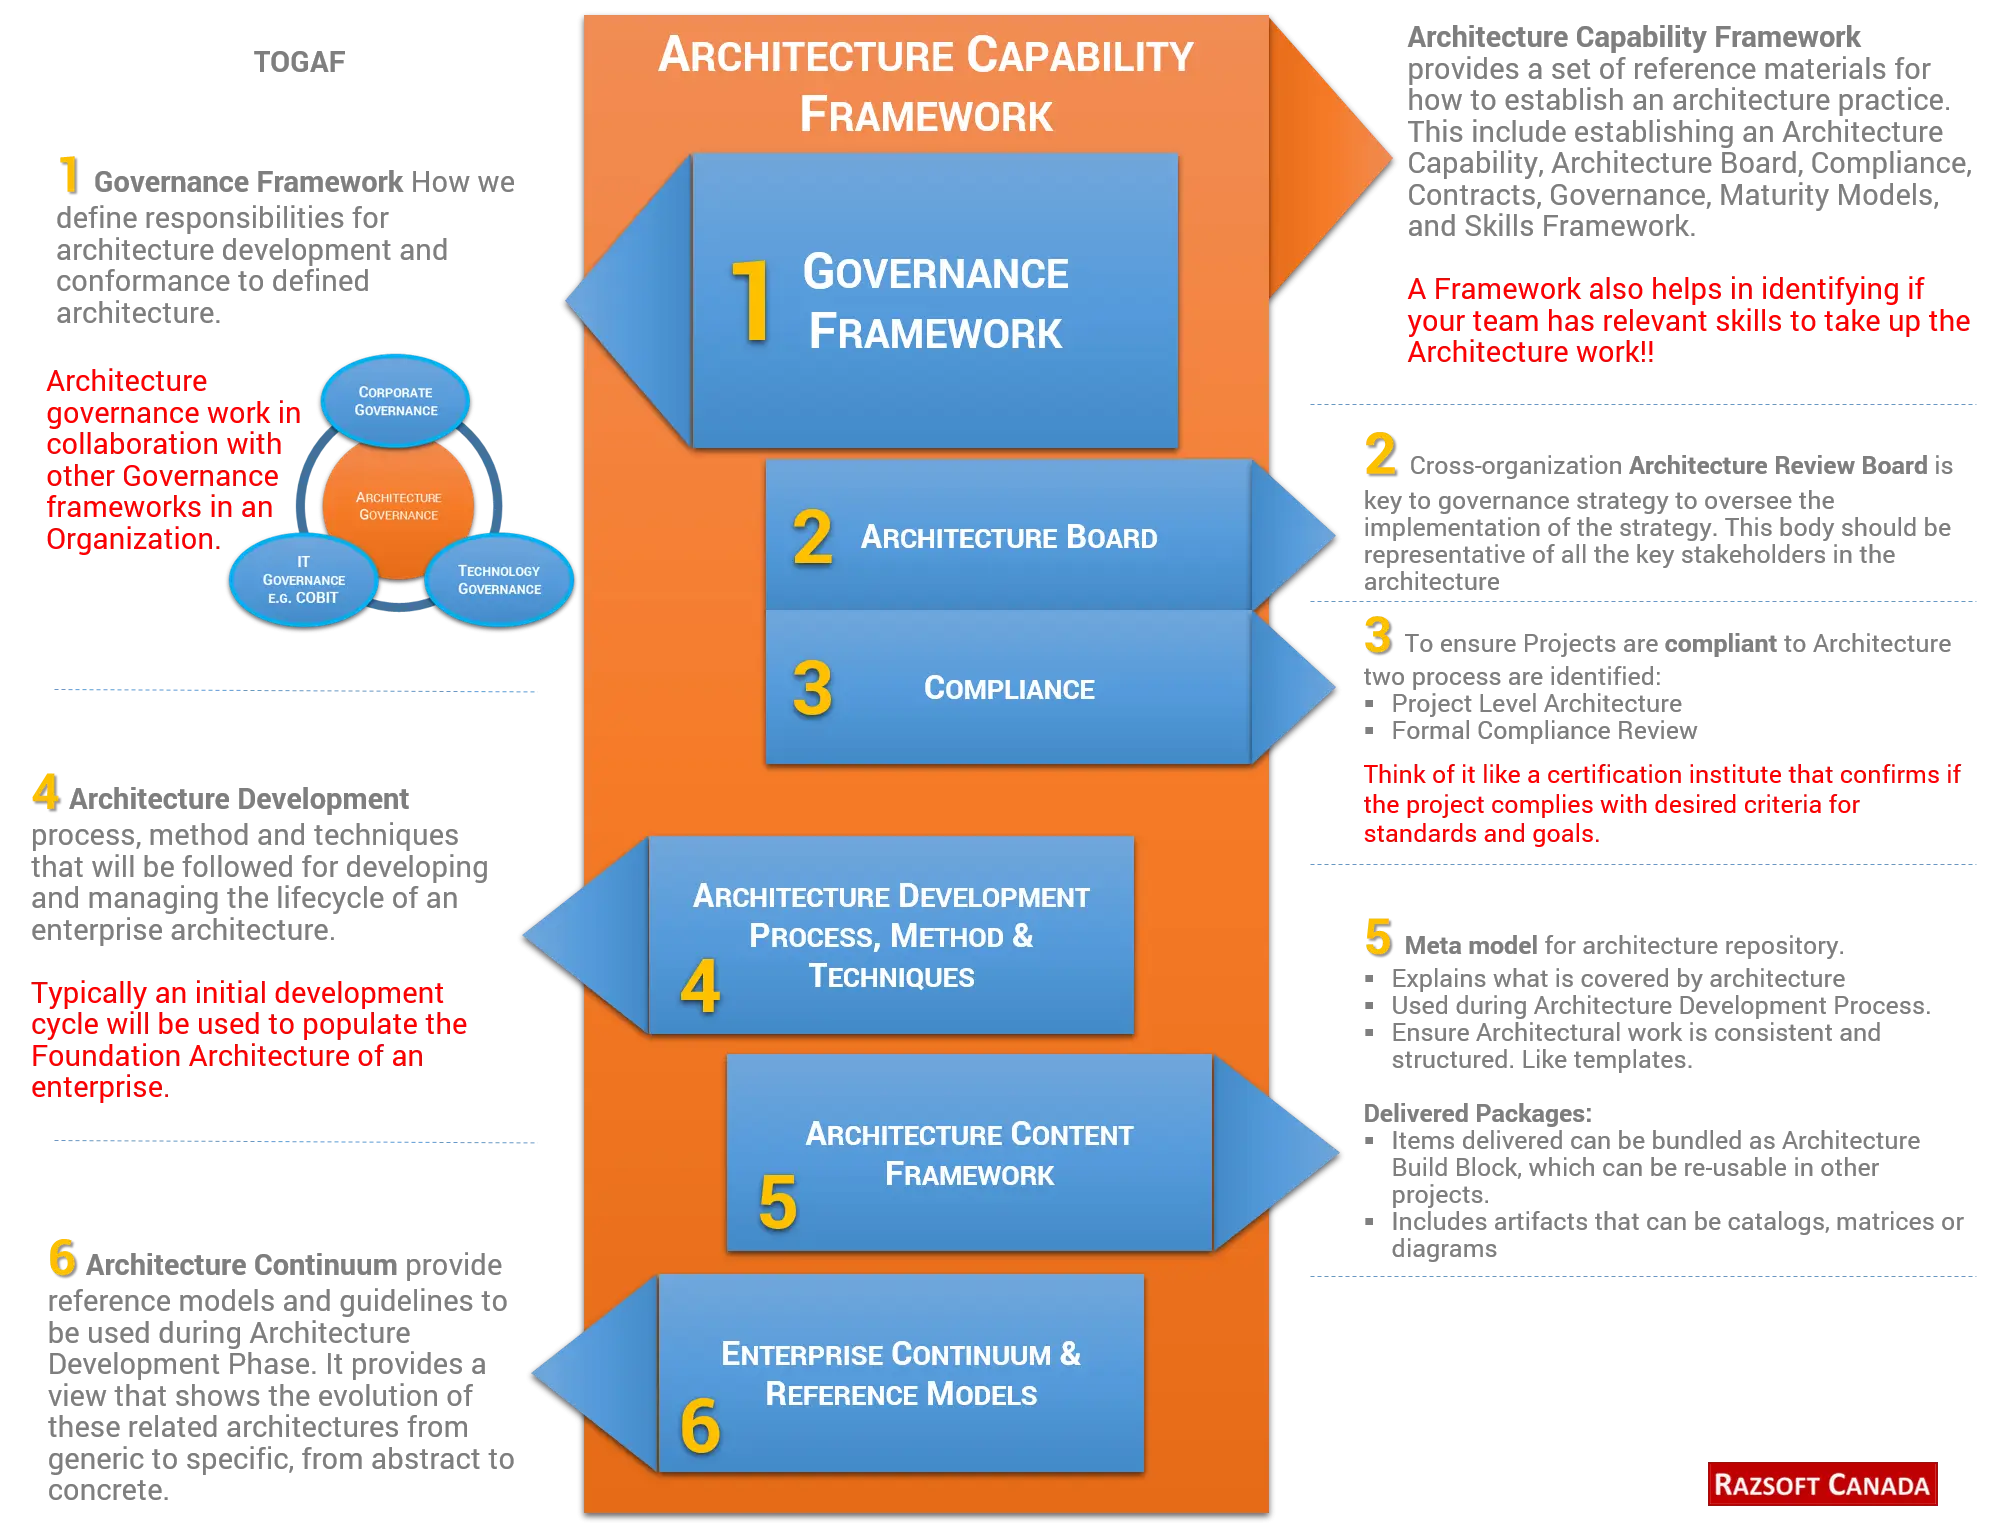
Architecture Capability Framework Infographic -
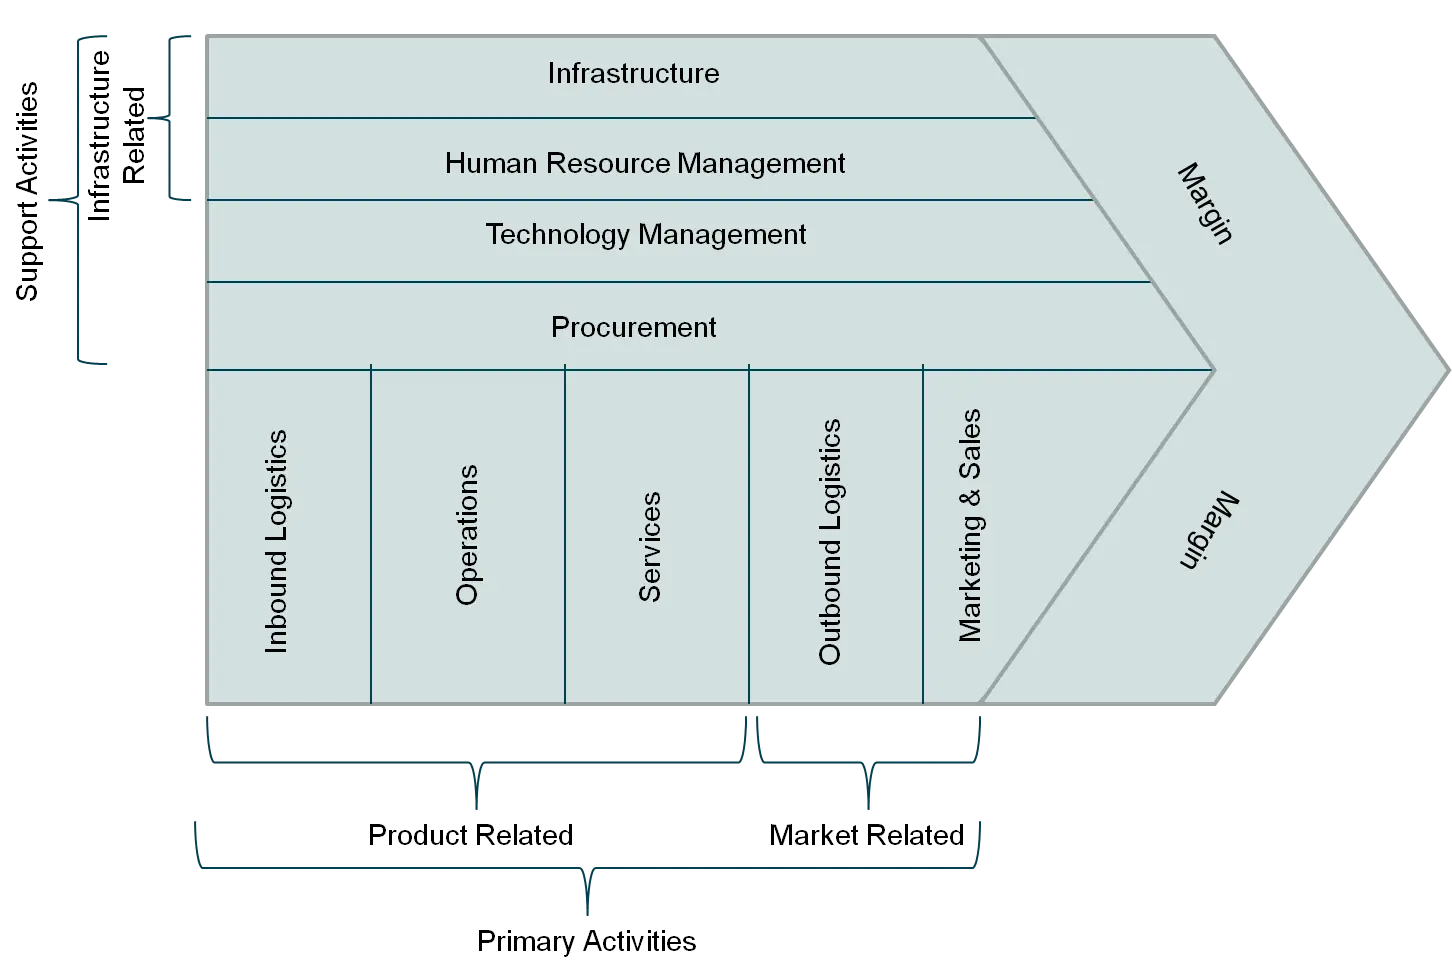
Business Value Chain Diagram -
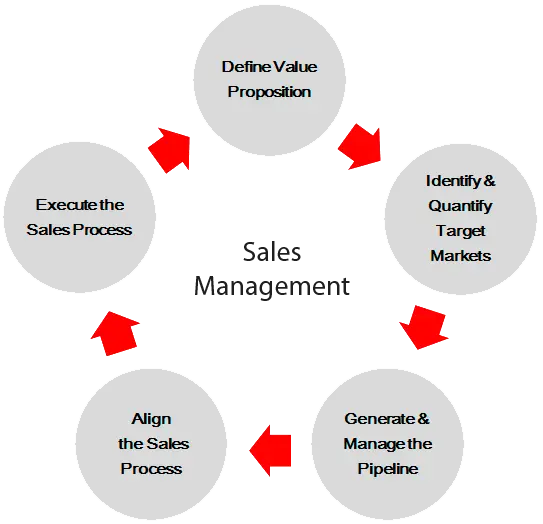
Sales Management Process Diagram -
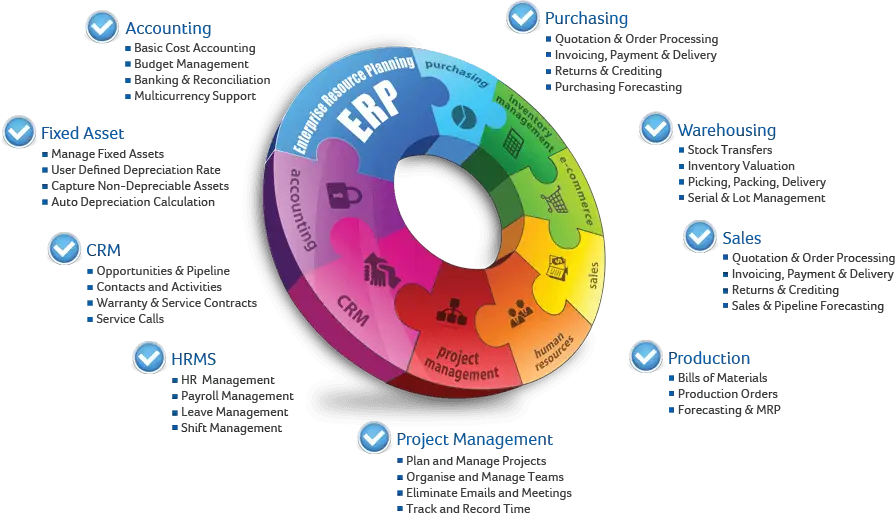
ERP Diagram for Business Management -
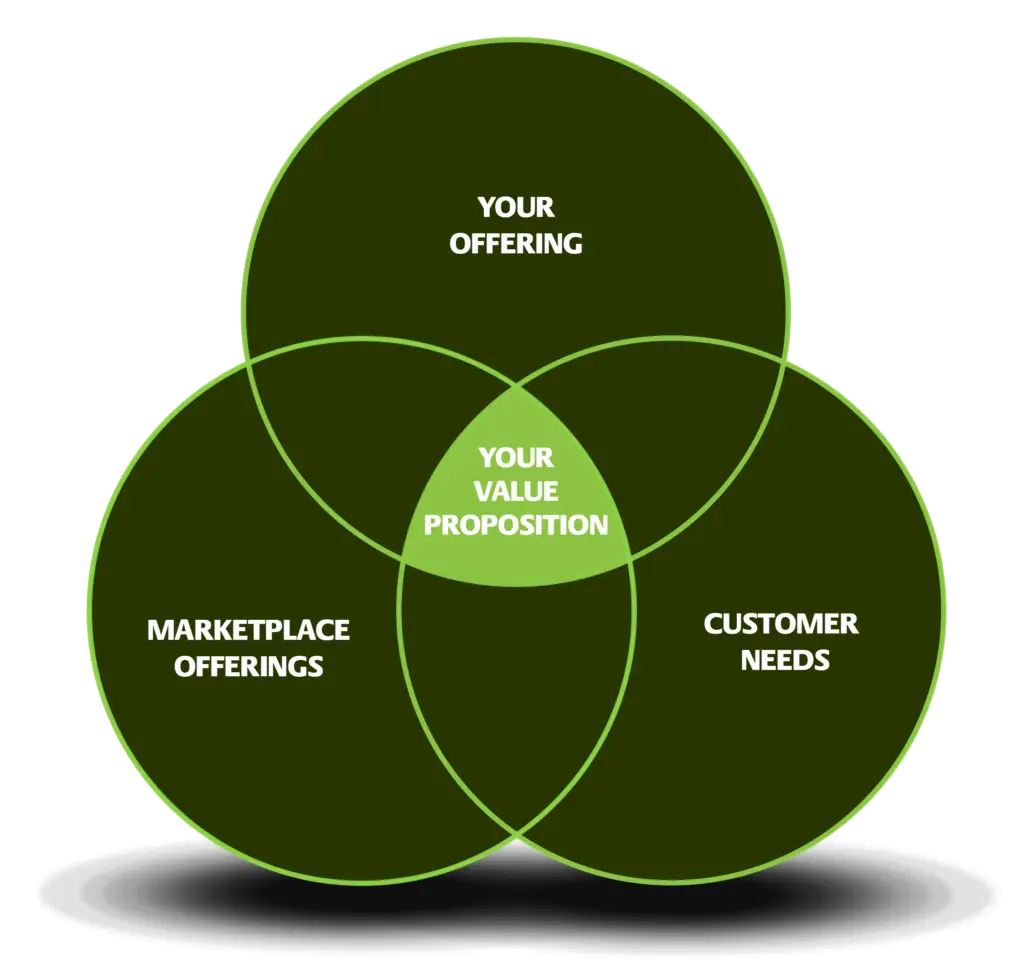
Value Proposition Venn Diagram -
Businessman Illustration with Office Icons -
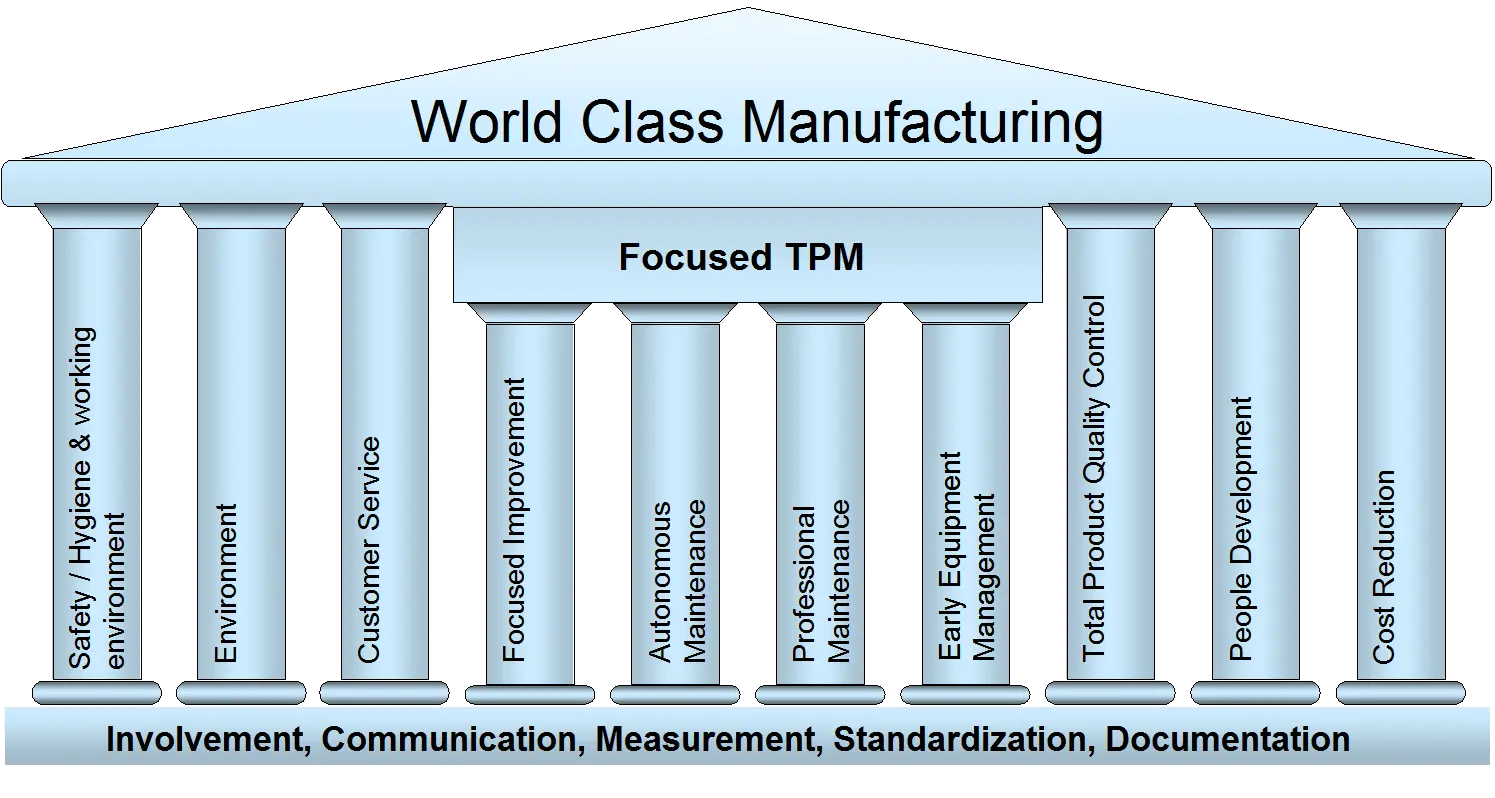
World Class Manufacturing Pillars -
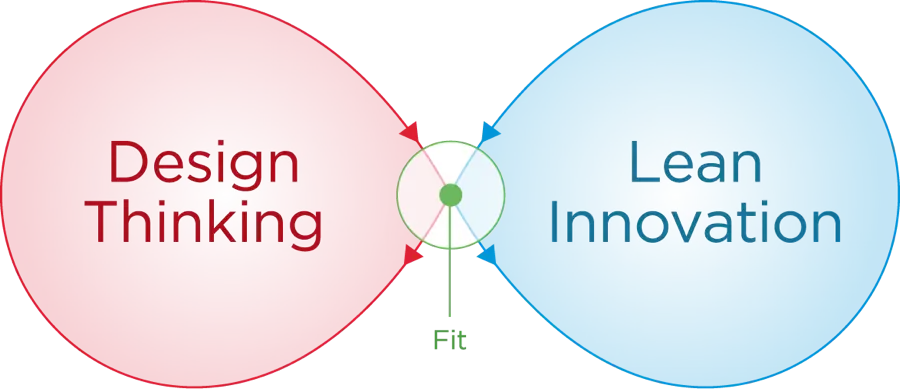
Design Thinking and Lean Innovation Venn Diagram -
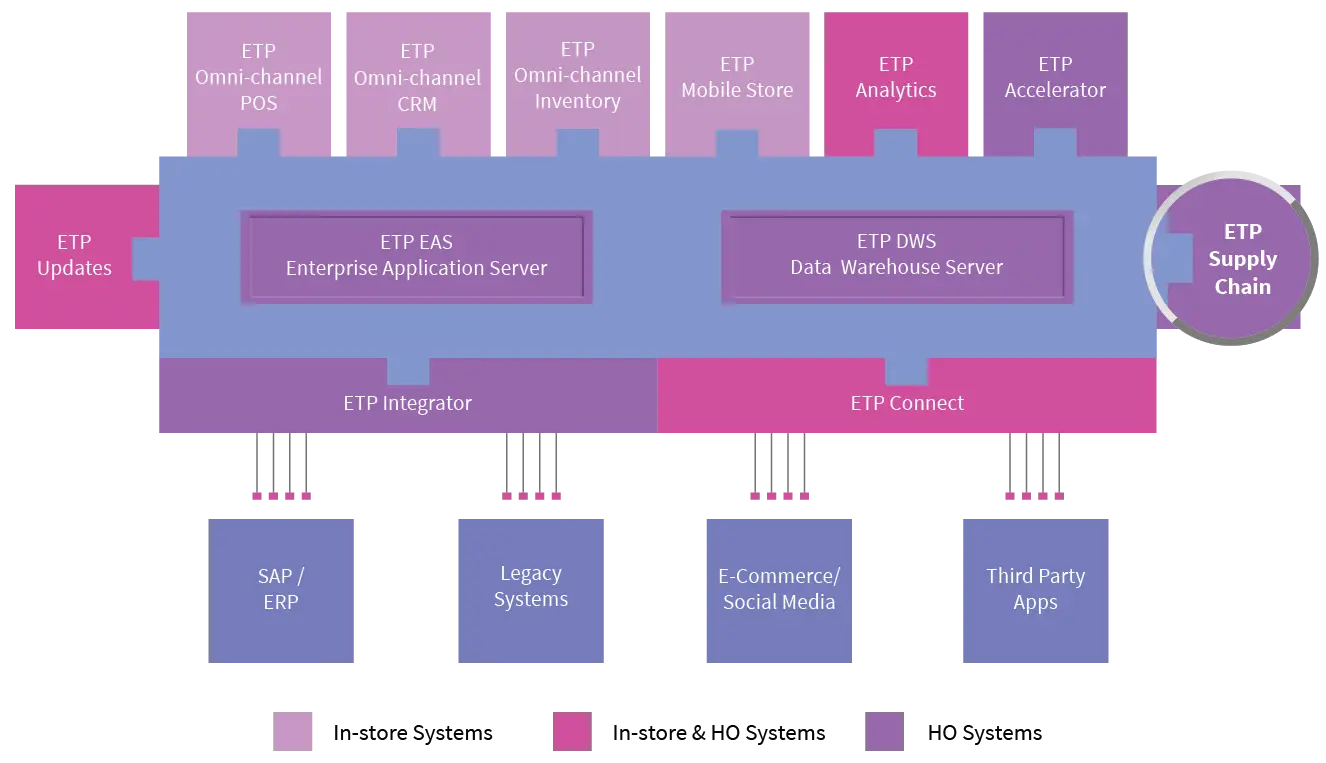
Supply Chain System Diagram -
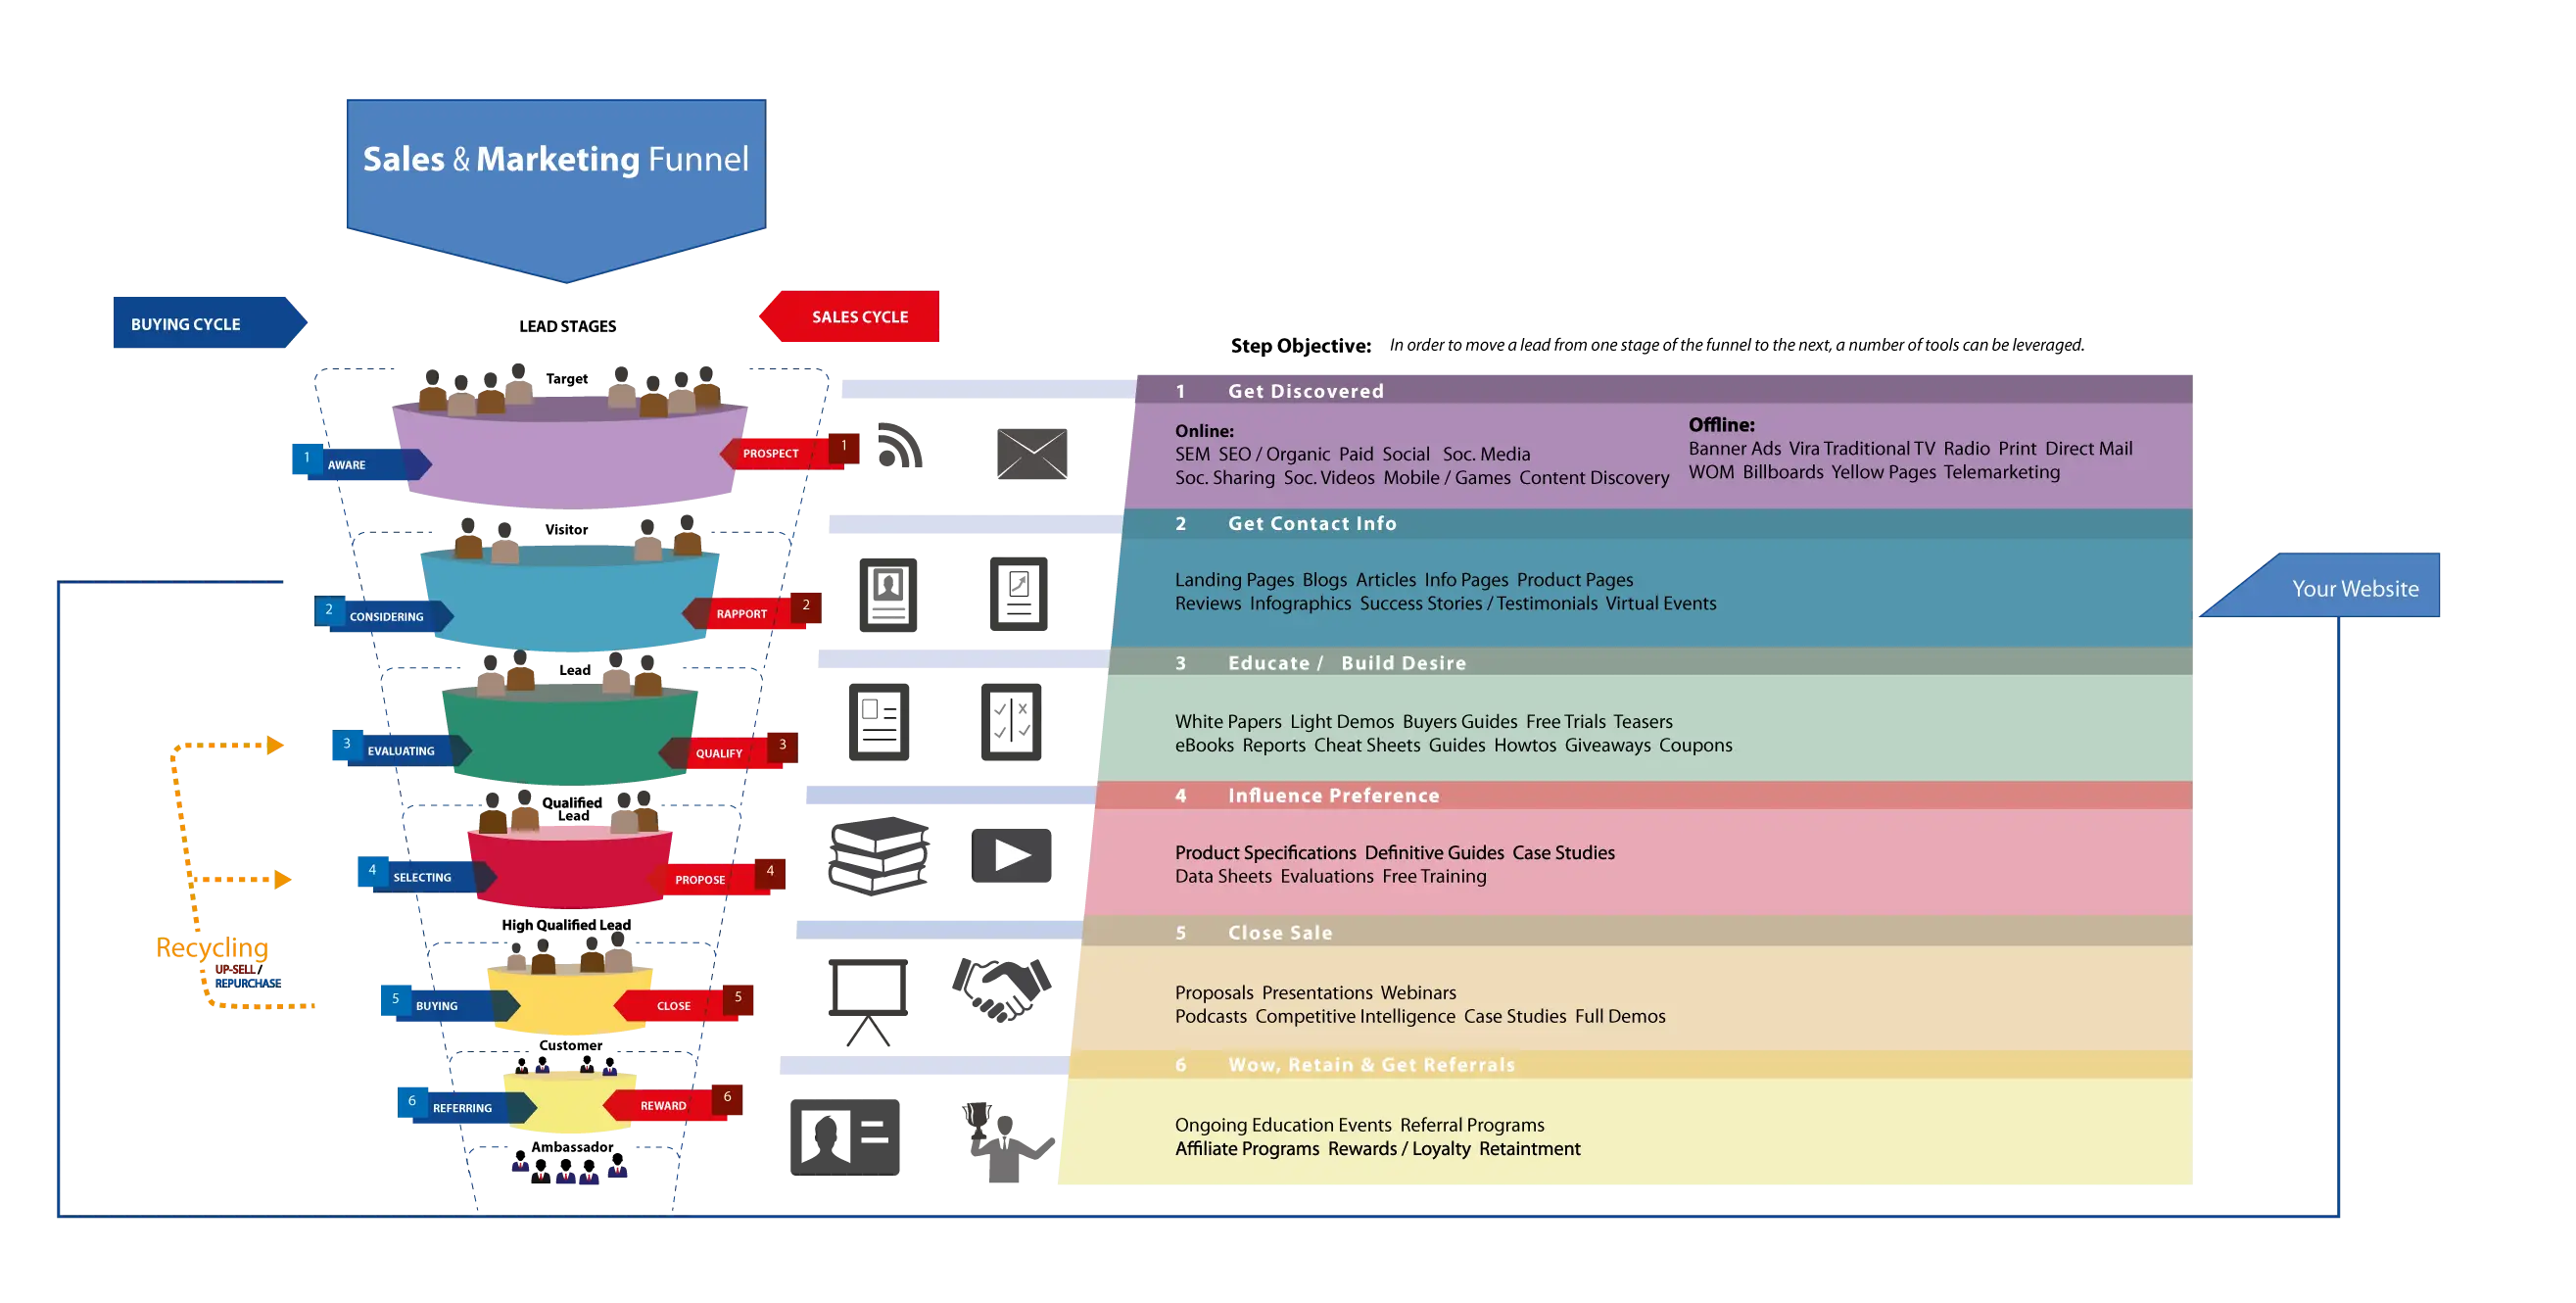
Sales and Marketing Funnel Diagram -
Blue Customer Relationship Management Icon -
Successful Businessman with Growth Icons -
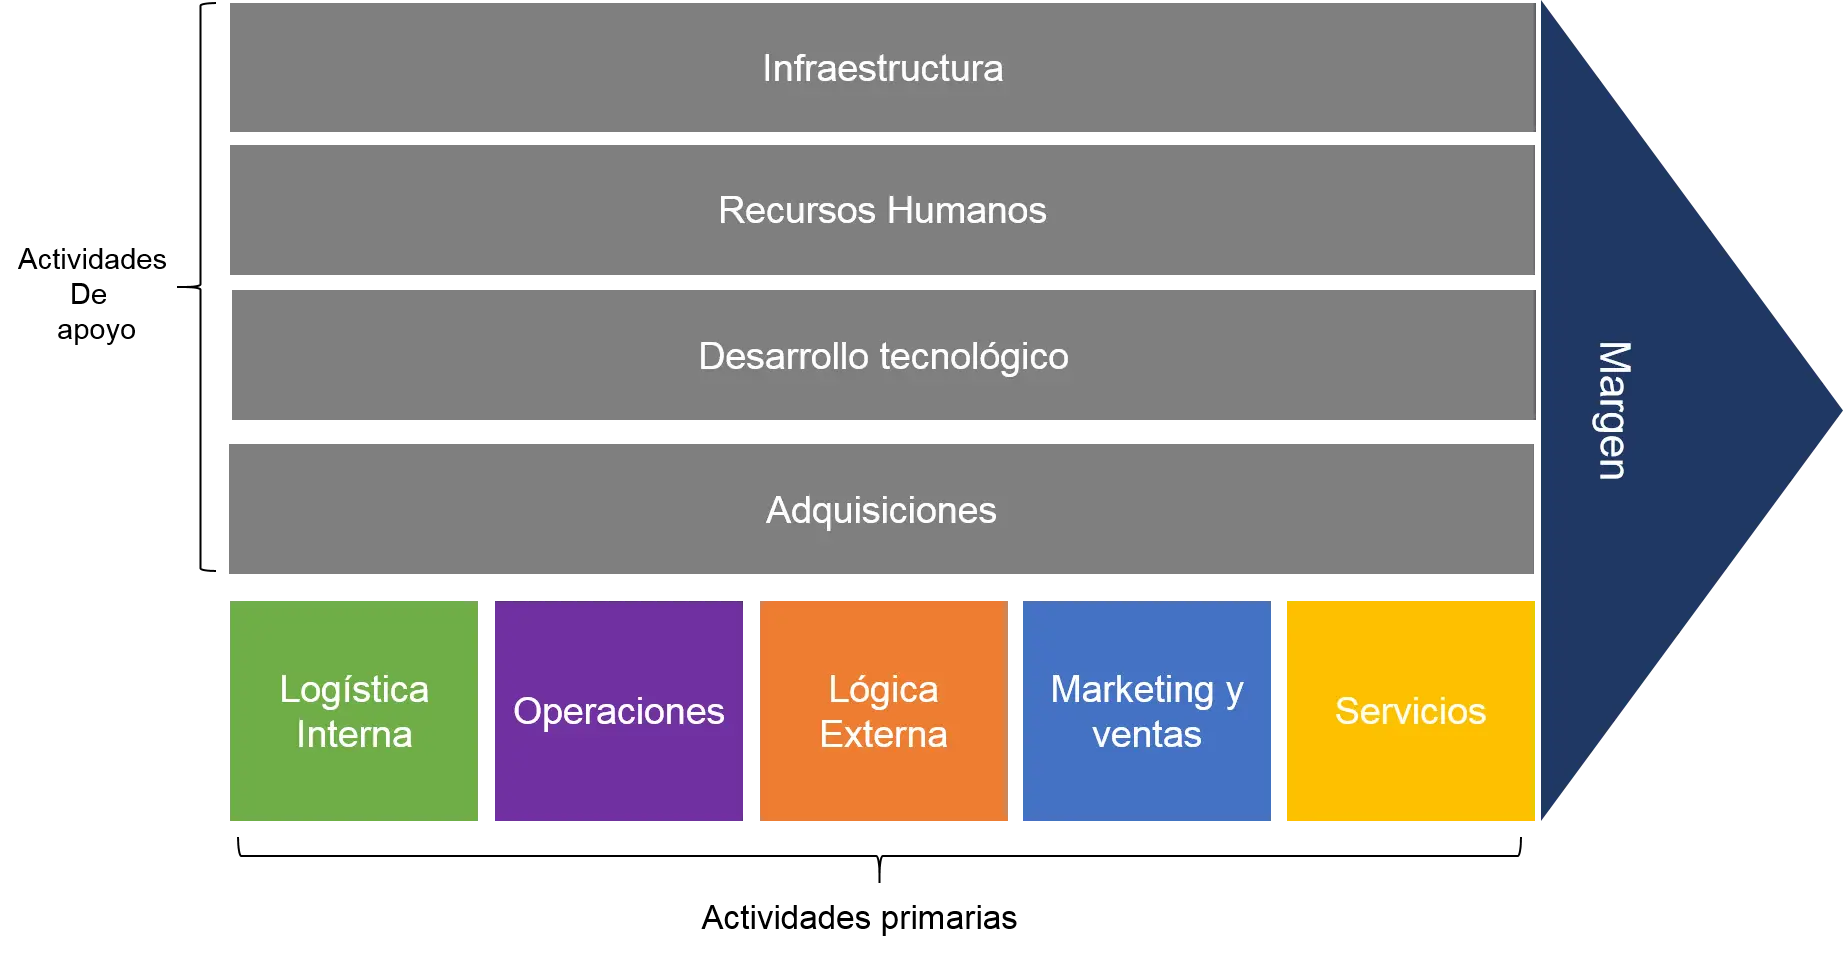
Value Chain Diagram with Primary and Support Activities -
Smartphone with Social Media Apps