
You Might Like
-

Organizational Structure Chart -

Golden Bitcoin Cryptocurrency Coin -

Bar Chart with Upward Arrow -

Circle Pie Chart Icon -

Book Icon with Blue Background -

Pie Chart Representation -

Cartoon Businessman Holding Bitcoin -
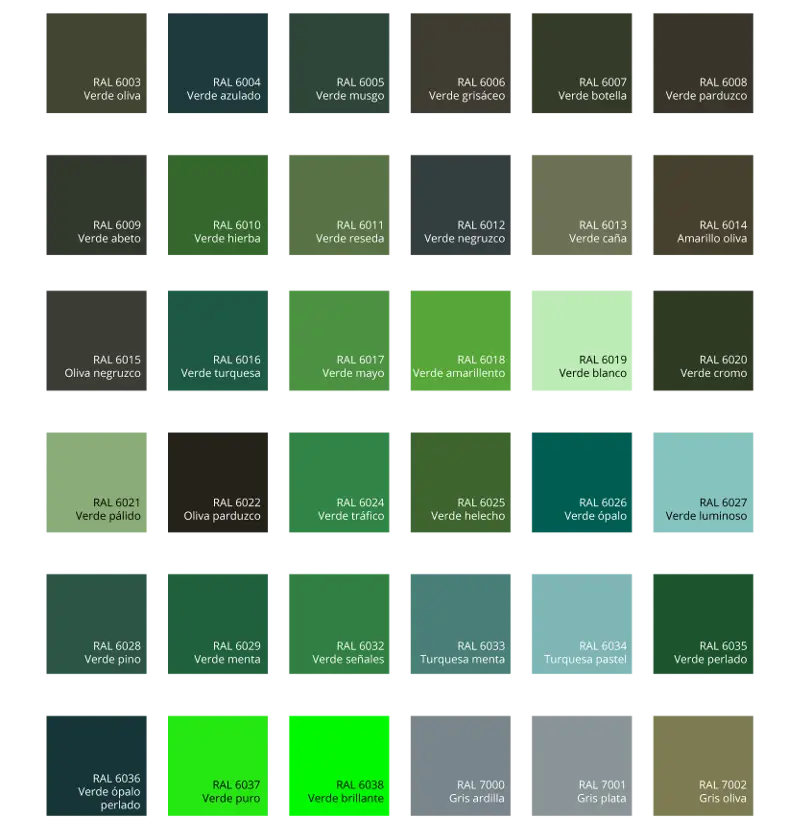
Green Color Palette Chart -

Clipboard Illustration with Financial Chart for Data Analysis -

Green Flowchart Diagram -

Colorful Bar Graph Illustration -

Upward Arrow on Graph -

Colorful Infographic for Data Presentation -

Workspace Setup with Chart and Desk -

Colorful Infographic Chart -

Electroneum Cryptocurrency Logo -

Colorful Circular Chart -

Bar Chart Icon for Data Analysis -

Sketch of a Stack of Bitcoins for Cryptocurrency Concept -

Nautical Chart of Samola and Vano -

Colorful Descending Bar Graph Illustration -

Blue Upward Arrow with Bar Chart Icon -

Data Analysis Document with Magnifying Glass -

Business Presentation Illustration -

Organizational Hierarchy Chart -

Money Growth Chart -

Bitcoin Cryptocurrency Logo -

Bitcoin Logo with Circular Design Elements -

Simple Blue Bar Graph Chart Illustration -

Trading Monitor with Financial Data Display