You Might Like
-

Colorful Peace Sign -

LinkedIn Professional Networking Platform Logo -

Light-Up Decorative Stars for Holiday Season -
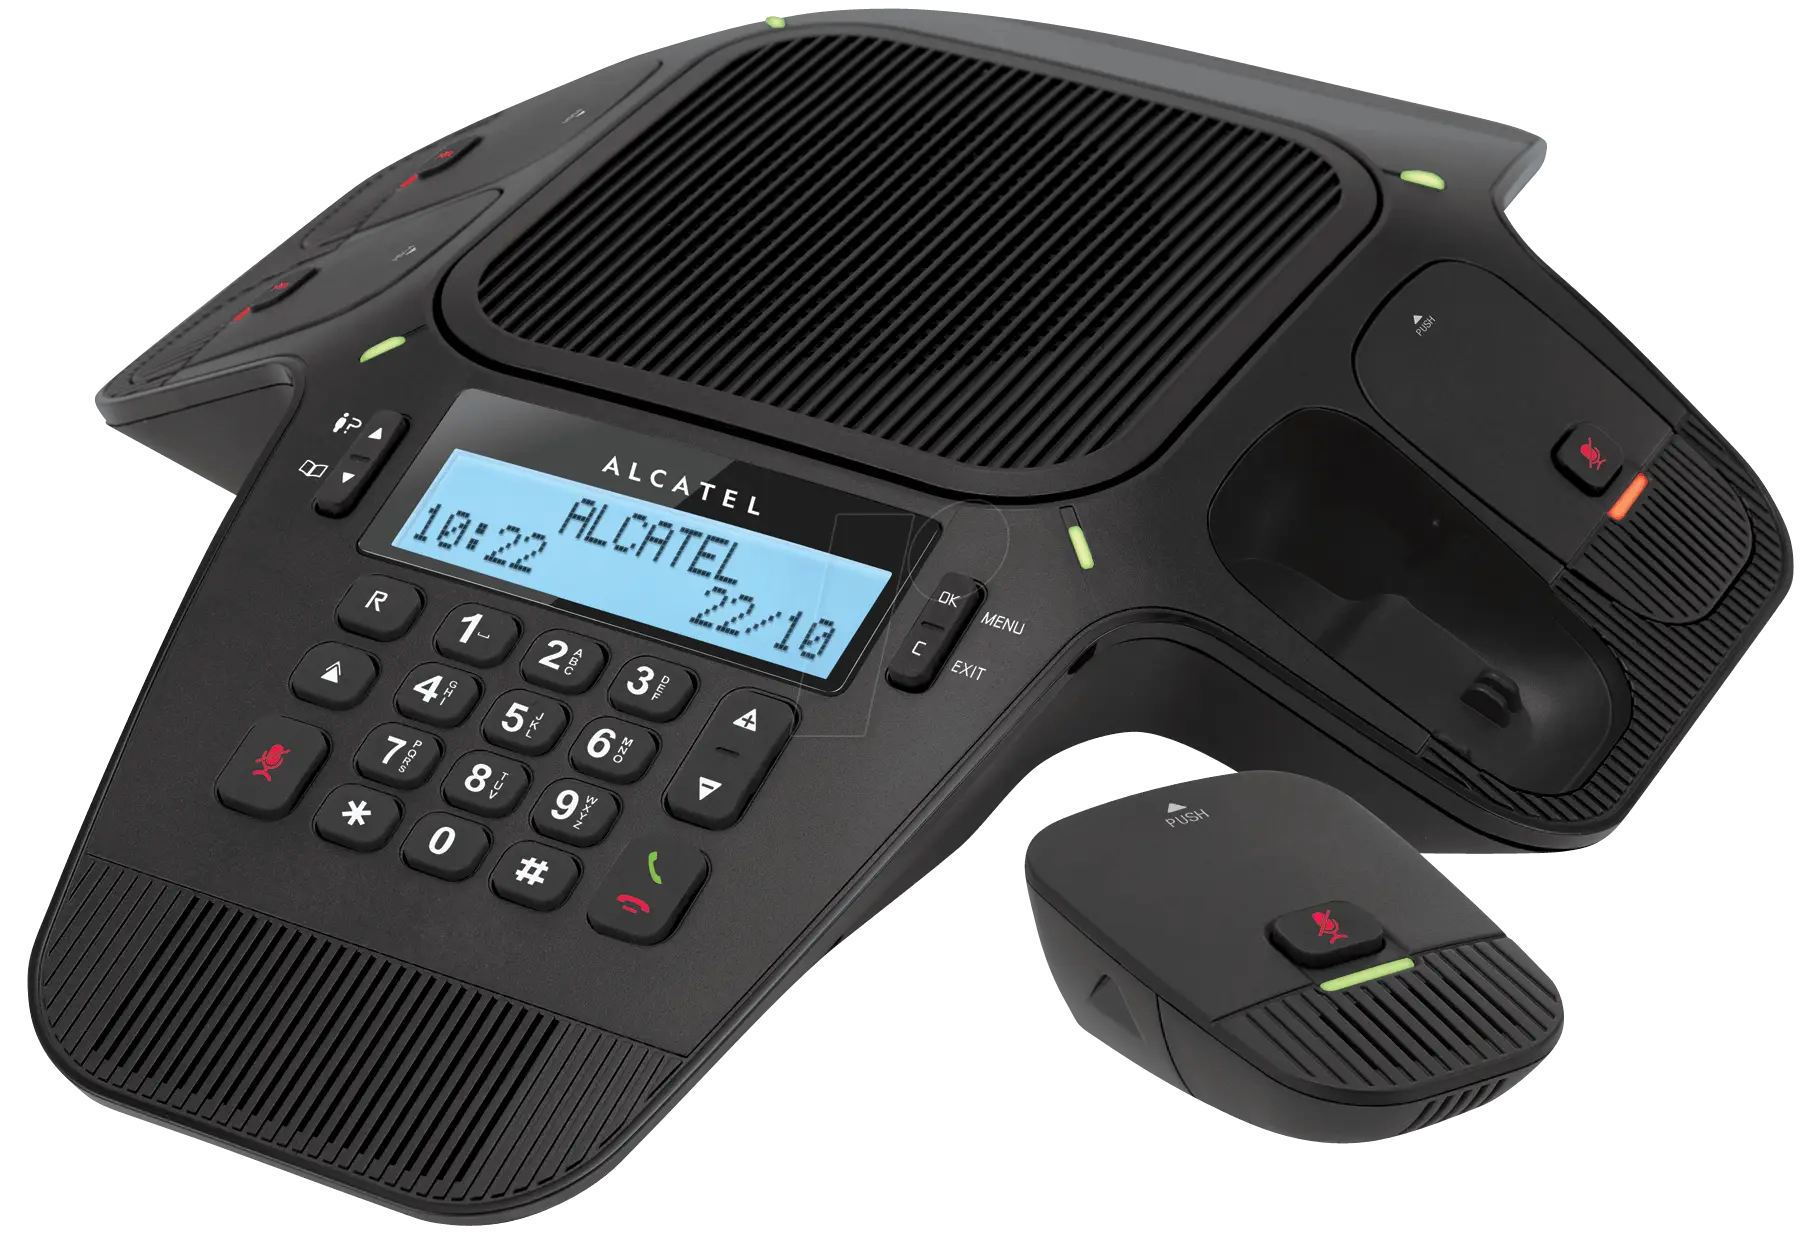
Modern Office Conference Phone System -

Colorful Party Decorations with Confetti and Banners -
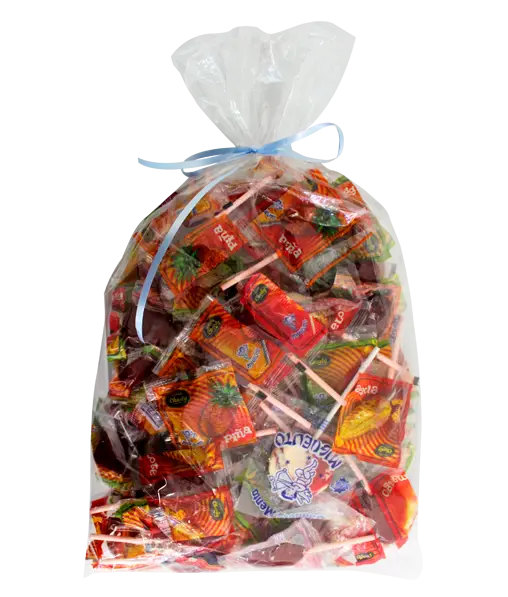
Colorful Bag of Lollipops -
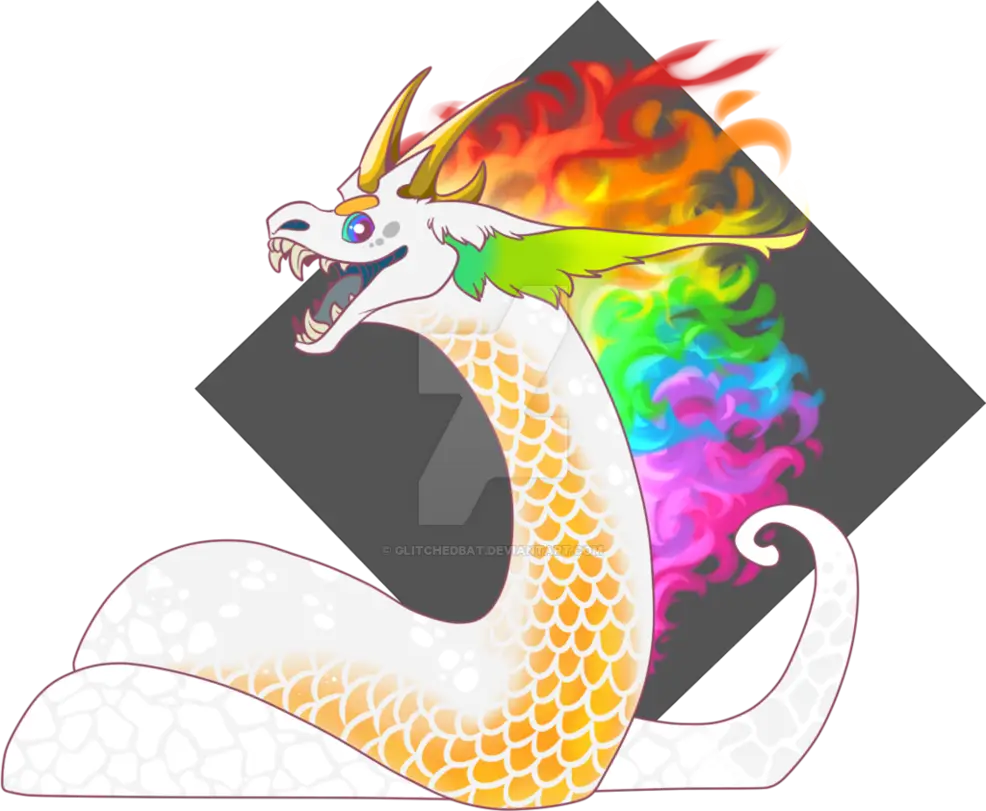
Colorful Rainbow Dragon Illustration -

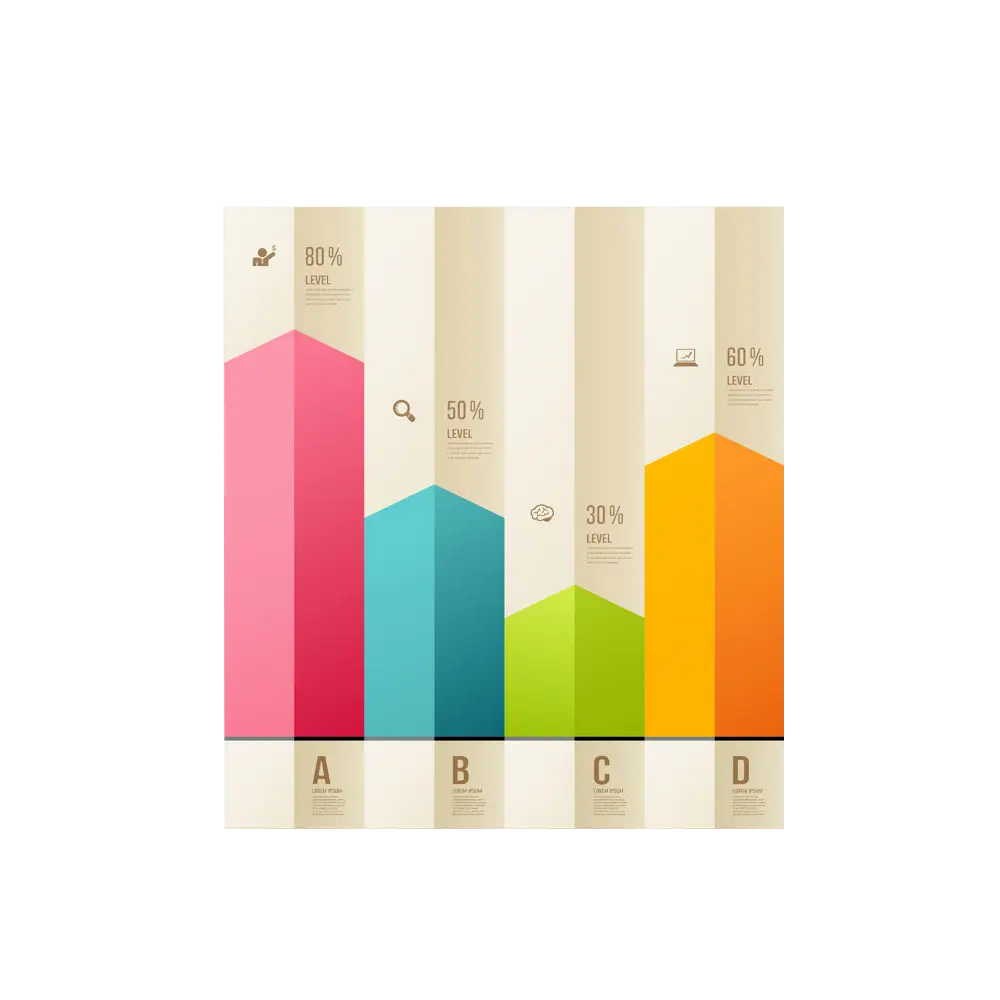
Team with Growth Graph Illustration -

Colorful Unicorn in Fantasy Style -

Colorful Summer Shorts -
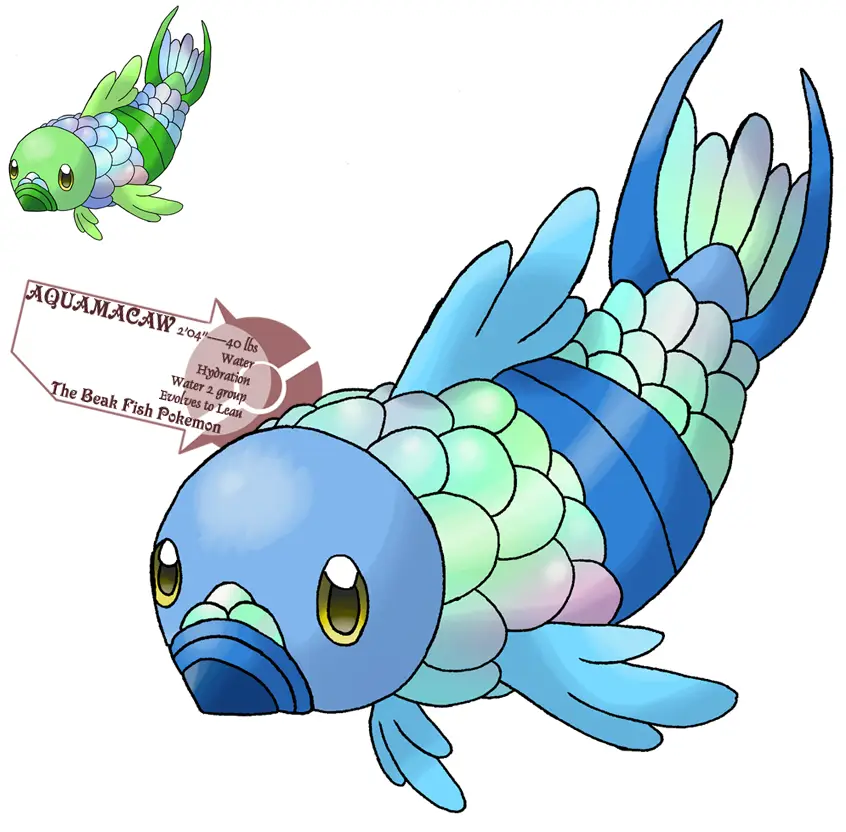
Colorful Cartoon Fish Illustration -
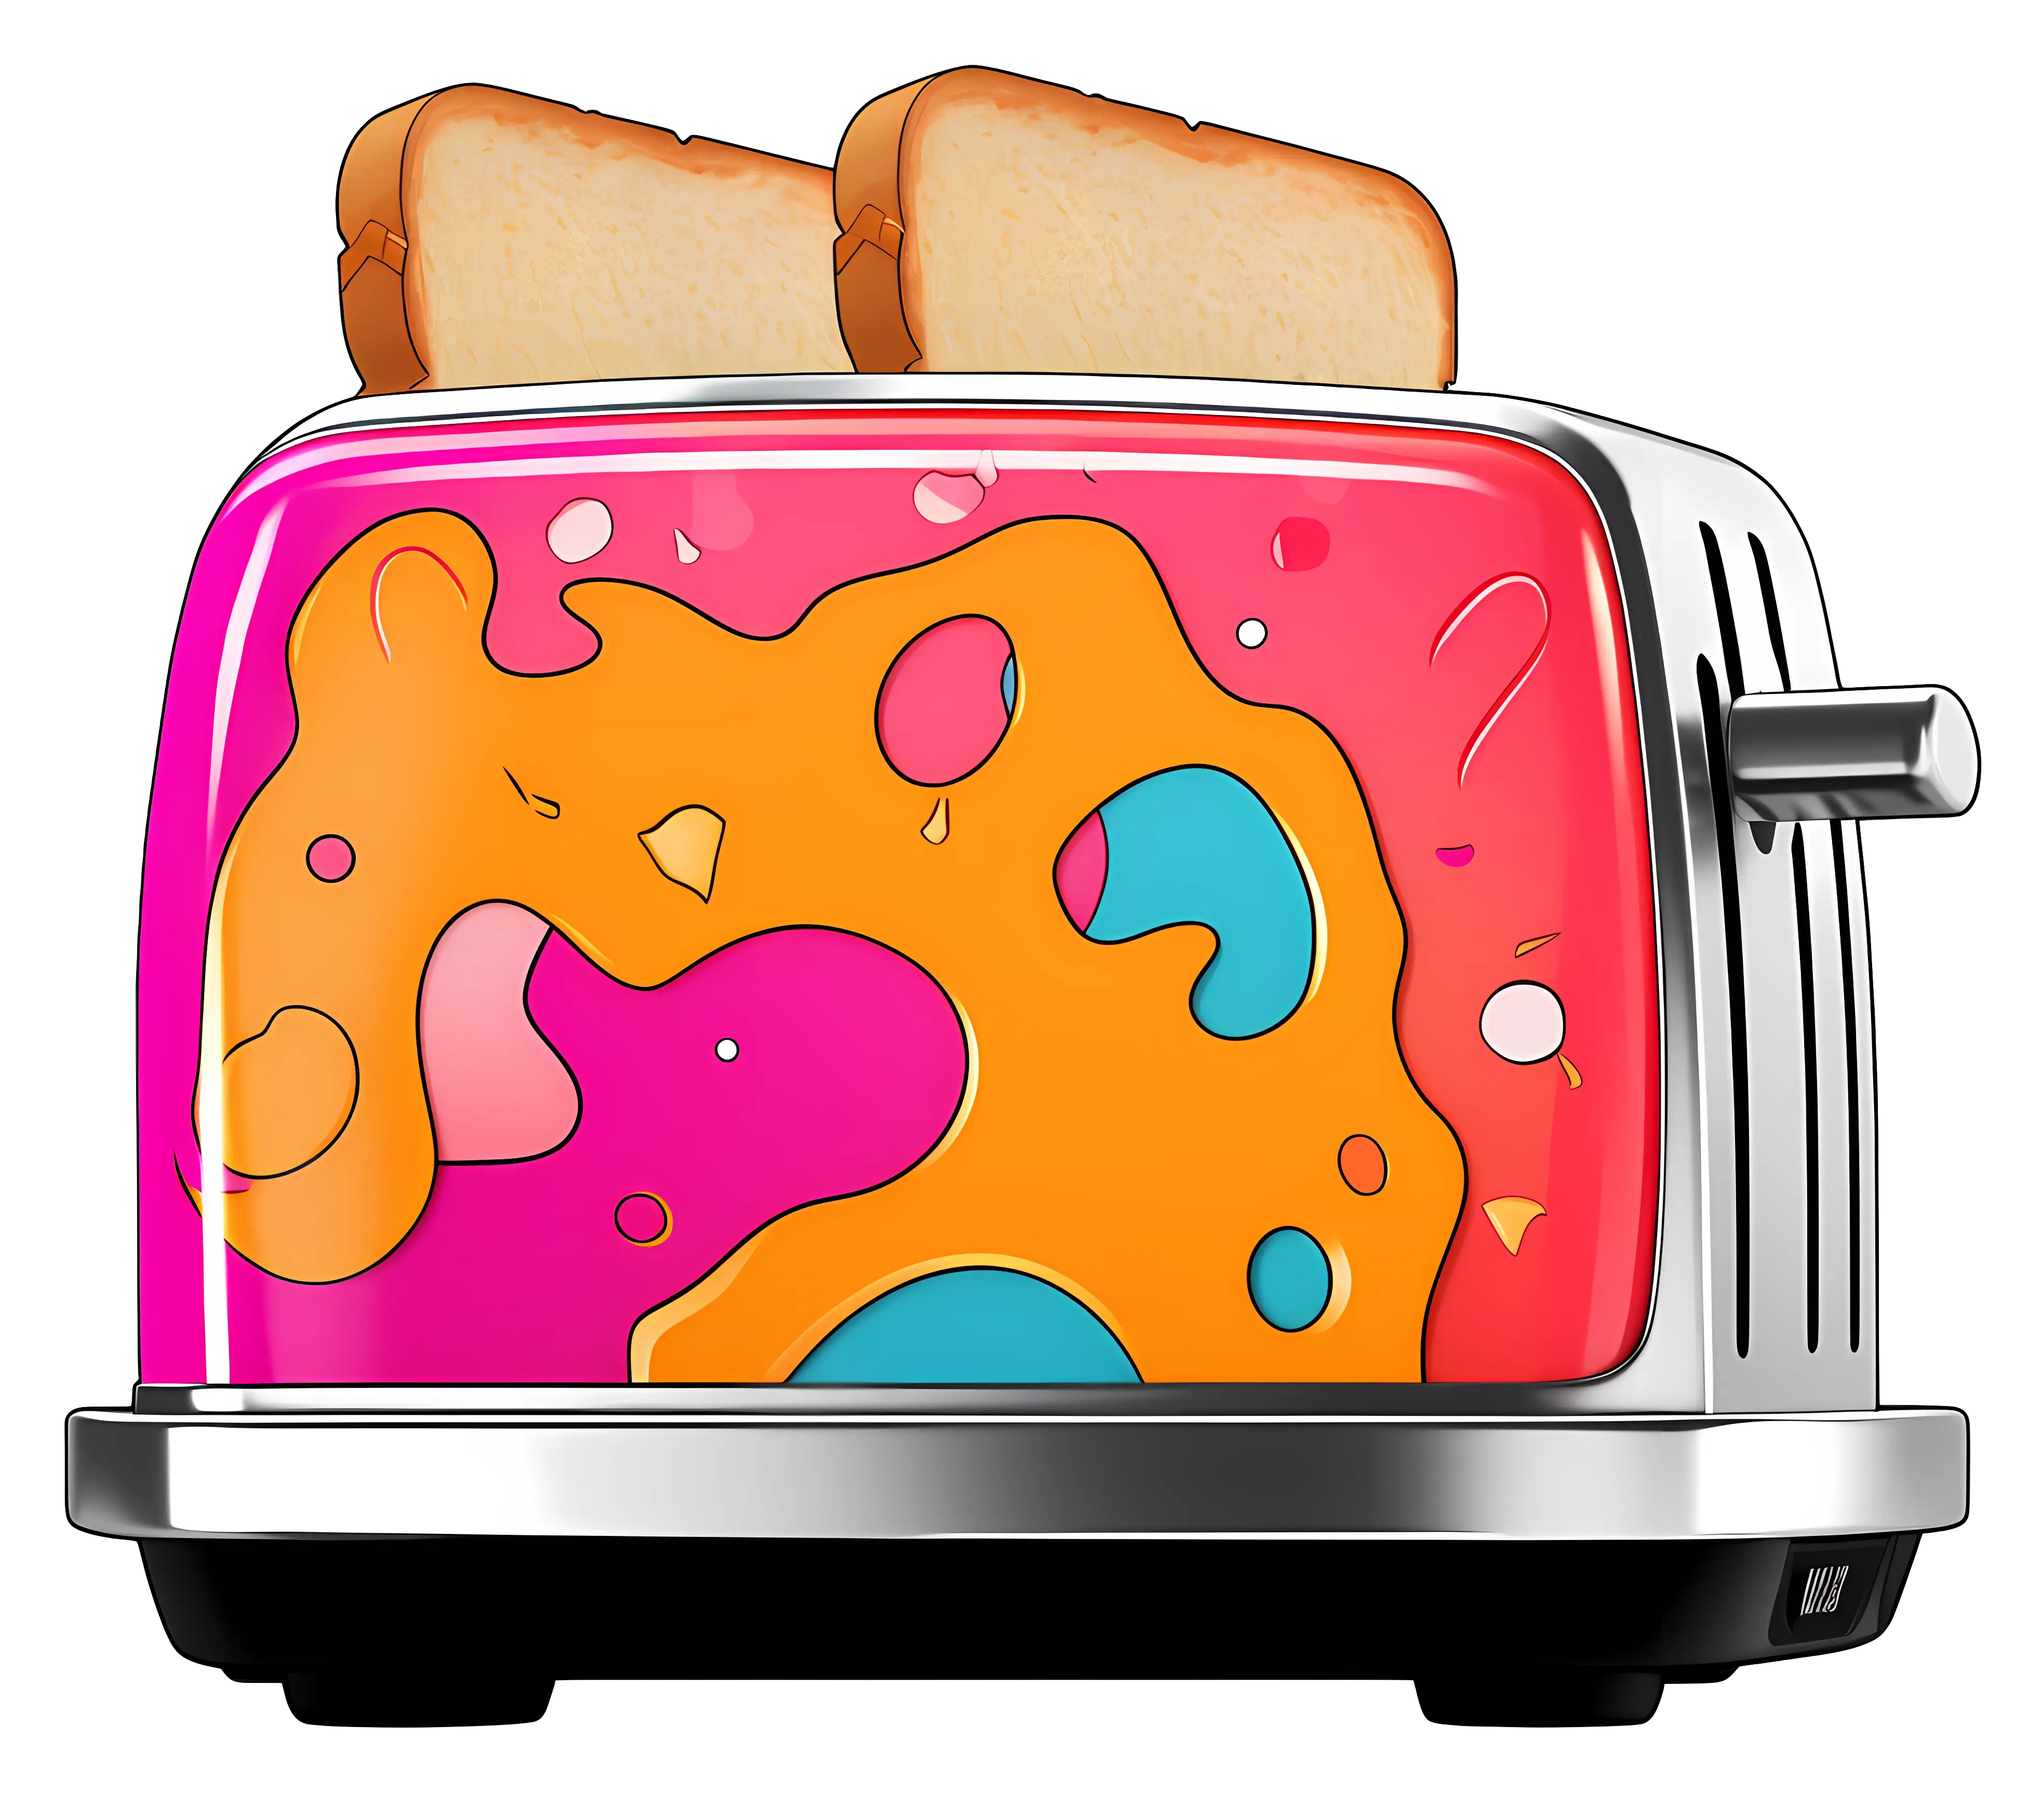
Colorful Toaster with Toast -

Yellow Cartoon Butterfly with Large Eyes -

Online Learning with Computer and Mouse -

Colorful Lollipop with Swirl Design -

Various Devices Displaying Software -
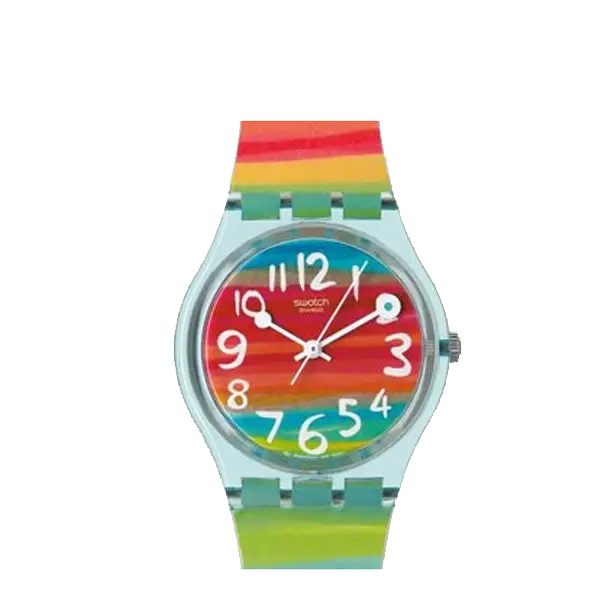
Colorful Rainbow Wristwatch -

Colorful Inflatable Beach Ball -

Open Signboard Icon for Business Representation -

Professional Tan Leather Briefcase -
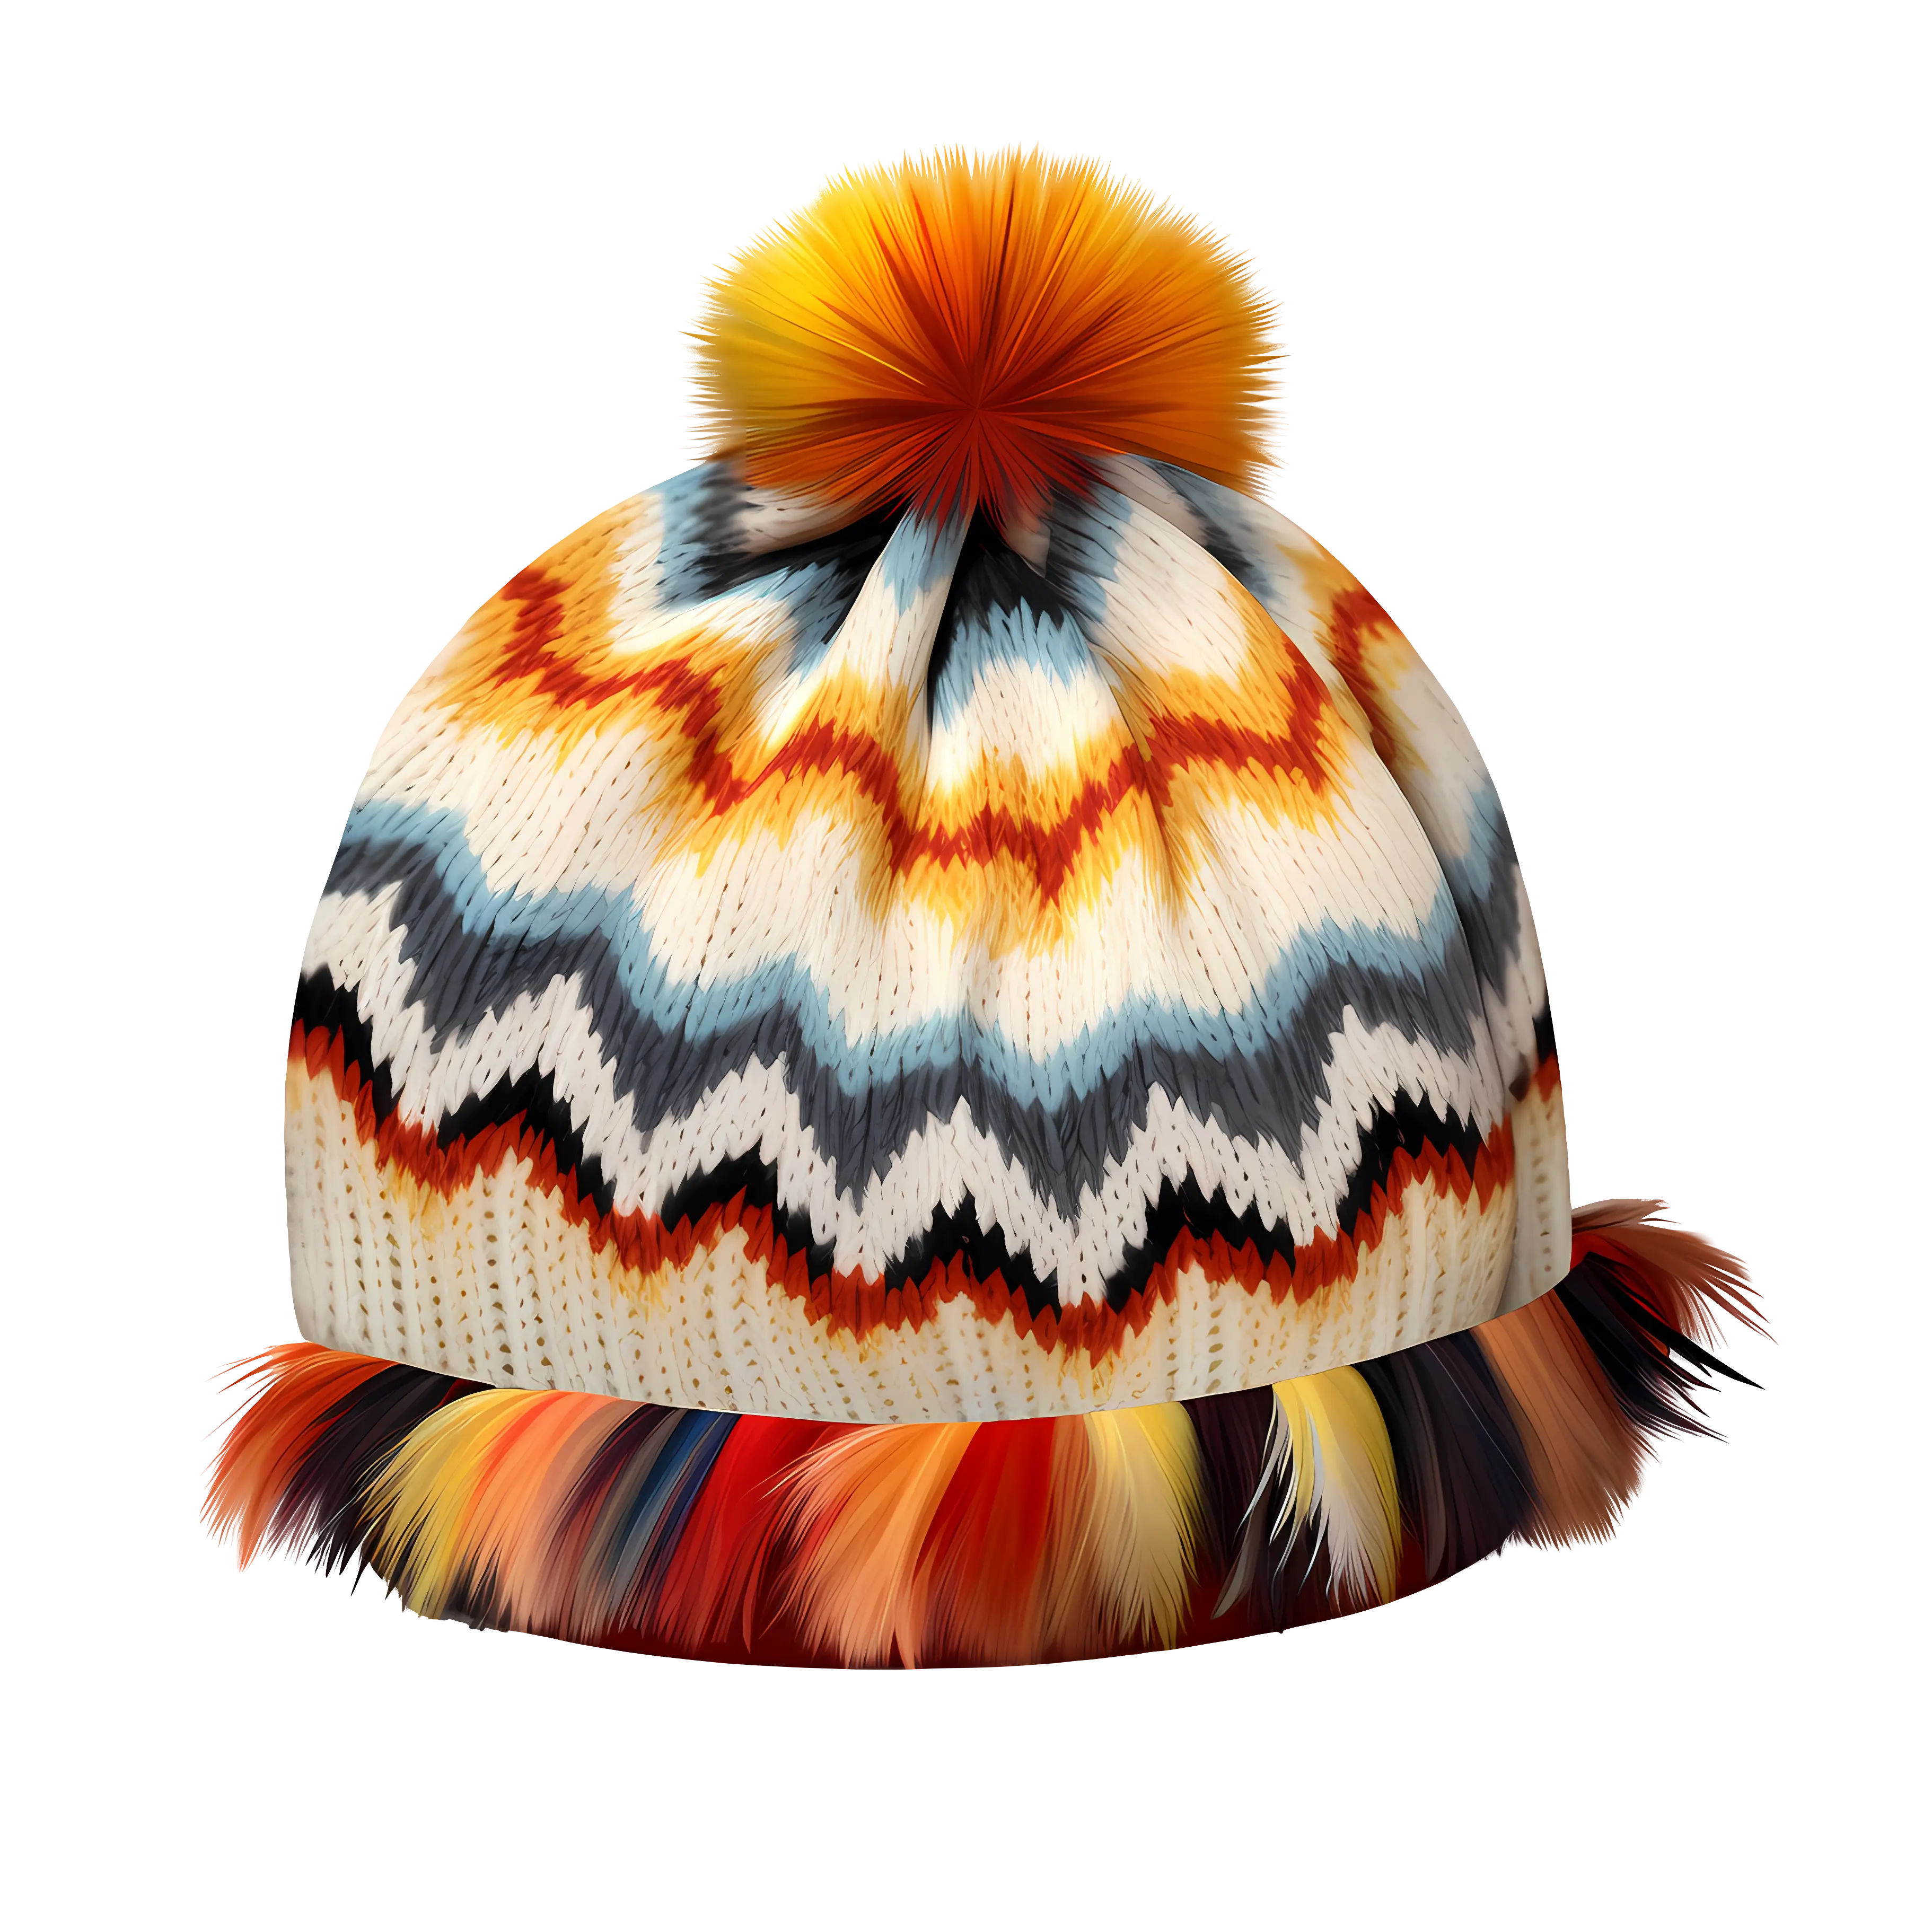
Colorful Knitted Winter Hat -
Projector Screen for Presentations -

Icon of KPI Dashboard with Graph and Person -

Thumbs Up Gesture -
Friendly Yellow Puppet Character Waving Illustration -
Bright and colorful theme of fruits and vegetables -
Vegetable Salad Bowl and Fresh Wrap -
Colorful Assortment of Fresh Fruits -

Zigzag Down Arrow Icon for Decline Representation -
Colorful Baby Onesie Design