
You Might Like
-
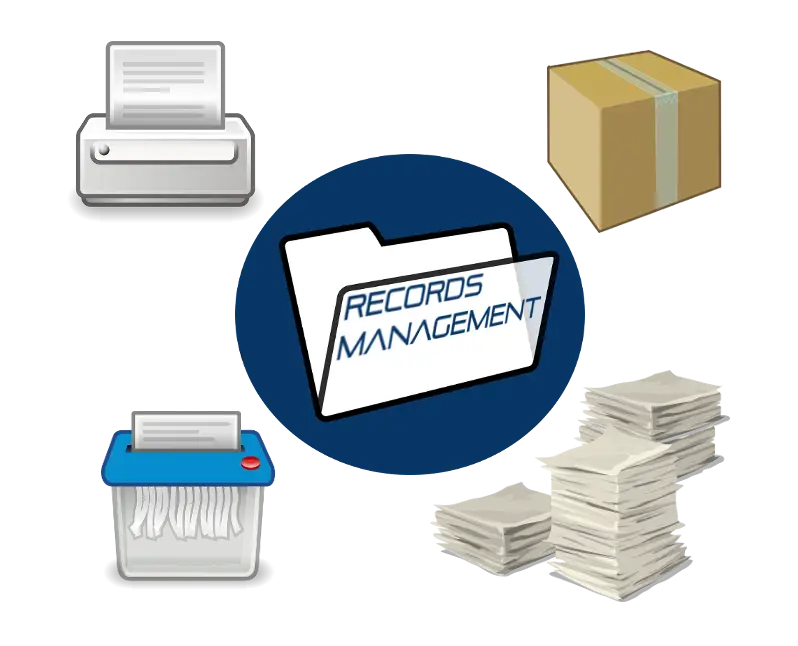
Records Management Tools -

Man Holding Completed Checklist Illustration -

Team with Growth Graph Illustration -

Business Strategy Icons -

Organizational Structure Chart -

Various Devices Displaying Software -

Icon of KPI Dashboard with Graph and Person -

Simple Checklist Icon -

Zigzag Down Arrow Icon for Decline Representation -

Laptop and Devices with Cloud -

Yellow Circular Arrow Symbol for Recycling -

Presentation Board with Graph for Business Concepts -

Yellow Ethernet Cable for Network Connections -

Bar Chart with Upward Arrow -

Industrial Valve System Design -

Infographic Pencil with Data Elements -

What's Your Schedule? -

Search Growth Icon -

Illustration of Growth Chart with Upward Arrow -

Business People with Circular Chart -
Circular Arrows Representing Cycle or Loop -

SEO Concept with Magnifying Glass and Computer -

Assorted Office Supplies and Gadgets -

Blue Declining Bar Graph with Arrow -

Business Icons Set for Digital Workflows -

Circle Pie Chart Icon -

Team Cooperation Diagram -

Head Icon with Clock Inside for Time Management Concept -

Bull Market Symbol -
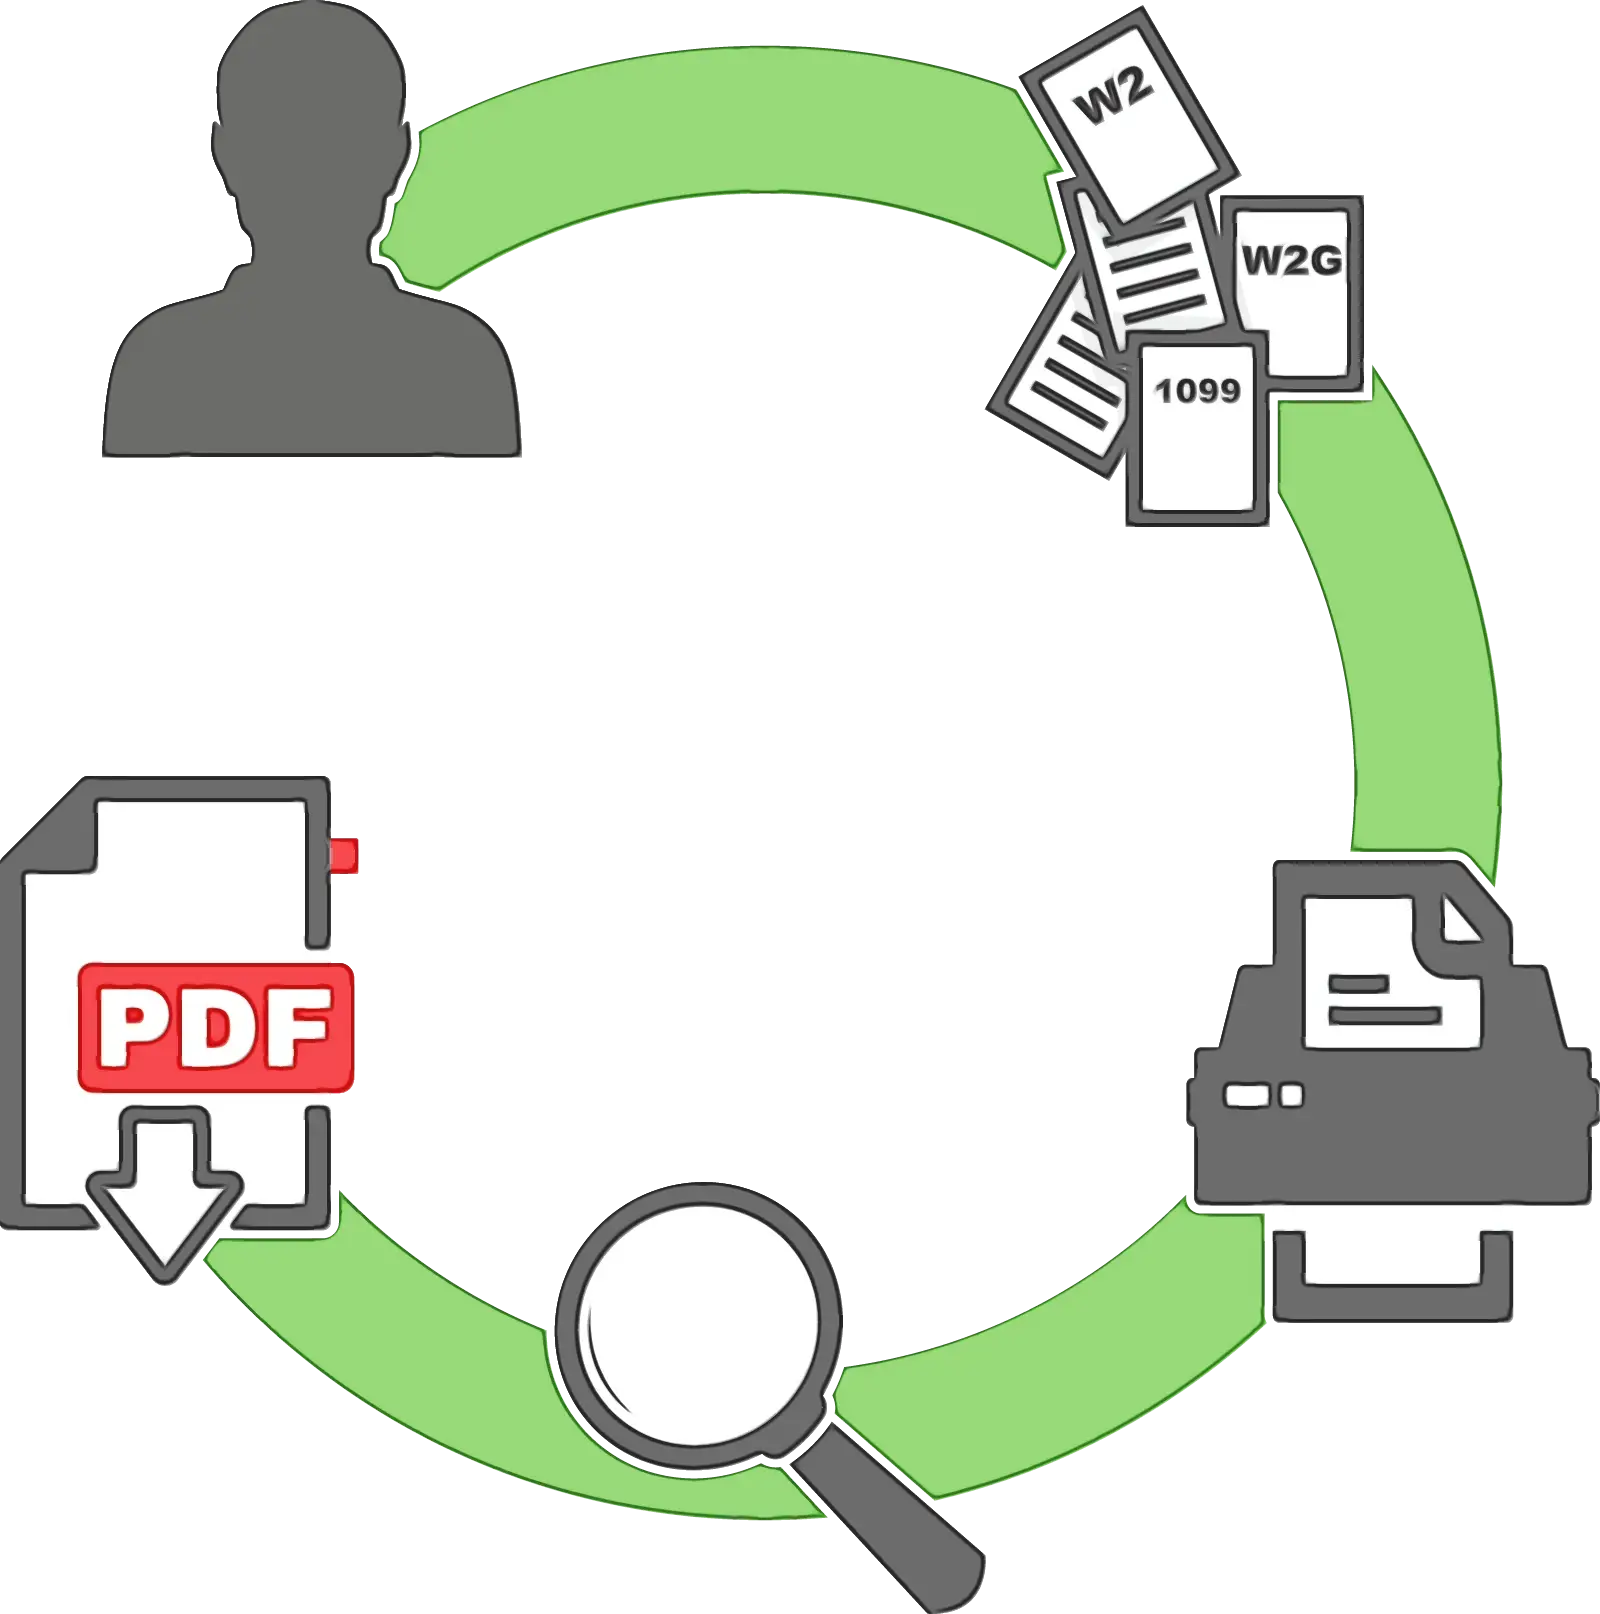
Document Processing Cycle